Lakeville: Fire Incidents, Massachusetts (MA)
Where are fire incidents reported in Lakeville, MA
Something went wrong! Please refresh the page.
|
| |||||||||||||||||||||||||||||||||||||||||||||||||||||||||||||||||||||||||||||||||||||||||||||||||||||||||||||
2002 - 2018 National Fire Incident Reporting System (NFIRS) incidents
- Incident types reported to NFIRS in Lakeville, MA
- 3,10852.8%Rescue & EMS
- 63710.8%Fire
- 5739.7%False Alarm
- 5629.6%Hazardous Condition
- 5218.9%Service Call
- 4347.4%Good Intent Call
- 230.4%Severe Weather
- 190.3%Special Incident
- Fire incident types reported to NFIRS in Lakeville, MA
- 33953.2%Outside Fires
- 18529.0%Structure Fires
- 7311.5%Mobile Property/Vehicle Fires
- 406.3%Other
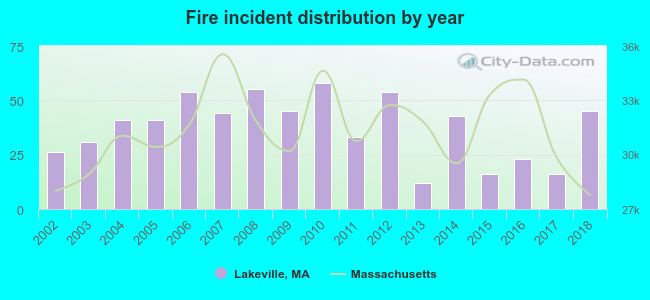 According to the data from the years 2002 - 2018 the average number of fire incidents per year is 37. The highest number of reported fires - 58 took place in 2010, and the least - 12 in 2013. The data has an increasing trend.
The average number of yearly fire incidents per 10k residents in Lakeville, MA compared to nearest cities:
(Note: Based on data for the last 3 years, including only cities with population 5,000 and above)
| Lakeville: | 26.4 |
| Middleborough: | 34.8 |
| Freetown: | 4.5 |
| Berkley: | 25.0 |
| Raynham: | 53.8 |
| Rochester: | 13.4 |
| Taunton: | 25.0 |
| Dighton: | 12.7 |
| Acushnet: | 21.7 |
 The median response time based on all reported fire incidents is 6 minutes. This is higher compared to the Massachusetts median value.
The median response time in Lakeville, MA compared to nearest cities:
(Note: Based on data for all years, including only cities with at least 500 fire incidents)
| Lakeville: | 6 minutes |
| Middleborough: | 5 minutes |
| Raynham: | 4 minutes |
| Taunton: | 4 minutes |
| Bridgewater: | 5 minutes |
| Somerset: | 6 minutes |
| New Bedford: | 4 minutes |
| West Bridgewater: | 4 minutes |
| East Bridgewater: | 5 minutes |
 29.2% incidents where reported in the morning and 70.8% in the evening. The most fires (18.5%) took place on Saturday, and the least (11.9%) on Thursday.
 According to the 637 reports from years 2002 - 2018 most fires (16.2%) took place during April, and the least (3.9%) in December.
 Out of all 5,882 cases reported during the years 2002 - 2018, the most belonged to the categories: Rescue & EMS (52.8%), Fire (10.8%), and False Alarm (9.7%).
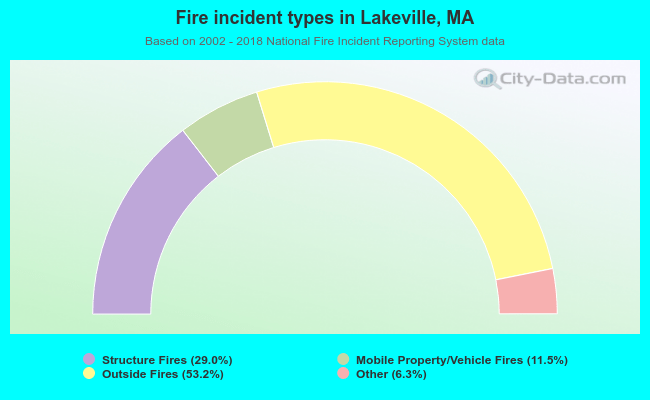 When looking into fire subcategories, the most reports belonged to: Outside Fires (53.2%), and Structure Fires (29.0%).