City of The Dalles: Fire Incidents, Oregon (OR)
Where are fire incidents reported in City of The Dalles, OR
Something went wrong! Please refresh the page.
|
| |||||||||||||||||||||||||||||||||||||||||||||||||||||||||||||||||||||||||||||||||||||||||||||||||||||||||||||
2009 - 2018 National Fire Incident Reporting System (NFIRS) incidents
- Incident types reported to NFIRS in City of The Dalles, OR
- 4,21877.6%Rescue & EMS
- 3726.8%Service Call
- 3185.8%Good Intent Call
- 3015.5%Fire
- 1252.3%False Alarm
- 771.4%Hazardous Condition
- 170.3%Special Incident
- 70.1%Overpressure Rupture
- Fire incident types reported to NFIRS in City of The Dalles, OR
- 17357.5%Outside Fires
- 7424.6%Structure Fires
- 4113.6%Mobile Property/Vehicle Fires
- 134.3%Other
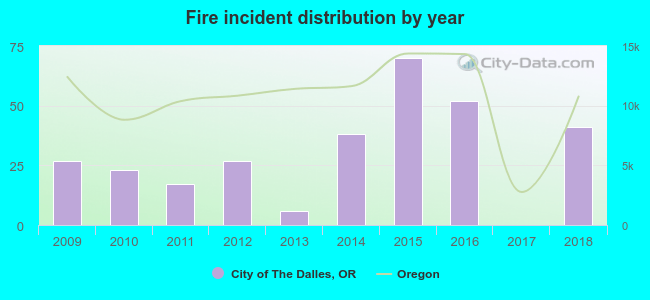 According to the data from the years 2009 - 2018 the average number of fires per year is 30. The highest number of fire incidents - 70 took place in 2015, and the least - 0 in 2017. The data has a growing trend.
The average number of yearly fire incidents per 10k residents in City of The Dalles, OR compared to nearest cities:
(Note: Based on data for the last 3 years, including only cities with population 5,000 and above)
| City of The Dalles: | 38.4 |
| The Dalles: | 14.9 |
| Hood River: | 53.5 |
| Mount Hood: | 5.2 |
| Sandy: | 30.7 |
| Troutdale: | 9.9 |
| Fairview: | 14.1 |
| Gresham: | 13.1 |
| Damascus: | 13.8 |

 According to the data from the years 2009 - 2018 the average number of fire-related casualties per year is 1. The highest number of injuries - 2 took place in 2012, and the lowest - 0 in 2009. The data has a constant trend.
 31.9% incidents where reported in the morning and 68.1% in the evening. The most fires (16.9%) took place on Monday, and the least (11.0%) on Thursday.
 Based on the 301 incident reports from years 2009 - 2018 most fires (18.3%) took place during July, and the least (4.0%) in January.
 Out of all 5,437 cases reported during the years 2009 - 2018, the most belonged to the categories: Rescue & EMS (77.6%), Service Call (6.8%), and Good Intent Call (5.8%).
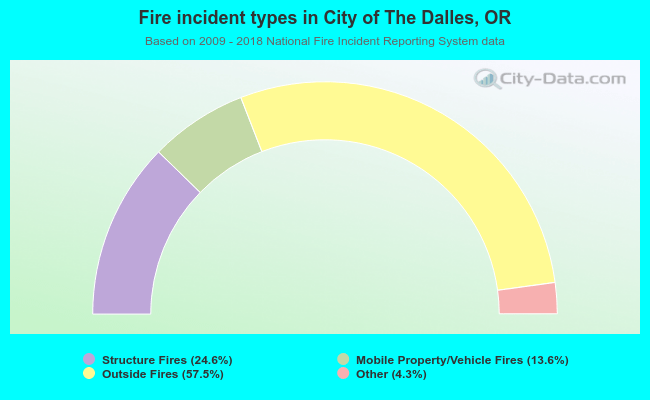 When looking into fire subcategories, the most incidents belonged to: Outside Fires (57.5%), and Structure Fires (24.6%).