The Dalles: Fire Incidents, Oregon (OR)
Where are fire incidents reported in The Dalles, OR
Something went wrong! Please refresh the page.
| Fire incidents reported | |
|---|---|
| Sreet name | Count |
| 10TH ST | 78 |
| 2ND ST | 70 |
| 6TH ST | 56 |
| 12TH ST | 54 |
| 8TH ST | 52 |
| INTERSTATE 84 FWY | 38 |
| 7TH ST | 32 |
| CHENOWITH RD | 32 |
| CHERRY HEIGHTS RD | 30 |
| TH ST | 30 |
| 11TH ST | 26 |
| 9TH ST | 26 |
| 13TH ST | 20 |
| MILL CREEK RD | 20 |
| NEAR 19TH & THOMPSON (MOTORHOM | 20 |
| ORCHARD RD | 20 |
| HWY 30 | 16 |
| 14TH ST | 14 |
| 30 HWY | 14 |
| 84 FWY | 14 |
| TAYLOR LAKE RD | 14 |
| 13TH | 12 |
| 3RD ST | 12 |
| 4TH ST | 12 |
| DRY HOLLOW RD | 12 |
| LINCOLN ST | 12 |
| SCENIC DR | 12 |
| STEELE RD | 12 |
| W 6TH | 12 |
| WRIGHT ST | 12 |
| Other | 467 |
2002 - 2016 National Fire Incident Reporting System (NFIRS) incidents
- Incident types reported to NFIRS in The Dalles, OR
- 1,25150.2%Fire
- 69427.9%Rescue & EMS
- 2218.9%Good Intent Call
- 1636.5%Service Call
- 1064.3%Hazardous Condition
- 471.9%False Alarm
- 50.2%Special Incident
- 30.1%Overpressure Rupture
- Fire incident types reported to NFIRS in The Dalles, OR
- 68754.9%Outside Fires
- 34727.7%Structure Fires
- 17013.6%Mobile Property/Vehicle Fires
- 473.8%Other
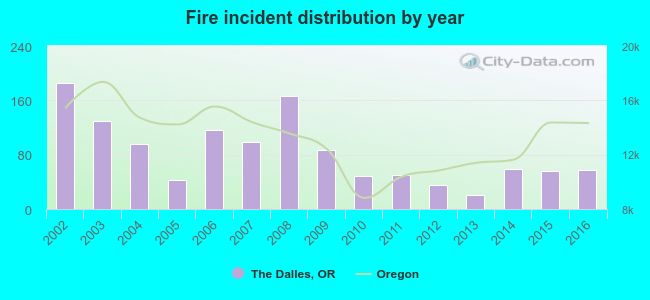 According to the data from the years 2002 - 2016 the average number of fires per year is 83. The highest number of fires - 186 took place in 2002, and the least - 20 in 2013. The data has a declining trend.
The average number of yearly fire incidents per 10k residents in The Dalles, OR compared to nearest cities:
(Note: Based on data for the last 3 years, including only cities with population 5,000 and above)
| The Dalles: | 14.9 |
| City of The Dalles: | 38.4 |
| Hood River: | 53.5 |
| Mount Hood: | 5.2 |
| Sandy: | 30.7 |
| Troutdale: | 9.9 |
| Fairview: | 14.1 |
| Gresham: | 13.1 |
| Damascus: | 13.8 |
 The median response time based on all reported fire incidents is 8 minutes. This is higher compared to the Oregon median value.
The median response time in The Dalles, OR compared to nearest cities:
(Note: Based on data for all years, including only cities with at least 500 fire incidents)
| The Dalles: | 8 minutes |
| Hood River: | 8 minutes |
| Sandy: | 8 minutes |
| Troutdale: | 5 minutes |
| Estacada: | 9 minutes |
| Gresham: | 5 minutes |
| Happy Valley: | 5 minutes |
 According to the reports from the years 2002 - 2016 the average number of fire-related fatalities per year is 0. The highest number of reported deaths - 1 took place in 2002, and the lowest - 0 in 2003. The data has a dropping trend.
 Based on the reports from the years 2002 - 2016 the average number of fire-related casualties per year is 0. The highest number of casualties - 4 took place in 2008, and the lowest - 0 in 2002. The data has a constant trend.
The average number of casualties per 1,000 fire incidents is 4. This indicator was the highest - 24 in 2008, and the lowest 0 in 2002. The trend for casualties per 1,000 fire incidents is constant. Compared to the Oregon value the number of casualties per 1,000 fire incidents is much lower.
Based on the reports from the years 2002 - 2016 the average number of fire-related casualties per year is 0. The highest number of casualties - 4 took place in 2008, and the lowest - 0 in 2002. The data has a constant trend.
The average number of casualties per 1,000 fire incidents is 4. This indicator was the highest - 24 in 2008, and the lowest 0 in 2002. The trend for casualties per 1,000 fire incidents is constant. Compared to the Oregon value the number of casualties per 1,000 fire incidents is much lower.Casualties per 1,000 incidents in The Dalles, OR compared to nearest cities:
(Note: Based on data for all years, including only cities with at least 500 fire incidents)
| The Dalles: | 5.6 |
| Hood River: | 2.0 |
| Sandy: | 15.9 |
| Troutdale: | 18.6 |
| Estacada: | 10.8 |
| Gresham: | 11.5 |
| Happy Valley: | 7.5 |
 31.7% incidents where reported in the morning and 68.3% in the evening. The most fires (15.3%) took place on Saturday, and the least (11.5%) on Monday.
 According to the 1,251 fires from years 2002 - 2016 most fires (17.6%) took place during July, and the least (4.4%) in February.
 Out of all 2,490 cases reported during the years 2002 - 2016, the most belonged to the categories: Fire (50.2%), Rescue & EMS (27.9%), and Good Intent Call (8.9%).
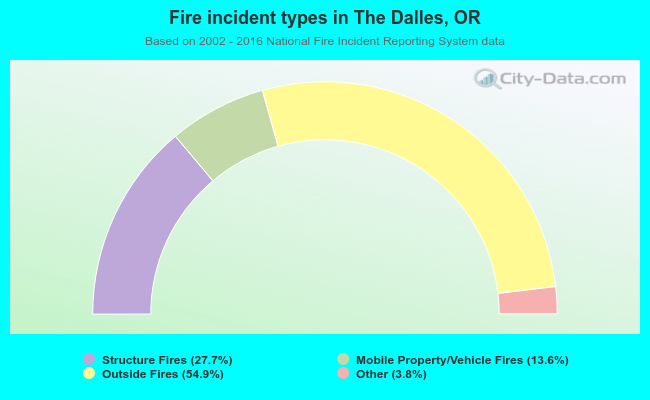 When looking into fire subcategories, the most incidents belonged to: Outside Fires (54.9%), and Structure Fires (27.7%).