Danvers: Fire Incidents, Massachusetts (MA)
Where are fire incidents reported in Danvers, MA
Something went wrong! Please refresh the page.
| Fire incidents reported | |
|---|---|
| Sreet name | Count |
| ENDICOTT ST | 306 |
| NEWBURY ST | 238 |
| INDEPENDENCE WAY | 206 |
| ANDOVER ST | 110 |
| HIGH ST | 80 |
| MAPLE ST | 76 |
| ENDICOTT ST | 64 |
| HOBART ST | 52 |
| ANDOVER ST | 50 |
| NEWBURY ST | 48 |
| CONANT ST | 42 |
| ENDICOTT ST ST | 38 |
| SYLVAN ST | 38 |
| LOCUST ST | 36 |
| PERRY TER | 36 |
| WATER ST | 36 |
| ANDOVER ST ST | 34 |
| 95N | 32 |
| 95S | 30 |
| FERNCROFT RD | 30 |
| NEWBURY ST ST | 30 |
| INDEPENDENCE WAY | 28 |
| KIRKBRIDE DR | 28 |
| LIBERTY ST | 28 |
| CABOT RD | 26 |
| CENTRE ST | 26 |
| EAST COAST RD | 26 |
| PINE ST | 26 |
| STONE ST | 26 |
| 128N | 24 |
| Other | 83 |
2002 - 2018 National Fire Incident Reporting System (NFIRS) incidents
- Incident types reported to NFIRS in Danvers, MA
- 12,58836.3%Rescue & EMS
- 11,81734.1%Service Call
- 3,72810.8%False Alarm
- 2,8828.3%Hazardous Condition
- 1,9335.6%Fire
- 1,4064.1%Good Intent Call
- 2360.7%Special Incident
- Fire incident types reported to NFIRS in Danvers, MA
- 90046.6%Outside Fires
- 67635.0%Structure Fires
- 27214.1%Mobile Property/Vehicle Fires
- 854.4%Other
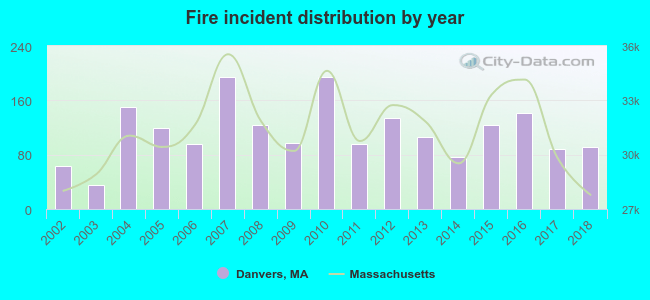 Based on the data from the years 2002 - 2018 the average number of fires per year is 114. The highest number of reported fires - 195 took place in 2007, and the least - 36 in 2003. The data has a rising trend.
The average number of yearly fire incidents per 10k residents in Danvers, MA compared to nearest cities:
(Note: Based on data for the last 3 years, including only cities with population 5,000 and above)
| Danvers: | 40.5 |
| Peabody: | 23.0 |
| Beverly: | 25.5 |
| Middleton: | 34.9 |
| Salem: | 37.4 |
| Hamilton: | 21.5 |
| Lynnfield: | 81.9 |
| Marblehead: | 19.2 |
| Lynn: | 45.3 |
 The median response time based on all reported fire incidents is 5 minutes. This is higher compared to the Massachusetts median value.
The median response time in Danvers, MA compared to nearest cities:
(Note: Based on data for all years, including only cities with at least 500 fire incidents)
| Danvers: | 5 minutes |
| Peabody: | 5 minutes |
| Beverly: | 4 minutes |
| Middleton: | 4 minutes |
| Salem: | 3 minutes |
| Topsfield: | 4 minutes |
| Hamilton: | 5 minutes |
| Lynnfield: | 5 minutes |
| Marblehead: | 4 minutes |
 Based on the reports from the years 2002 - 2018 the average number of fire-related casualties per year is 0. The highest number of reported casualties - 2 took place in 2002, and the lowest - 0 in 2003. The data has a declining trend.
The average number of casualties per 1,000 fire incidents is 5. This indicator was the highest - 31 in 2002, and the lowest 0 in 2003. The trend for injuries per 1,000 fires is decreasing. Compared to the Massachusetts value the number of casualties per 1,000 incidents is much lower.
Based on the reports from the years 2002 - 2018 the average number of fire-related casualties per year is 0. The highest number of reported casualties - 2 took place in 2002, and the lowest - 0 in 2003. The data has a declining trend.
The average number of casualties per 1,000 fire incidents is 5. This indicator was the highest - 31 in 2002, and the lowest 0 in 2003. The trend for injuries per 1,000 fires is decreasing. Compared to the Massachusetts value the number of casualties per 1,000 incidents is much lower.
 28.3% incidents where reported in the morning and 71.7% in the evening. The most fires (15.3%) took place on Monday, and the least (13.3%) on Wednesday.
 According to the 1,933 fire incident reports from years 2002 - 2018 most fires (14.3%) took place during May, and the least (4.7%) in October.
 Out of all 34,643 cases reported during the years 2002 - 2018, the most belonged to the categories: Rescue & EMS (36.3%), Service Call (34.1%), and False Alarm (10.8%).
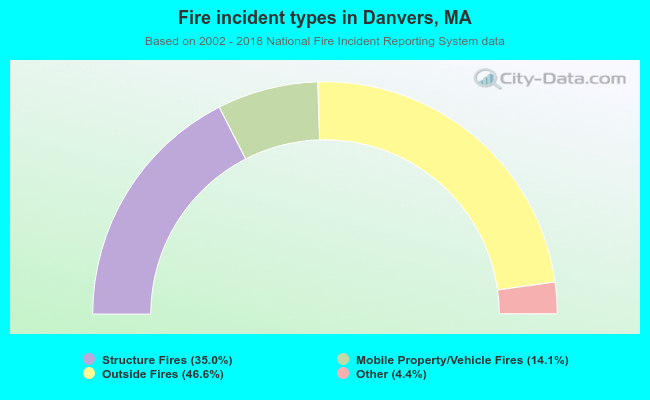 When looking into fire subcategories, the most incidents belonged to: Outside Fires (46.6%), and Structure Fires (35.0%).