Lynnfield: Fire Incidents, Massachusetts (MA)
Where are fire incidents reported in Lynnfield, MA
Something went wrong! Please refresh the page.
| Fire incidents reported | |
|---|---|
| Sreet name | Count |
| MAIN ST | 350 |
| ROSS DR | 232 |
| SALEM ST | 182 |
| SUMMER ST | 158 |
| BROADWAY | 122 |
| WALNUT ST | 76 |
| ESSEX ST | 70 |
| CENTER VLG | 68 |
| LOWELL ST | 60 |
| N BROADWAY | 60 |
| MARKET ST | 50 |
| CHESTNUT ST | 42 |
| CENTER VILLAGE | 36 |
| LOCKSLEY RD | 36 |
| LYNNBROOK RD | 36 |
| ROUTE 128 | 34 |
| KNOLL RD | 30 |
| S BROADWAY | 30 |
| STAFFORD RD | 30 |
| WILDEWOOD DR | 26 |
| KIMBALL LN | 24 |
| POST OFFICE SQ | 24 |
| EDWARD AVE | 22 |
| BOURQUE RD | 18 |
| CHARING CROSS | 18 |
| DURHAM DR | 18 |
| KIMBERLY TER | 18 |
| CORTLAND LN | 16 |
| HOMESTEAD RD | 16 |
| PERRY AVE | 16 |
2002 - 2018 National Fire Incident Reporting System (NFIRS) incidents
- Incident types reported to NFIRS in Lynnfield, MA
- 5,51950.3%Rescue & EMS
- 1,58914.5%Fire
- 1,31512.0%Hazardous Condition
- 1,19610.9%False Alarm
- 9278.5%Service Call
- 3643.3%Good Intent Call
- 250.2%Severe Weather
- 220.2%Overpressure Rupture
- Fire incident types reported to NFIRS in Lynnfield, MA
- 1,04365.6%Structure Fires
- 41726.2%Outside Fires
- 1157.2%Mobile Property/Vehicle Fires
- 140.9%Other
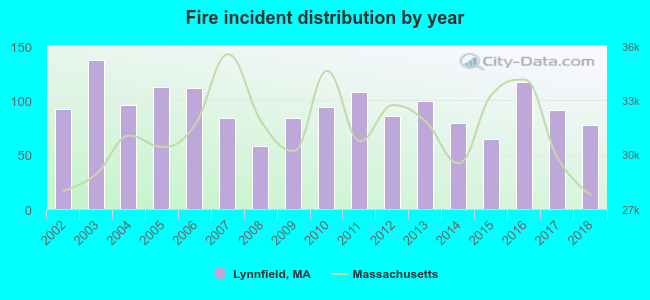 According to the data from the years 2002 - 2018 the average number of fires per year is 93. The highest number of reported fire incidents - 137 took place in 2003, and the least - 58 in 2008. The data has a dropping trend.
The average number of yearly fire incidents per 10k residents in Lynnfield, MA compared to nearest cities:
(Note: Based on data for the last 3 years, including only cities with population 5,000 and above)
| Lynnfield: | 81.9 |
| Wakefield: | 21.3 |
| Peabody: | 23.0 |
| Reading: | 29.9 |
| Saugus: | 48.2 |
| Stoneham: | 58.2 |
| Melrose: | 6.6 |
| Middleton: | 34.9 |
| Danvers: | 40.5 |
 The median response time based on all reported fire incidents is 5 minutes. This is higher than the state median value.
The median response time in Lynnfield, MA compared to nearest cities:
(Note: Based on data for all years, including only cities with at least 500 fire incidents)
| Lynnfield: | 5 minutes |
| Wakefield: | 2 minutes |
| Peabody: | 5 minutes |
| Reading: | 4 minutes |
| Saugus: | 5 minutes |
| Stoneham: | 3 minutes |
| Middleton: | 4 minutes |
| Danvers: | 5 minutes |
| North Reading: | 4 minutes |
 Based on the reports from the years 2002 - 2018 the average number of fire-related yearly casualties is 0. The highest number of injuries - 2 took place in 2006, and the lowest - 0 in 2003. The data has a dropping trend.
The average number of injuries per 1,000 fire incidents is 3. This indicator was the highest - 18 in 2006, and the lowest 0 in 2003. The trend for casualties per 1,000 fires is dropping. Compared to the Massachusetts value the number of casualties per 1,000 fires is much lower.
Based on the reports from the years 2002 - 2018 the average number of fire-related yearly casualties is 0. The highest number of injuries - 2 took place in 2006, and the lowest - 0 in 2003. The data has a dropping trend.
The average number of injuries per 1,000 fire incidents is 3. This indicator was the highest - 18 in 2006, and the lowest 0 in 2003. The trend for casualties per 1,000 fires is dropping. Compared to the Massachusetts value the number of casualties per 1,000 fires is much lower.
 28.0% incidents where reported in the morning and 72.0% in the evening. The most fires (16.4%) took place on Wednesday, and the least (11.9%) on Friday.
 Based on the 1,589 reports from years 2002 - 2018 most fires (13.0%) took place during April, and the least (5.7%) in January.
 Out of all 10,966 cases reported during the years 2002 - 2018, the most belonged to the categories: Rescue & EMS (50.3%), Fire (14.5%), and Hazardous Condition (12.0%).
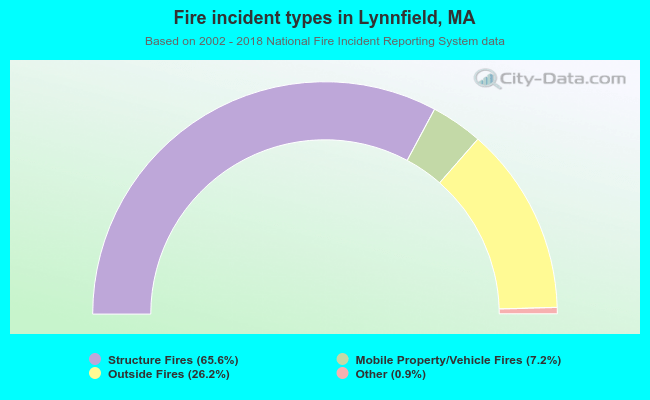 When looking into fire subcategories, the most incidents belonged to: Structure Fires (65.6%), and Outside Fires (26.2%).