Dracut: Fire Incidents, Massachusetts (MA)
Where are fire incidents reported in Dracut, MA
Something went wrong! Please refresh the page.
| Fire incidents reported | |
|---|---|
| Sreet name | Count |
| LAKEVIEW AVE | 220 |
| BRIDGE ST | 94 |
| MAMMOTH RD | 94 |
| BROADWAY RD | 80 |
| PLEASANT ST | 78 |
| MERRIMACK AVE | 74 |
| ROBBINS AVE | 66 |
| METHUEN ST | 56 |
| HILDRETH ST | 54 |
| MERRILL LN | 52 |
| NASHUA RD | 50 |
| TENNIS PLAZA RD | 50 |
| TYNGSBORO RD | 40 |
| PHINEAS ST | 38 |
| SKYLINE DR | 38 |
| ARLINGTON ST | 32 |
| PARKER AVE | 30 |
| SLADEN ST | 30 |
| THISSELL AVE | 30 |
| DONAHUE RD | 26 |
| PEMBERTON ST | 24 |
| PRIMROSE HILL RD | 24 |
| WHEELER RD | 24 |
| BOUCHARD AVE | 22 |
| COLBURN AVE | 20 |
| DONOHUE RD | 20 |
| MILL ST | 20 |
| FREDERICK ST | 18 |
| GERRISH AVE | 16 |
| GREENMONT AVE | 16 |
| Other | 33 |
2002 - 2018 National Fire Incident Reporting System (NFIRS) incidents
- Incident types reported to NFIRS in Dracut, MA
- 12,16352.6%Rescue & EMS
- 3,32914.4%False Alarm
- 2,89912.5%Service Call
- 2,42310.5%Hazardous Condition
- 1,4696.4%Fire
- 7213.1%Good Intent Call
- 790.3%Special Incident
- Fire incident types reported to NFIRS in Dracut, MA
- 55437.7%Outside Fires
- 54937.4%Structure Fires
- 19313.1%Mobile Property/Vehicle Fires
- 17311.8%Other
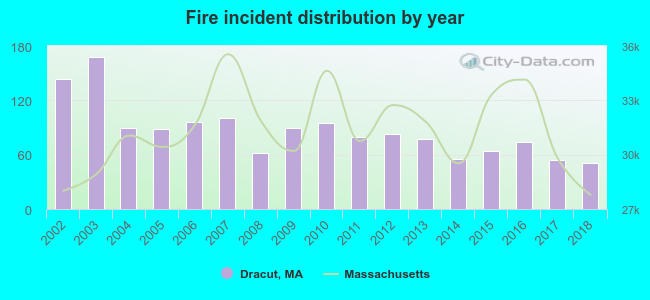 Based on the data from the years 2002 - 2018 the average number of fires per year is 86. The highest number of fire incidents - 168 took place in 2003, and the least - 51 in 2018. The data has a decreasing trend.
The average number of yearly fire incidents per 10k residents in Dracut, MA compared to nearest cities:
(Note: Based on data for the last 3 years, including only cities with population 5,000 and above)
| Dracut: | 20.3 |
| Lowell: | 41.4 |
| Tyngsborough: | 24.5 |
| Chelmsford: | 12.3 |
| Tewksbury: | 29.8 |
| Methuen: | 26.7 |
| Lawrence: | 26.0 |
| Westford: | 26.0 |
| Billerica: | 27.3 |
 The median response time based on all reported fire incidents is 5 minutes. This is higher than the Massachusetts median value.
The median response time in Dracut, MA compared to nearest cities:
(Note: Based on data for all years, including only cities with at least 500 fire incidents)
| Dracut: | 5 minutes |
| Lowell: | 3 minutes |
| Chelmsford: | 5 minutes |
| Tewksbury: | 4 minutes |
| Methuen: | 4 minutes |
| Lawrence: | 3 minutes |
| Westford: | 6 minutes |
| Billerica: | 4 minutes |
| Andover: | 6 minutes |
 Based on the reports from the years 2002 - 2018 the average number of fire-related casualties per year is 1. The highest number of reported casualties - 5 took place in 2017, and the lowest - 0 in 2002. The data has a constant trend.
The average number of casualties per 1,000 fires is 14. This indicator was the highest - 93 in 2017, and the lowest 0 in 2002. The trend for casualties per 1,000 fire incidents is constant. Compared to the state value the number of casualties per 1,000 incidents is similar.
Based on the reports from the years 2002 - 2018 the average number of fire-related casualties per year is 1. The highest number of reported casualties - 5 took place in 2017, and the lowest - 0 in 2002. The data has a constant trend.
The average number of casualties per 1,000 fires is 14. This indicator was the highest - 93 in 2017, and the lowest 0 in 2002. The trend for casualties per 1,000 fire incidents is constant. Compared to the state value the number of casualties per 1,000 incidents is similar.
 29.1% incidents where reported in the morning and 70.9% in the evening. The most fires (15.5%) took place on Friday, and the least (12.3%) on Tuesday.
 According to the 1,469 reports from years 2002 - 2018 most fires (14.9%) took place during April, and the least (6.5%) in February.
 Out of all 23,120 cases reported during the years 2002 - 2018, the most belonged to the categories: Rescue & EMS (52.6%), False Alarm (14.4%), and Service Call (12.5%).
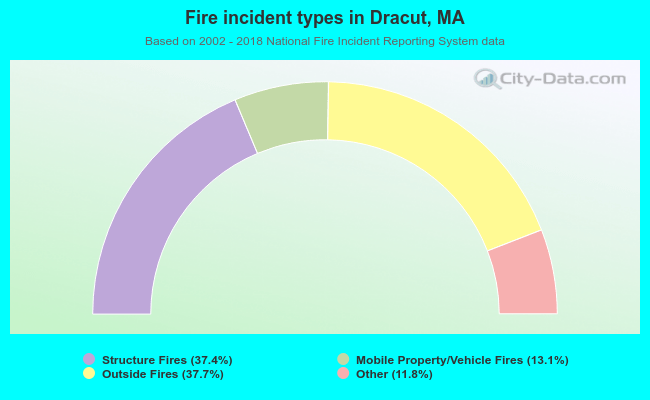 When looking into fire subcategories, the most reports belonged to: Outside Fires (37.7%), and Structure Fires (37.4%).