Dudley: Fire Incidents, Massachusetts (MA)
Where are fire incidents reported in Dudley, MA
Something went wrong! Please refresh the page.
| Fire incidents reported | |
|---|---|
| Sreet name | Count |
| CENTER RD | 74 |
| OXFORD AVE | 42 |
| SCHOFIELD AVE | 38 |
| SCHOFIELD AVENUE | 36 |
| MAIN ST | 32 |
| MASON RD | 28 |
| WEST MAIN ST | 28 |
| WEST MAIN STREET | 22 |
| BRANDON RD | 20 |
| OXFORD AVENUE | 20 |
| CENTER RD | 18 |
| JOSHUA PL | 18 |
| RAMSHORN RD | 18 |
| WEST MAIN ST | 18 |
| DUDLEY SOUTHBRIDGE RD | 16 |
| SCHOFIELD AVE | 14 |
| CENTER ROAD | 12 |
| JOSHUA PL | 12 |
| OXFORD AVE | 12 |
| WEST DUDLEY RD | 12 |
| CENTRAL AVE | 10 |
| CHARLTON RD | 10 |
| CHASE AVENUE | 10 |
| DUDLEY OXFORD RD | 10 |
| MASON RD | 10 |
| NEW BOSTON ROAD | 10 |
| SCHOFIELD AV | 10 |
| AIRPORT RD | 8 |
| ARDLOCK PLACE | 8 |
| CHARLTON RD | 8 |
| Other | 165 |
2002 - 2018 National Fire Incident Reporting System (NFIRS) incidents
- Incident types reported to NFIRS in Dudley, MA
- 1,15031.9%Hazardous Condition
- 74920.8%Fire
- 58116.1%False Alarm
- 46312.9%Rescue & EMS
- 37210.3%Good Intent Call
- 2527.0%Service Call
- 210.6%Special Incident
- 80.2%Overpressure Rupture
- 60.2%Severe Weather
- Fire incident types reported to NFIRS in Dudley, MA
- 36148.2%Structure Fires
- 27236.3%Outside Fires
- 9212.3%Mobile Property/Vehicle Fires
- 243.2%Other
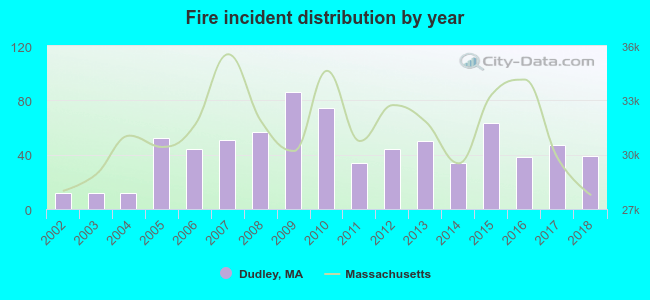 Based on the data from the years 2002 - 2018 the average number of fires per year is 44. The highest number of fire incidents - 86 took place in 2009, and the least - 12 in 2002. The data has an increasing trend.
The average number of yearly fire incidents per 10k residents in Dudley, MA compared to nearest cities:
(Note: Based on data for the last 3 years, including only cities with population 5,000 and above)
| Dudley: | 36.3 |
| Webster: | 65.7 |
| Oxford: | 162.8 |
| Charlton: | 51.9 |
| Southbridge: | 40.9 |
| Douglas: | 33.4 |
| Sutton: | 44.3 |
| Auburn: | 39.3 |
| Leicester: | 33.7 |
 The median response time based on all reported fire incidents is 9 minutes. This is much higher than the Massachusetts median value.
The median response time in Dudley, MA compared to nearest cities:
(Note: Based on data for all years, including only cities with at least 500 fire incidents)
| Dudley: | 9 minutes |
| Webster: | 8 minutes |
| Oxford: | 8 minutes |
| Charlton: | 8 minutes |
| Southbridge: | 4 minutes |
| Sturbridge: | 9 minutes |
| Douglas: | 8 minutes |
| Putnam: | 6 minutes |
| Sutton: | 8 minutes |
 Based on the reports from the years 2002 - 2018 the average number of fire-related casualties per year is 1. The highest number of reported casualties - 6 took place in 2018, and the lowest - 0 in 2003. The data has a rising trend.
The average number of injuries per 1,000 fire incidents is 33. This indicator was the highest - 167 in 2004, and the lowest 0 in 2003. The trend for injuries per 1,000 incidents is rising. Compared to the state value the number of casualties per 1,000 fire incidents is higher.
Based on the reports from the years 2002 - 2018 the average number of fire-related casualties per year is 1. The highest number of reported casualties - 6 took place in 2018, and the lowest - 0 in 2003. The data has a rising trend.
The average number of injuries per 1,000 fire incidents is 33. This indicator was the highest - 167 in 2004, and the lowest 0 in 2003. The trend for injuries per 1,000 incidents is rising. Compared to the state value the number of casualties per 1,000 fire incidents is higher.Casualties per 1,000 incidents in Dudley, MA compared to nearest cities:
(Note: Based on data for all years, including only cities with at least 500 fire incidents)
| Dudley: | 21.4 |
| Webster: | 9.1 |
| Oxford: | 26.0 |
| Charlton: | 12.7 |
| Southbridge: | 33.5 |
| Sturbridge: | 12.0 |
| Douglas: | 7.6 |
| Putnam: | 5.3 |
| Sutton: | 0.0 |
 31.6% incidents where reported in the morning and 68.4% in the evening. The most fires (15.8%) took place on Friday, and the least (12.8%) on Monday.
 According to the 749 reports from years 2002 - 2018 most fires (15.0%) took place during April, and the least (5.7%) in February.
 Out of all 3,602 cases reported during the years 2002 - 2018, the most belonged to the categories: Hazardous Condition (31.9%), Fire (20.8%), and False Alarm (16.1%).
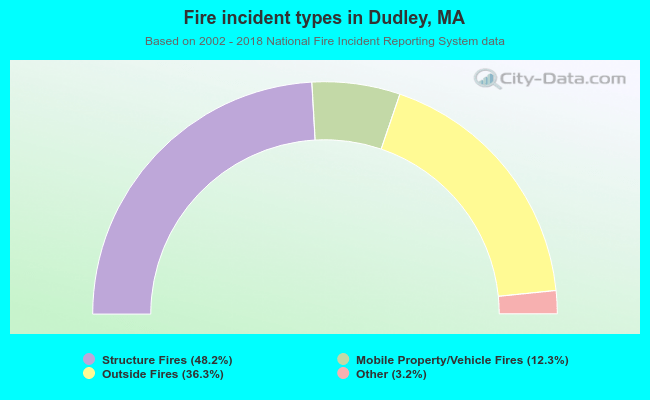 When looking into fire subcategories, the most incidents belonged to: Structure Fires (48.2%), and Outside Fires (36.3%).