Sutton: Fire Incidents, Massachusetts (MA)
Where are fire incidents reported in Sutton, MA
Something went wrong! Please refresh the page.
|
| |||||||||||||||||||||||||||||||||||||||||||||||||||||||||||||||||||||||||||||||||||||||||||||||||||||||||||||
2002 - 2018 National Fire Incident Reporting System (NFIRS) incidents
- Incident types reported to NFIRS in Sutton, MA
- 1,70642.6%Rescue & EMS
- 54513.6%Fire
- 54413.6%False Alarm
- 54213.5%Hazardous Condition
- 40010.0%Service Call
- 2616.5%Good Intent Call
- 50.1%Special Incident
- Fire incident types reported to NFIRS in Sutton, MA
- 24845.5%Structure Fires
- 14927.3%Outside Fires
- 9617.6%Mobile Property/Vehicle Fires
- 529.5%Other
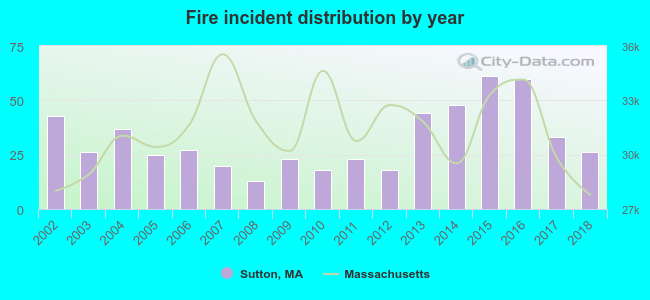 According to the data from the years 2002 - 2018 the average number of fires per year is 32. The highest number of reported fire incidents - 61 took place in 2015, and the least - 13 in 2008. The data has a declining trend.
The average number of yearly fire incidents per 10k residents in Sutton, MA compared to nearest cities:
(Note: Based on data for the last 3 years, including only cities with population 5,000 and above)
| Sutton: | 44.3 |
| Whitinsville: | 3.0 |
| Millbury: | 51.5 |
| Northbridge: | 32.5 |
| Grafton: | 8.1 |
| Douglas: | 33.4 |
| Oxford: | 162.8 |
| Auburn: | 39.3 |
| Uxbridge: | 36.2 |
 The median response time based on all reported fire incidents is 8 minutes. This is higher than the state median value.
The median response time in Sutton, MA compared to nearest cities:
(Note: Based on data for all years, including only cities with at least 500 fire incidents)
| Sutton: | 8 minutes |
| Millbury: | 6 minutes |
| Northbridge: | 7 minutes |
| Douglas: | 8 minutes |
| Oxford: | 8 minutes |
| Auburn: | 4 minutes |
| Uxbridge: | 7 minutes |
| Upton: | 5 minutes |
| Webster: | 8 minutes |
 34.3% incidents where reported in the morning and 65.7% in the evening. The most fires (19.6%) took place on Saturday, and the least (10.3%) on Wednesday.
 Based on the 545 incident reports from years 2002 - 2018 most fires (12.1%) took place during May, and the least (5.3%) in September.
 Out of all 4,008 cases reported during the years 2002 - 2018, the most belonged to the categories: Rescue & EMS (42.6%), Fire (13.6%), and False Alarm (13.6%).
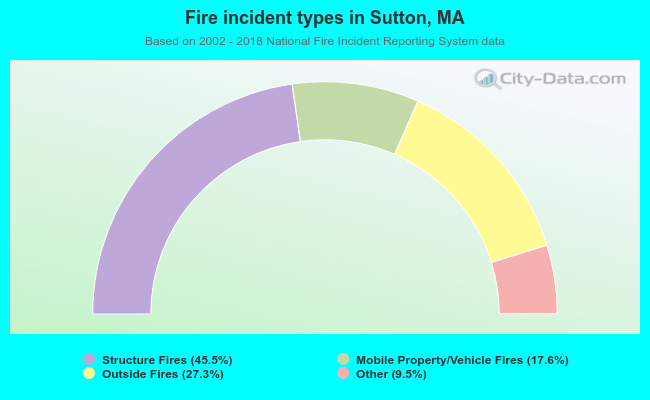 When looking into fire subcategories, the most reports belonged to: Structure Fires (45.5%), and Outside Fires (27.3%).