Upton: Fire Incidents, Massachusetts (MA)
Where are fire incidents reported in Upton, MA
Something went wrong! Please refresh the page.
| Fire incidents reported | |
|---|---|
| Sreet name | Count |
| HARTFORD AVE | 124 |
| MAIN ST | 124 |
| MILFORD ST | 82 |
| SOUTH ST | 50 |
| GROVE ST | 32 |
| PLEASANT ST | 30 |
| HOPKINTON RD | 28 |
| HIGH ST | 26 |
| MECHANIC ST | 24 |
| MENDON ST | 24 |
| WESTBORO RD | 24 |
| NORTH ST | 22 |
| TAFT ST | 20 |
| WEST RIVER ST | 20 |
| EAST ST | 18 |
| GRAFTON RD | 18 |
| PLAIN ST | 18 |
| ELM ST | 16 |
| ORCHARD ST | 16 |
| WARREN ST | 16 |
| CHESTNUT ST | 14 |
| MAPLE AVE | 14 |
| SCHOOL ST | 14 |
| CROCKETT RD | 12 |
| FISKE MILL RD | 12 |
| OAK DR | 12 |
| CHRISTIAN HILL RD | 10 |
| FOWLER ST | 10 |
| GLENVIEW ST | 10 |
| NORTH MAIN ST | 10 |
2002 - 2018 National Fire Incident Reporting System (NFIRS) incidents
- Incident types reported to NFIRS in Upton, MA
- 1,06036.6%Hazardous Condition
- 64122.1%Fire
- 53518.5%False Alarm
- 30210.4%Service Call
- 2187.5%Rescue & EMS
- 1023.5%Good Intent Call
- 180.6%Severe Weather
- 140.5%Special Incident
- 50.2%Overpressure Rupture
- Fire incident types reported to NFIRS in Upton, MA
- 32350.4%Structure Fires
- 21132.9%Outside Fires
- 548.4%Mobile Property/Vehicle Fires
- 538.3%Other
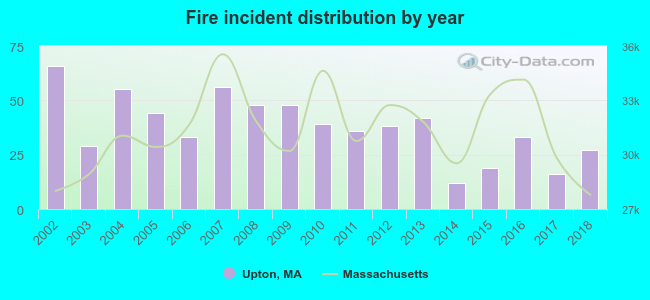 Based on the data from the years 2002 - 2018 the average number of fire incidents per year is 38. The highest number of reported fire incidents - 66 took place in 2002, and the least - 12 in 2014. The data has a declining trend.
The average number of yearly fire incidents per 10k residents in Upton, MA compared to nearest cities:
(Note: Based on data for the last 3 years, including only cities with population 5,000 and above)
| Upton: | 33.6 |
| Northbridge: | 32.5 |
| Milford: | 41.4 |
| Grafton: | 8.1 |
| Whitinsville: | 3.0 |
| Mendon: | 15.4 |
| Sutton: | 44.3 |
| Uxbridge: | 36.2 |
| Millbury: | 51.5 |
 The median response time based on all reported fire incidents is 5 minutes. This is higher compared to the Massachusetts median value.
The median response time in Upton, MA compared to nearest cities:
(Note: Based on data for all years, including only cities with at least 500 fire incidents)
| Upton: | 5 minutes |
| Northbridge: | 7 minutes |
| Milford: | 5 minutes |
| Hopkinton: | 6 minutes |
| Westborough: | 5 minutes |
| Sutton: | 8 minutes |
| Uxbridge: | 7 minutes |
| Millbury: | 6 minutes |
| Bellingham: | 7 minutes |
 33.2% incidents where reported in the morning and 66.8% in the evening. The most fires (15.3%) took place on Sunday, and the least (13.3%) on Friday.
 Based on the 641 fires from years 2002 - 2018 most fires (18.6%) took place during April, and the least (5.3%) in September.
 Out of all 2,895 cases reported during the years 2002 - 2018, the most belonged to the categories: Hazardous Condition (36.6%), Fire (22.1%), and False Alarm (18.5%).
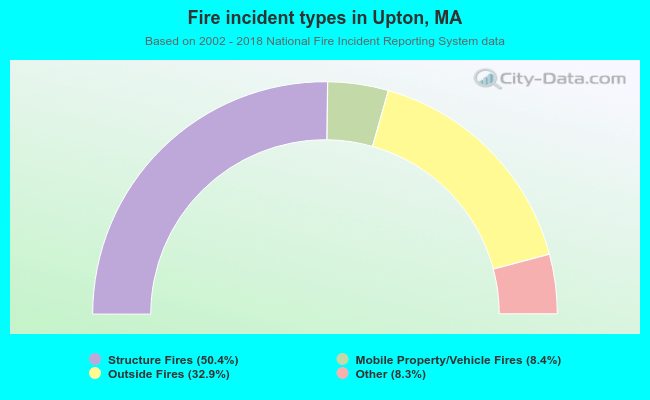 When looking into fire subcategories, the most incidents belonged to: Structure Fires (50.4%), and Outside Fires (32.9%).