Grafton: Fire Incidents, Massachusetts (MA)
Where are fire incidents reported in Grafton, MA
Something went wrong! Please refresh the page.
|
| |||||||||||||||||||||||||||||||||||||||||||||||||||||||||||||||||||||||||||||||||||||||||||||||||||||||||||||
2002 - 2018 National Fire Incident Reporting System (NFIRS) incidents
- Incident types reported to NFIRS in Grafton, MA
- 36733.2%Fire
- 25823.3%Hazardous Condition
- 22120.0%Service Call
- 12311.1%False Alarm
- 635.7%Good Intent Call
- 565.1%Rescue & EMS
- 121.1%Overpressure Rupture
- 50.5%Special Incident
- Fire incident types reported to NFIRS in Grafton, MA
- 24767.3%Structure Fires
- 6417.4%Outside Fires
- 4913.4%Mobile Property/Vehicle Fires
- 71.9%Other
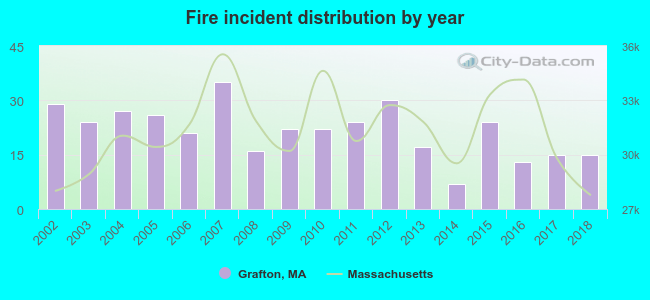 According to the data from the years 2002 - 2018 the average number of fire incidents per year is 22. The highest number of reported fire incidents - 35 took place in 2007, and the least - 7 in 2014. The data has a dropping trend.
The average number of yearly fire incidents per 10k residents in Grafton, MA compared to nearest cities:
(Note: Based on data for the last 3 years, including only cities with population 5,000 and above)
| Grafton: | 8.1 |
| Millbury: | 51.5 |
| Upton: | 33.6 |
| Shrewsbury: | 35.5 |
| Sutton: | 44.3 |
| Northbridge: | 32.5 |
| Worcester: | 74.5 |
| Whitinsville: | 3.0 |
| Auburn: | 39.3 |

 31.6% incidents where reported in the morning and 68.4% in the evening. The most fires (16.1%) took place on Thursday, and the least (12.5%) on Sunday.
 Based on the 367 fire incidents from years 2002 - 2018 most fires (15.8%) took place during January, and the least (3.0%) in December.
 Out of all 1,106 cases reported during the years 2002 - 2018, the most belonged to the categories: Fire (33.2%), Hazardous Condition (23.3%), and Service Call (20.0%).
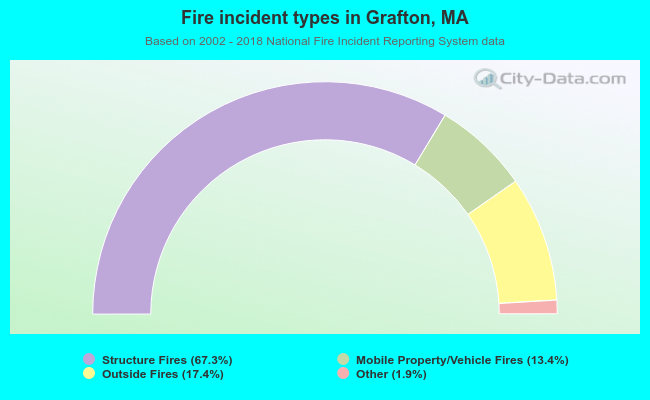 When looking into fire subcategories, the most reports belonged to: Structure Fires (67.3%), and Outside Fires (17.4%).