Northbridge: Fire Incidents, Massachusetts (MA)
Where are fire incidents reported in Northbridge, MA
Something went wrong! Please refresh the page.
| Fire incidents reported | |
|---|---|
| Sreet name | Count |
| PROVIDENCE RD | 260 |
| CHURCH ST | 116 |
| MAIN ST | 104 |
| QUAKER ST | 64 |
| HILL ST | 62 |
| LINWOOD AVE | 58 |
| SUTTON ST | 56 |
| BORDER ST | 42 |
| SCHOOL ST | 42 |
| BENSON RD | 40 |
| CHURCH AVE | 38 |
| MENDON RD | 38 |
| D ST | 34 |
| RIVERDALE ST | 34 |
| PURGATORY RD | 30 |
| CARPENTER RD | 28 |
| CRESCENT ST | 26 |
| OVERLOOK ST | 26 |
| HIGHLAND ST | 24 |
| LAKE TER | 24 |
| B ST | 22 |
| FLETCHER ST | 22 |
| NORTH MAIN ST | 22 |
| COLONIAL DR | 20 |
| THERESA CIR | 20 |
| SWIFT RD | 18 |
| VALLEY | 18 |
| COTTAGE ST | 16 |
| MARSTON RD | 16 |
| CASTLE HILL RD | 14 |
2002 - 2018 National Fire Incident Reporting System (NFIRS) incidents
- Incident types reported to NFIRS in Northbridge, MA
- 2,21527.1%Rescue & EMS
- 1,73821.3%Hazardous Condition
- 1,49018.3%False Alarm
- 1,02012.5%Fire
- 95911.8%Service Call
- 7108.7%Good Intent Call
- 140.2%Severe Weather
- 90.1%Overpressure Rupture
- Fire incident types reported to NFIRS in Northbridge, MA
- 56255.1%Structure Fires
- 30830.2%Outside Fires
- 10310.1%Mobile Property/Vehicle Fires
- 474.6%Other
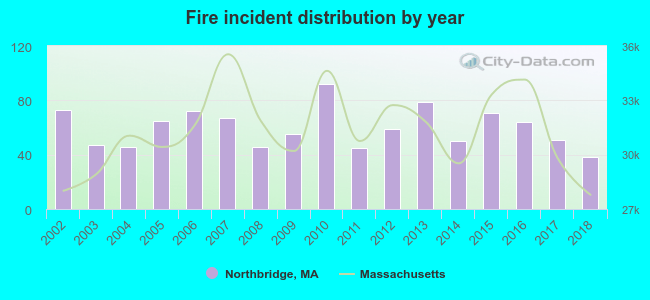 According to the data from the years 2002 - 2018 the average number of fires per year is 60. The highest number of reported fires - 92 took place in 2010, and the least - 38 in 2018. The data has a decreasing trend.
The average number of yearly fire incidents per 10k residents in Northbridge, MA compared to nearest cities:
(Note: Based on data for the last 3 years, including only cities with population 5,000 and above)
| Northbridge: | 32.5 |
| Whitinsville: | 3.0 |
| Uxbridge: | 36.2 |
| Sutton: | 44.3 |
| Upton: | 33.6 |
| Douglas: | 33.4 |
| Mendon: | 15.4 |
| Grafton: | 8.1 |
| Millbury: | 51.5 |
 The median response time based on all reported fire incidents is 7 minutes. This is higher compared to the Massachusetts median value.
The median response time in Northbridge, MA compared to nearest cities:
(Note: Based on data for all years, including only cities with at least 500 fire incidents)
| Northbridge: | 7 minutes |
| Uxbridge: | 7 minutes |
| Sutton: | 8 minutes |
| Upton: | 5 minutes |
| Douglas: | 8 minutes |
| Millbury: | 6 minutes |
| Milford: | 5 minutes |
| Blackstone: | 5 minutes |
| Bellingham: | 7 minutes |
 According to the data from the years 2002 - 2018 the average number of fire-related yearly casualties is 1. The highest number of reported injuries - 3 took place in 2010, and the lowest - 0 in 2004. The data has a constant trend.
The average number of casualties per 1,000 fires is 20. This indicator was the highest - 44 in 2011, and the lowest 0 in 2004. The trend for injuries per 1,000 incidents is rising. Compared to the Massachusetts value the number of casualties per 1,000 fires is higher.
According to the data from the years 2002 - 2018 the average number of fire-related yearly casualties is 1. The highest number of reported injuries - 3 took place in 2010, and the lowest - 0 in 2004. The data has a constant trend.
The average number of casualties per 1,000 fires is 20. This indicator was the highest - 44 in 2011, and the lowest 0 in 2004. The trend for injuries per 1,000 incidents is rising. Compared to the Massachusetts value the number of casualties per 1,000 fires is higher.Casualties per 1,000 incidents in Northbridge, MA compared to nearest cities:
(Note: Based on data for all years, including only cities with at least 500 fire incidents)
| Northbridge: | 20.6 |
| Uxbridge: | 24.6 |
| Sutton: | 0.0 |
| Upton: | 1.6 |
| Douglas: | 7.6 |
| Millbury: | 23.2 |
| Milford: | 25.0 |
| Blackstone: | 15.5 |
| Bellingham: | 12.0 |
 29.0% incidents where reported in the morning and 71.0% in the evening. The most fires (15.6%) took place on Saturday, and the least (12.5%) on Thursday.
 According to the 1,020 reports from years 2002 - 2018 most fires (14.0%) took place during April, and the least (5.4%) in September.
 Out of all 8,160 cases reported during the years 2002 - 2018, the most belonged to the categories: Rescue & EMS (27.1%), Hazardous Condition (21.3%), and False Alarm (18.3%).
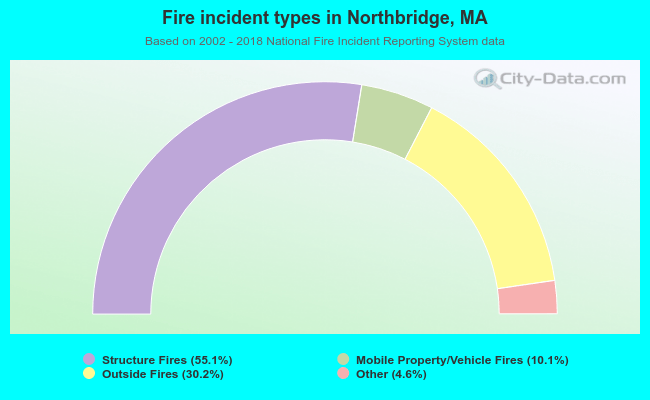 When looking into fire subcategories, the most incidents belonged to: Structure Fires (55.1%), and Outside Fires (30.2%).