Holbrook: Fire Incidents, Massachusetts (MA)
Where are fire incidents reported in Holbrook, MA
Something went wrong! Please refresh the page.
| Fire incidents reported | |
|---|---|
| Sreet name | Count |
| FRANKLIN ST | 206 |
| PLYMOUTH ST | 156 |
| HOLBROOK CT | 136 |
| UNION ST | 118 |
| LONGMEADOW DR | 86 |
| CENTRE ST | 74 |
| WEYMOUTH ST | 44 |
| SOUTH ST | 38 |
| N FRANKLIN ST | 36 |
| PINE ST | 34 |
| S FRANKLIN ST | 34 |
| SPRING ST | 34 |
| SHORE RD | 28 |
| SYCAMORE ST | 28 |
| MAPLE AVE | 24 |
| SOUTH FRANKLIN ST | 18 |
| HIGH ST | 16 |
| JUNIPER RD | 16 |
| BELCHER ST | 14 |
| FRENCH RD | 14 |
| QUINCY ST | 14 |
| CENTER ST | 12 |
| JOHNS AVE | 12 |
| MEAR RD | 12 |
| NORTH FRANKLIN ST | 12 |
| SUMMIT RD | 12 |
| HILLSDALE RD | 10 |
| HOLIDAY RD | 10 |
| KING RD | 10 |
| LINWOOD ST | 10 |
2002 - 2018 National Fire Incident Reporting System (NFIRS) incidents
- Incident types reported to NFIRS in Holbrook, MA
- 7,18741.2%Rescue & EMS
- 3,27518.8%Service Call
- 2,48314.3%Hazardous Condition
- 2,36813.6%Good Intent Call
- 1,1446.6%False Alarm
- 8955.1%Fire
- 490.3%Special Incident
- Fire incident types reported to NFIRS in Holbrook, MA
- 45751.1%Structure Fires
- 28732.1%Outside Fires
- 819.1%Mobile Property/Vehicle Fires
- 707.8%Other
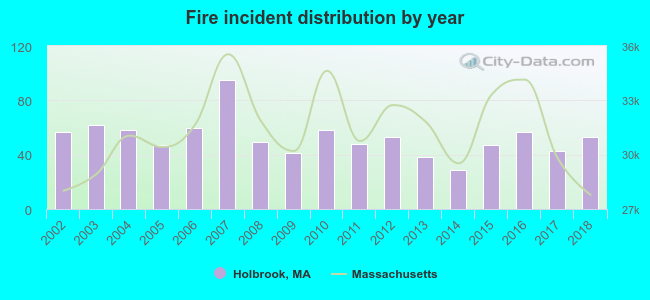 Based on the data from the years 2002 - 2018 the average number of fire incidents per year is 53. The highest number of reported fire incidents - 95 took place in 2007, and the least - 29 in 2014. The data has a declining trend.
The average number of yearly fire incidents per 10k residents in Holbrook, MA compared to nearest cities:
(Note: Based on data for the last 3 years, including only cities with population 5,000 and above)
| Holbrook: | 47.3 |
| Randolph: | 60.2 |
| Abington: | 34.0 |
| Braintree: | 24.7 |
| Brockton: | 60.2 |
| Stoughton: | 44.3 |
| Weymouth: | 50.1 |
| Rockland: | 46.9 |
| Whitman: | 19.8 |
 The median response time based on all reported fire incidents is 3 minutes. This is lower than the state median value.
The median response time in Holbrook, MA compared to nearest cities:
(Note: Based on data for all years, including only cities with at least 500 fire incidents)
| Holbrook: | 3 minutes |
| Avon: | 4 minutes |
| Randolph: | 3 minutes |
| Abington: | 4 minutes |
| Braintree: | 3 minutes |
| Brockton: | 4 minutes |
| Stoughton: | 3 minutes |
| Weymouth: | 4 minutes |
| Rockland: | 3 minutes |
 According to the reports from the years 2002 - 2018 the average number of fire-related yearly casualties is 1. The highest number of casualties - 5 took place in 2002, and the lowest - 0 in 2005. The data has a declining trend.
The average number of casualties per 1,000 fire incidents is 11. This indicator was the highest - 88 in 2002, and the lowest 0 in 2005. The trend for casualties per 1,000 fire incidents is declining. Compared to the Massachusetts value the number of injuries per 1,000 fires is similar.
According to the reports from the years 2002 - 2018 the average number of fire-related yearly casualties is 1. The highest number of casualties - 5 took place in 2002, and the lowest - 0 in 2005. The data has a declining trend.
The average number of casualties per 1,000 fire incidents is 11. This indicator was the highest - 88 in 2002, and the lowest 0 in 2005. The trend for casualties per 1,000 fire incidents is declining. Compared to the Massachusetts value the number of injuries per 1,000 fires is similar.
 27.3% incidents where reported in the morning and 72.7% in the evening. The most fires (16.4%) took place on Monday, and the least (11.8%) on Wednesday.
 Based on the 895 fire incidents from years 2002 - 2018 most fires (14.0%) took place during April, and the least (4.6%) in December.
 Out of all 17,424 cases reported during the years 2002 - 2018, the most belonged to the categories: Rescue & EMS (41.2%), Service Call (18.8%), and Hazardous Condition (14.3%).
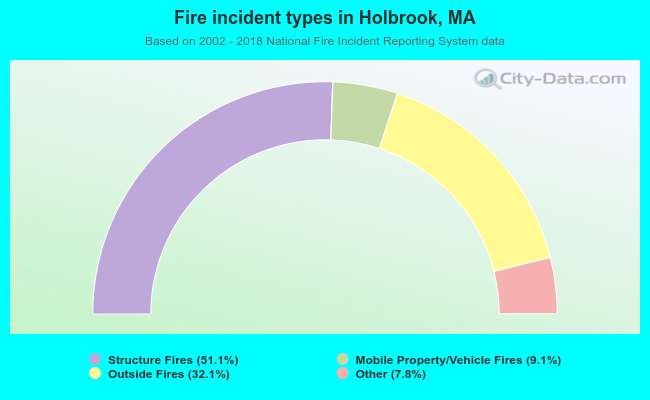 When looking into fire subcategories, the most incidents belonged to: Structure Fires (51.1%), and Outside Fires (32.1%).