Randolph: Fire Incidents, Massachusetts (MA)
Where are fire incidents reported in Randolph, MA
Something went wrong! Please refresh the page.
| Fire incidents reported | |
|---|---|
| Sreet name | Count |
| NORTH MAIN ST | 254 |
| MAIN ST | 236 |
| NORTH ST | 220 |
| CHESTNUT WEST | 196 |
| REED ST | 188 |
| SUNSHINE AVE | 170 |
| FRANCIS DR | 164 |
| HIGHLAND AVE | 150 |
| HIGHLAND GLEN DR | 114 |
| WEST ST | 98 |
| DECELLE DR | 82 |
| CHESTNUT | 76 |
| BRIDLE PATH CIR | 72 |
| HIGH ST | 70 |
| SOUTH MAIN ST | 68 |
| CANTON ST | 60 |
| LIBERTY PL | 60 |
| MAZZEO DR | 60 |
| PACELLA PARK DR | 58 |
| NELSON DR | 56 |
| POND ST | 52 |
| BRIDAL PATH CIR | 48 |
| STATE ST | 48 |
| BIRCHWOOD RD | 46 |
| BRIDLEPATH CIR | 46 |
| N MAIN ST | 46 |
| ROYAL CREST DR | 40 |
| ELDERLY DR | 38 |
| UNION ST | 38 |
| BITTERSWEET LA | 36 |
| Other | 208 |
2002 - 2018 National Fire Incident Reporting System (NFIRS) incidents
- Incident types reported to NFIRS in Randolph, MA
- 19,23856.6%Rescue & EMS
- 4,66213.7%Hazardous Condition
- 3,0989.1%Fire
- 2,9228.6%False Alarm
- 2,7728.1%Service Call
- 1,1983.5%Good Intent Call
- 960.3%Special Incident
- Fire incident types reported to NFIRS in Randolph, MA
- 1,98964.2%Structure Fires
- 67221.7%Outside Fires
- 34811.2%Mobile Property/Vehicle Fires
- 892.9%Other
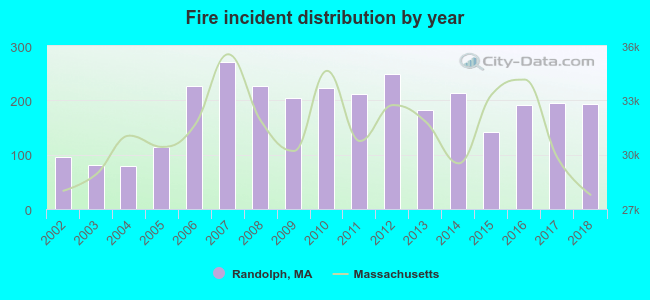 According to the data from the years 2002 - 2018 the average number of fires per year is 182. The highest number of fires - 270 took place in 2007, and the least - 79 in 2004. The data has an increasing trend.
The average number of yearly fire incidents per 10k residents in Randolph, MA compared to nearest cities:
(Note: Based on data for the last 3 years, including only cities with population 5,000 and above)
| Randolph: | 60.2 |
| Holbrook: | 47.3 |
| Braintree: | 24.7 |
| Canton: | 29.2 |
| Stoughton: | 44.3 |
| Milton: | 54.6 |
| Weymouth: | 50.1 |
| Abington: | 34.0 |
| Quincy: | 60.7 |
 The median response time based on all reported fire incidents is 3 minutes. This is lower compared to the state median value.
The median response time in Randolph, MA compared to nearest cities:
(Note: Based on data for all years, including only cities with at least 500 fire incidents)
| Randolph: | 3 minutes |
| Holbrook: | 3 minutes |
| Braintree: | 3 minutes |
| Avon: | 4 minutes |
| Canton: | 5 minutes |
| Stoughton: | 3 minutes |
| Milton: | 3 minutes |
| Weymouth: | 4 minutes |
| Abington: | 4 minutes |
 According to the data from the years 2002 - 2018 the average number of fire-related yearly deaths is 0. The highest number of deaths - 2 took place in 2007, and the lowest - 0 in 2002. The data has a constant trend.
The average number of fatalities per 1,000 fire incidents is 2. This indicator was the highest - 13 in 2004, and the lowest 0 in 2002. The trend for fatalities per 1,000 fire incidents is constant. Compared to the Massachusetts value the number of deaths per 1,000 fire incidents is similar.
According to the data from the years 2002 - 2018 the average number of fire-related yearly deaths is 0. The highest number of deaths - 2 took place in 2007, and the lowest - 0 in 2002. The data has a constant trend.
The average number of fatalities per 1,000 fire incidents is 2. This indicator was the highest - 13 in 2004, and the lowest 0 in 2002. The trend for fatalities per 1,000 fire incidents is constant. Compared to the Massachusetts value the number of deaths per 1,000 fire incidents is similar.
 Based on the reports from the years 2002 - 2018 the average number of fire-related casualties per year is 1. The highest number of casualties - 5 took place in 2007, and the lowest - 0 in 2003. The data has a constant trend.
The average number of casualties per 1,000 fire incidents is 4. This indicator was the highest - 19 in 2007, and the lowest 0 in 2003. The trend for injuries per 1,000 fires is decreasing. Compared to the Massachusetts value the number of injuries per 1,000 fires is much lower.
Based on the reports from the years 2002 - 2018 the average number of fire-related casualties per year is 1. The highest number of casualties - 5 took place in 2007, and the lowest - 0 in 2003. The data has a constant trend.
The average number of casualties per 1,000 fire incidents is 4. This indicator was the highest - 19 in 2007, and the lowest 0 in 2003. The trend for injuries per 1,000 fires is decreasing. Compared to the Massachusetts value the number of injuries per 1,000 fires is much lower.
 30.1% incidents where reported in the morning and 69.9% in the evening. The most fires (15.4%) took place on Saturday, and the least (13.4%) on Monday.
 According to the 3,098 fire incident reports from years 2002 - 2018 most fires (11.8%) took place during April, and the least (6.0%) in February.
 Out of all 34,013 cases reported during the years 2002 - 2018, the most belonged to the categories: Rescue & EMS (56.6%), Hazardous Condition (13.7%), and Fire (9.1%).
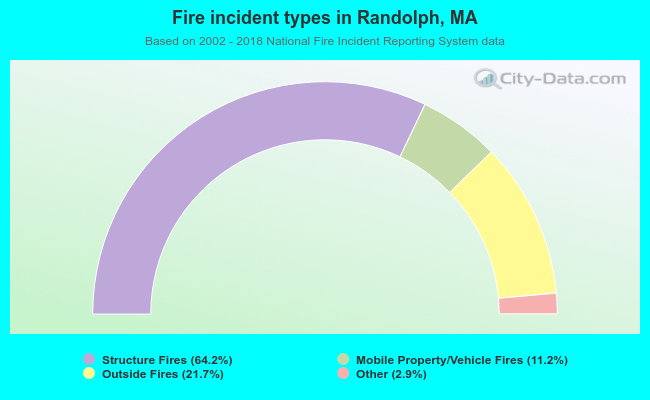 When looking into fire subcategories, the most incidents belonged to: Structure Fires (64.2%), and Outside Fires (21.7%).