Littleton: Fire Incidents, Massachusetts (MA)
Where are fire incidents reported in Littleton, MA
Something went wrong! Please refresh the page.
| Fire incidents reported | |
|---|---|
| Sreet name | Count |
| KING ST | 152 |
| RT 495 NORTH HWY | 134 |
| GREAT RD | 130 |
| RT 495 SOUTH HWY | 104 |
| FOSTER ST | 82 |
| AYER RD | 58 |
| SHATTUCK ST | 50 |
| RT 2 WEST HWY | 38 |
| TAYLOR ST | 36 |
| RUSSELL ST | 30 |
| NEW ESTATE RD | 28 |
| GOLDSMITH ST | 26 |
| NEWTOWN RD | 26 |
| WHITCOMB AVE | 26 |
| CONSTITUTION AVE | 24 |
| HARTWELL AVE | 24 |
| RT 2 EAST HWY | 24 |
| MILL RD | 22 |
| HARWOOD AVE | 20 |
| GRIST MILL RD | 18 |
| HARVARD RD | 18 |
| NASHOBA RD | 16 |
| BRUCE ST | 14 |
| MAPLEHURST RD | 14 |
| OAK HILL RD | 14 |
| BOXWOOD DR | 10 |
| CEDAR RD | 10 |
| DEER RUN RD | 10 |
| JENNIFER ST | 10 |
| MATAWANAKEE TRL | 10 |
2002 - 2018 National Fire Incident Reporting System (NFIRS) incidents
- Incident types reported to NFIRS in Littleton, MA
- 5,97353.5%Rescue & EMS
- 1,39612.5%Hazardous Condition
- 1,26611.3%False Alarm
- 9228.3%Service Call
- 8377.5%Fire
- 7006.3%Good Intent Call
- 460.4%Special Incident
- Fire incident types reported to NFIRS in Littleton, MA
- 38345.8%Structure Fires
- 21725.9%Outside Fires
- 19423.2%Mobile Property/Vehicle Fires
- 435.1%Other
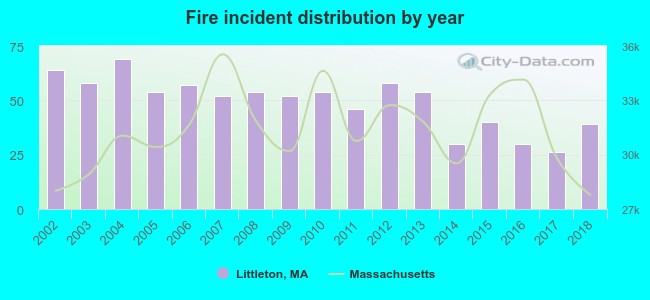 According to the data from the years 2002 - 2018 the average number of fire incidents per year is 49. The highest number of fire incidents - 69 took place in 2004, and the least - 26 in 2017. The data has a decreasing trend.
The average number of yearly fire incidents per 10k residents in Littleton, MA compared to nearest cities:
(Note: Based on data for the last 3 years, including only cities with population 5,000 and above)
| Littleton: | 35.5 |
| Westford: | 26.0 |
| Acton: | 24.9 |
| Harvard: | 36.3 |
| Maynard: | 25.7 |
| Chelmsford: | 12.3 |
| Stow: | 22.8 |
| Concord: | 30.8 |
| Tyngsborough: | 24.5 |
 The median response time based on all reported fire incidents is 6 minutes. This is higher than the Massachusetts median value.
The median response time in Littleton, MA compared to nearest cities:
(Note: Based on data for all years, including only cities with at least 500 fire incidents)
| Littleton: | 6 minutes |
| Westford: | 6 minutes |
| Ayer: | 4 minutes |
| Acton: | 4 minutes |
| Harvard: | 9 minutes |
| Chelmsford: | 5 minutes |
| Concord: | 6 minutes |
| Pepperell: | 4 minutes |
| Hudson: | 3 minutes |
 Based on the data from the years 2002 - 2018 the average number of fire-related fatalities per year is 0. The highest number of deaths - 1 took place in 2002, and the lowest - 0 in 2003. The data has a constant trend.
 Based on the data from the years 2002 - 2018 the average number of fire-related yearly casualties is 1. The highest number of reported casualties - 3 took place in 2003, and the lowest - 0 in 2006. The data has a declining trend.
The average number of casualties per 1,000 fires is 10. This indicator was the highest - 52 in 2003, and the lowest 0 in 2006. The trend for injuries per 1,000 incidents is decreasing. Compared to the Massachusetts value the number of injuries per 1,000 fire incidents is about the same.
Based on the data from the years 2002 - 2018 the average number of fire-related yearly casualties is 1. The highest number of reported casualties - 3 took place in 2003, and the lowest - 0 in 2006. The data has a declining trend.
The average number of casualties per 1,000 fires is 10. This indicator was the highest - 52 in 2003, and the lowest 0 in 2006. The trend for injuries per 1,000 incidents is decreasing. Compared to the Massachusetts value the number of injuries per 1,000 fire incidents is about the same.
 28.9% incidents where reported in the morning and 71.1% in the evening. The most fires (16.2%) took place on Monday, and the least (11.0%) on Thursday.
 Based on the 837 incident reports from years 2002 - 2018 most fires (14.9%) took place during April, and the least (6.2%) in September.
 Out of all 11,156 cases reported during the years 2002 - 2018, the most belonged to the categories: Rescue & EMS (53.5%), Hazardous Condition (12.5%), and False Alarm (11.3%).
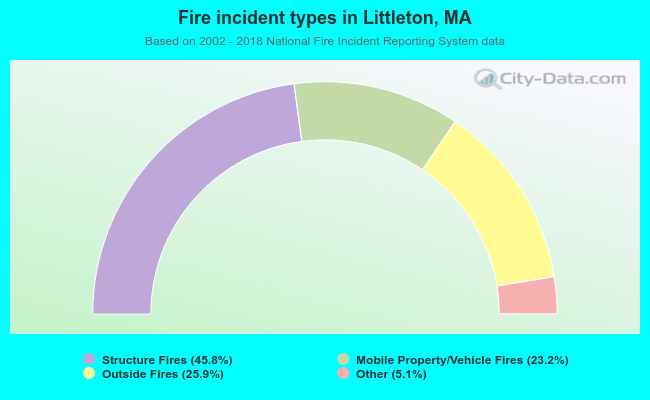 When looking into fire subcategories, the most reports belonged to: Structure Fires (45.8%), and Outside Fires (25.9%).