Maynard: Fire Incidents, Massachusetts (MA)
Where are fire incidents reported in Maynard, MA
Something went wrong! Please refresh the page.
|
| |||||||||||||||||||||||||||||||||||||||||||||||||||||||||||||||||||||||||||||||||||||||||||||||||||||||||||||
2002 - 2018 National Fire Incident Reporting System (NFIRS) incidents
- Incident types reported to NFIRS in Maynard, MA
- 3,35152.9%Rescue & EMS
- 86313.6%False Alarm
- 73211.6%Service Call
- 4927.8%Good Intent Call
- 4677.4%Hazardous Condition
- 2654.2%Fire
- 1572.5%Special Incident
- Fire incident types reported to NFIRS in Maynard, MA
- 17566.0%Structure Fires
- 4818.1%Outside Fires
- 259.4%Mobile Property/Vehicle Fires
- 176.4%Other
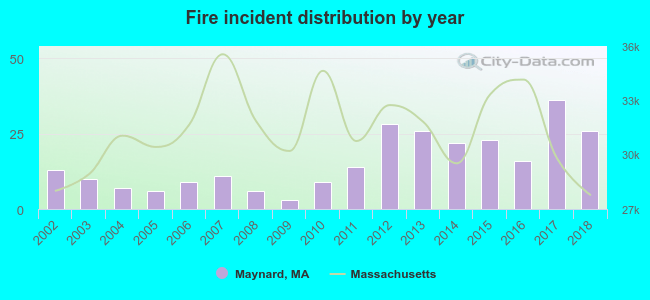 According to the data from the years 2002 - 2018 the average number of fires per year is 16. The highest number of reported fires - 36 took place in 2017, and the least - 3 in 2009. The data has an increasing trend.
The average number of yearly fire incidents per 10k residents in Maynard, MA compared to nearest cities:
(Note: Based on data for the last 3 years, including only cities with population 5,000 and above)
| Maynard: | 25.7 |
| Stow: | 22.8 |
| Acton: | 24.9 |
| Sudbury: | 15.3 |
| Concord: | 30.8 |
| Hudson: | 44.1 |
| Marlborough: | 31.4 |
| Littleton: | 35.5 |
| Wayland: | 19.2 |

 30.2% incidents where reported in the morning and 69.8% in the evening. The most fires (18.5%) took place on Saturday, and the least (9.8%) on Friday.
 Based on the 265 fire incidents from years 2002 - 2018 most fires (12.1%) took place during April, and the least (5.3%) in February.
 Out of all 6,335 cases reported during the years 2002 - 2018, the most belonged to the categories: Rescue & EMS (52.9%), False Alarm (13.6%), and Service Call (11.6%).
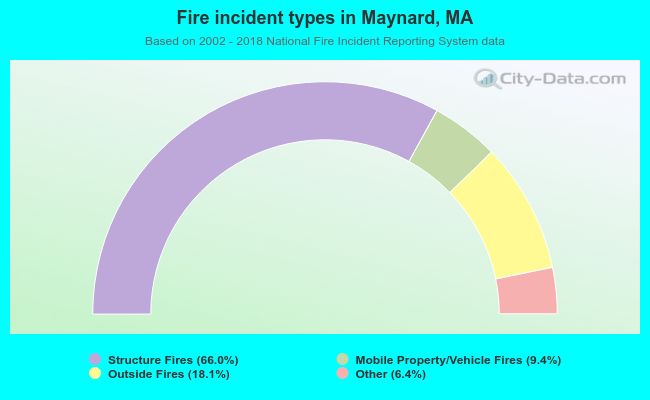 When looking into fire subcategories, the most reports belonged to: Structure Fires (66.0%), and Outside Fires (18.1%).