Melrose, MA (Massachusetts) Houses and Residents
| Melrose: | $773,151 |
| Massachusetts: | $534,700 |
Mean price in 2022:
Detached houses: $739,137
Here: $739,137 State: $651,570 Townhouses or other attached units: $830,241
Here: $830,241 State: $617,749 In 2-unit structures: $726,338
Here: $726,338 State: $594,808 In 3-to-4-unit structures: $423,092
Here: $423,092 State: $601,912 In 5-or-more-unit structures: $376,626
Here: $376,626 State: $555,768
Total population: 27,969 (Urban population: 27,134, Rural population: 0)
Houses: 12,548 (12,208 occupied: 8,030 owner occupied, 4,168 renter occupied)
| % of renters here: | 34% |
| State: | 38% |
Housing density: 2,673 houses/condos per square mile
Median price asked for vacant for-sale houses and condos in 2022: $1,166,944.
Median contract rent in 2022: $1,711 (lower quartile is $1,304, upper quartile is over $2,000)
Median rent asked for vacant for-rent units in 2022: $2,137
Median gross rent in Melrose, MA in 2022: $1,830
Housing units in Melrose with a mortgage: 5,341 (1,020 second mortgage, 38 home equity loan, 964 both second mortgage and home equity loan)
Houses without a mortgage: 249
Median household income for houses/condos with a mortgage: $179,691
Median household income for apartments without a mortgage: $90,177
Median monthly housing costs: $2,035
Compare current foreclosures near Melrose, MA:
| Photo | Address | Area | Beds / Baths | Price | Details |
|---|---|---|---|---|---|

|
#1
Linwood Ave
Melrose, MA 02176
|
2,280 sq. feet
|
2 baths 4 beds |
show details | |

|
#2
Main St
Melrose, MA 02176
|
1,302 sq. feet
|
1 baths 3 beds |
show details | |

|
#3
Green St
Melrose, MA 02176
|
1,866 sq. feet
|
2 baths 3 beds |
show details | |

|
#4
Florence Ave
Melrose, MA 02176
|
1,526 sq. feet
|
1 baths 3 beds |
show details | |

|
#5
Sylvan St # 2
Melrose, MA 02176
|
2,695 sq. feet
|
2 baths 4 beds |
show details | |

|
#6
N Mountain Ave
Melrose, MA 02176
|
1,485 sq. feet
|
2 baths 3 beds |
show details | |

|
#7
W Wyoming Ave Apt 3f
Melrose, MA 02176
|
596 sq. feet
|
1 baths 1 beds |
show details | |

|
#8
Holbrook Ct
Melrose, MA 02176
|
1,679 sq. feet
|
2 baths 5 beds |
show details | |

|
#9
Willow St Unit 212
Melrose, MA 02176
|
705 sq. feet
|
1 baths 1 beds |
show details | |

|
#10
Grove St
Melrose, MA 02176
|
2,479 sq. feet
|
2 baths 8 beds |
show details |
| Photo | Address | Area | Beds / Baths | Price | Details |
|---|---|---|---|---|---|

|
#11
Franklin St
Melrose, MA 02176
|
3,932 sq. feet
|
2 baths 4 beds |
show details | |

|
#12
Warren St
Melrose, MA 02176
|
1,691 sq. feet
|
1 baths 3 beds |
show details | |

|
#13
Vine St
Melrose, MA 02176
|
- sq. feet
|
- baths - beds |
show details | |

|
#14
Nason Dr Apt 412
Melrose, MA 02176
|
- sq. feet
|
- baths - beds |
show details | |

|
#15
Pleasant St Apt E
Melrose, MA 02176
|
- sq. feet
|
- baths - beds |
show details | |

|
#16
Johnson Rd
North Weymouth, MA 02191
|
748 sq. feet
|
1 baths 2 beds |
$365,000
|
show details |

|
#17
Adams St
Hyde Park, MA 02136
|
1,988 sq. feet
|
2 baths 4 beds |
$499,200
|
show details |

|
#18
Boyd St
Boston, MA 02124
|
3,970 sq. feet
|
3 baths 9 beds |
$650,000
|
show details |

|
#19
Stevens Ave
Middleton, MA 01949
|
1,396 sq. feet
|
2 baths 3 beds |
$535,600
|
show details |

|
#20
Church St
Boston, MA 02122
|
3,663 sq. feet
|
3 baths 6 beds |
show details |
| Photo | Address | Area | Beds / Baths | Price | Details |
|---|---|---|---|---|---|

|
#21
Jerome St
Medford, MA 02155
|
1,448 sq. feet
|
3 baths 3 beds |
show details | |

|
#22
Woodlands Rd
Salem, MA 01970
|
2,112 sq. feet
|
3 baths 3 beds |
show details | |

|
#23
Hamilton Rd
Peabody, MA 01960
|
2,832 sq. feet
|
4 baths 4 beds |
show details | |

|
#24
Laurel Hollow Rd
Boxford, MA 01921
|
5,207 sq. feet
|
5 baths 4 beds |
show details | |

|
#25
Essex St
Swampscott, MA 01907
|
2,029 sq. feet
|
2 baths 3 beds |
show details | |

|
#26
Avola St
Arlington, MA 02476
|
1,773 sq. feet
|
2 baths 3 beds |
show details | |

|
#27
Congress Pl
Dedham, MA 02026
|
1,966 sq. feet
|
2 baths 4 beds |
show details | |

|
#28
Trident Ave
Winthrop, MA 02152
|
3,912 sq. feet
|
4 baths 5 beds |
show details | |

|
#29
Homer Ave Apt 307
Cambridge, MA 02138
|
690 sq. feet
|
1 baths 1 beds |
show details | |

|
#30
Stafford St
Dedham, MA 02026
|
2,050 sq. feet
|
2 baths 5 beds |
show details |
| Photo | Address | Area | Beds / Baths | Price | Details |
|---|---|---|---|---|---|

|
#31
West St
Wilmington, MA 01887
|
1,448 sq. feet
|
2 baths 3 beds |
show details | |

|
#32
Eastern Ave
Lynn, MA 01902
|
1,881 sq. feet
|
1 baths 4 beds |
show details | |

|
#33
Nectar Pl
Nahant, MA 01908
|
7,671 sq. feet
|
5 baths 4 beds |
show details | |

|
#34
Pleasant View Ave
Lynn, MA 01902
|
1,372 sq. feet
|
2 baths 3 beds |
show details | |

|
#35
Washington St
Hyde Park, MA 02136
|
3,131 sq. feet
|
3 baths 5 beds |
show details | |

|
#36
Maple Ave
Nahant, MA 01908
|
5,184 sq. feet
|
4 baths 6 beds |
show details | |

|
#37
W Cedar St Apt 2
Boston, MA 02114
|
740 sq. feet
|
1 baths 2 beds |
show details | |

|
#38
Salem St
North Andover, MA 01845
|
1,572 sq. feet
|
1 baths 2 beds |
show details | |

|
#39
Main St
Tewksbury, MA 01876
|
1,568 sq. feet
|
2 baths 3 beds |
show details | |

|
#40
Suomi Rd # 81a
Quincy, MA 02169
|
895 sq. feet
|
2 baths 2 beds |
show details |
| Photo | Address | Area | Beds / Baths | Price | Details |
|---|---|---|---|---|---|

|
#41
Lowell St
Lynnfield, MA 01940
|
2,330 sq. feet
|
2 baths 3 beds |
show details | |

|
#42
W Newton St Apt 3
Boston, MA 02116
|
639 sq. feet
|
1 baths 1 beds |
show details | |

|
#43
Rosemary Rd
Dedham, MA 02026
|
1,376 sq. feet
|
2 baths 3 beds |
show details | |

|
#44
E St # 19s
Boston, MA 02127
|
1,350 sq. feet
|
2 baths 2 beds |
show details | |

|
#45
Littlefield St
Quincy, MA 02169
|
1,274 sq. feet
|
1 baths 4 beds |
show details | |

|
#46
Quentin St
Quincy, MA 02169
|
2,642 sq. feet
|
4 baths 5 beds |
show details | |

|
#47
Dexter Ave
Watertown, MA 02472
|
1,964 sq. feet
|
2 baths 3 beds |
show details | |

|
#48
Shirley St
Winthrop, MA 02152
|
1,701 sq. feet
|
2 baths 4 beds |
show details | |

|
#49
Dedham St
Hyde Park, MA 02136
|
1,538 sq. feet
|
1 baths 3 beds |
show details | |

|
Check over 1 million property listings on Foreclosure.com!
|
browse all offers | |||

Latest news about housing in Melrose, MA collected exclusively by city-data.com from local newspapers, TV, and radio stations

 | How Much Massachusetts Households Make Per Year: Census Data (37 replies) |
| household income map of Boston area (75 replies) |
| Could This House in Melrose Be Rescued? (12 replies) |
| Building garage and adding AC to homes in Melrose (6 replies) |
| apartments in Melrose (0 replies) |
| Eastern MA Towns with Historic Homes, Large Lots, & Cute Town Center (22 replies) |

Median year apartment built: 1967
Household type by relationship:
Households: 29,367- Male householders: 6,052 (993 living alone), Female householders: 5,939 (2,501 living alone)
6,544 spouses (6,338 opposite-sex spouses), 528 unmarried partners, (490 opposite-sex unmarried partners), 8,138 children (7,876 natural, 185 adopted, 76 stepchildren), 86 grandchildren, 244 brothers or sisters, 692 parents, 7 foster children, 246 other relatives, 541 non-relatives
- In group quarters: 344
Size of family households: 3,138 2-persons, 1,992 3-persons, 2,046 4-persons, 352 5-persons, 97 6-persons, 97 7-or-more-persons.
Size of nonfamily households: 3,643 1-person, 727 2-persons, 70 3-persons, 8 4-persons, 18 5-persons.
5,025 married couples with children.
506 single-parent households (155 men, 351 women).
78.6% of residents of Melrose speak English at home.
4.5% of residents speak Spanish at home (76% speak English very well, 18% speak English well, 4% speak English not well, 2% don't speak English at all).
6.9% of residents speak other Indo-European language at home (77% speak English very well, 15% speak English well, 5% speak English not well, 3% don't speak English at all).
6.5% of residents speak Asian or Pacific Island language at home (58% speak English very well, 25% speak English well, 4% speak English not well, 13% don't speak English at all).
3.3% of residents speak other language at home (61% speak English very well, 25% speak English well, 14% speak English not well).
Foreign born population: 4,705 (16.0%)
(62.0% of them are naturalized citizens)
| Here: | 7.1 |
| State: | 6.5 |
| Here: | 3.4 |
| State: | 4.0 |

- Bedrooms in owner-occupied houses and condos in Melrose, Massachusetts
- 30no bedroom
- 1791 bedroom
- 1,2782 bedrooms
- 3,9913 bedrooms
- 2,0534 bedrooms
- 4995+ bedrooms

- Bedrooms in renter-occupied apartments in Melrose, Massachusetts
- 369no bedroom
- 1,7781 bedroom
- 1,6232 bedrooms
- 1803 bedrooms
- 1754 bedrooms
- 435+ bedrooms

- Cars and other vehicles available in Melrose in owner-occupied houses/condos
- 244no vehicle
- 2,6631 vehicle
- 3,7512 vehicles
- 1,0563 vehicles
- 2794 vehicles
- 375+ vehicles

- Cars and other vehicles available in Melrose in renter-occupied apartments
- 857no vehicle
- 2,1571 vehicle
- 9832 vehicles
- 1713 vehicles
- 04 vehicles
- 05+ vehicles

- Rooms in owner-occupied houses in Melrose, Massachusetts
- 151 room
- 462 rooms
- 2623 rooms
- 3744 rooms
- 6745 rooms
- 1,6526 rooms
- 1,6047 rooms
- 1,6108 rooms
- 1,7939+ rooms

- Rooms in renter-occupied apartments in Melrose, Massachusetts
- 3341 room
- 3432 rooms
- 1,5063 rooms
- 9984 rooms
- 3435 rooms
- 2956 rooms
- 1417 rooms
- 958 rooms
- 1149+ rooms


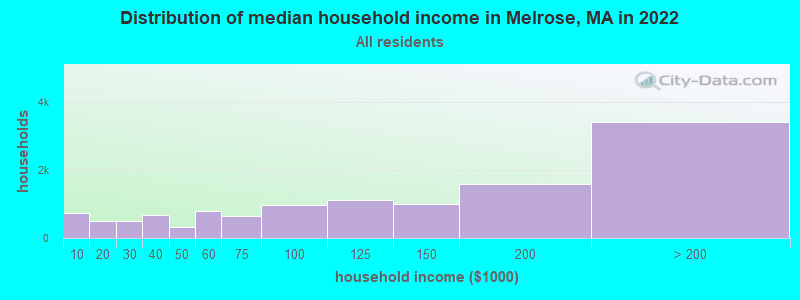
Melrose, MA household income distribution

- 734Less than $10,000
- 503$10,000 to $19,999
- 495$20,000 to $29,999
- 669$30,000 to $39,999
- 316$40,000 to $49,999
- 793$50,000 to $59,999
- 649$60,000 to $74,999
- 970$75,000 to $99,999
- 1,121$100,000 to $124,999
- 1,002$125,000 to $149,999
- 1,581$150,000 to $199,999
- 3,411$200,000 or more
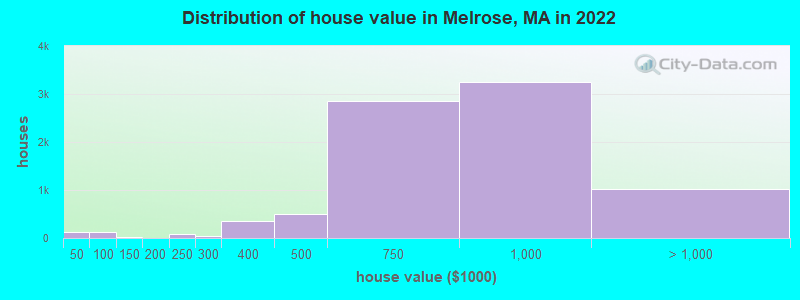
Home value of owner - occupied houses in 2022 in Melrose, MA
-
- 98Less than $10,000
- 18$10,000 to $14,999
- 11$30,000 to $34,999
- 90$60,000 to $69,999
- 31$70,000 to $79,999
- 26$100,000 to $124,999
- 81$200,000 to $249,999
- 38$250,000 to $299,999
- 360$300,000 to $399,999
- 489$400,000 to $499,999
- 2,859$500,000 to $749,999
- 3,255$750,000 to $999,999
- 737$1,000,000 to $1,499,999
- 109$1,500,000 to $1,999,999
- 180$2,000,000 or more
Rent paid by renters in 2022 in Melrose, MA
-
- 235$100 to $149
- 87$200 to $249
- 33$250 to $299
- 48$300 to $349
- 212$350 to $399
- 74$400 to $449
- 76$450 to $499
- 56$500 to $549
- 10$550 to $599
- 59$600 to $649
- 40$650 to $699
- 60$900 to $999
- 92$1,000 to $1,249
- 457$1,250 to $1,499
- 1,539$1,500 to $1,999
- 547$2,000 to $2,499
- 326$2,500 to $2,999
- 245$3,000 to $3,499
- 75$3,500 or more
- 73No cash rent


Percentage of workers working in this county: 61.6%
Number of people working at home: 4,209 (26.1% of all workers)
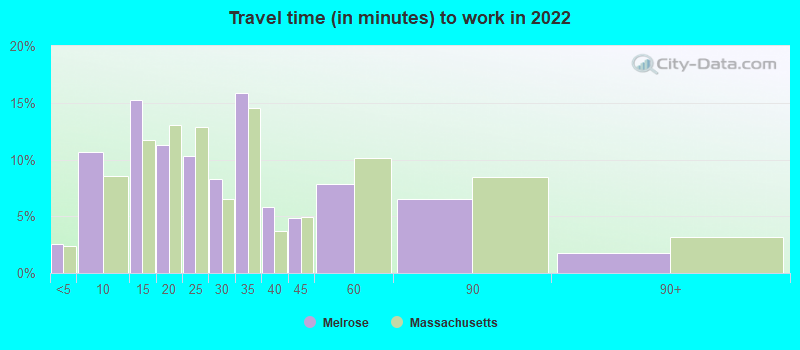
Travel time to work (commute)
- Less than 5 minutes: 157
- 5 to 9 minutes: 693
- 10 to 14 minutes: 664
- 15 to 19 minutes: 698
- 20 to 24 minutes: 1,522
- 25 to 29 minutes: 956
- 30 to 34 minutes: 2,078
- 35 to 39 minutes: 542
- 40 to 44 minutes: 683
- 45 to 59 minutes: 1,919
- 60 to 89 minutes: 1,424
- 90 or more minutes: 378
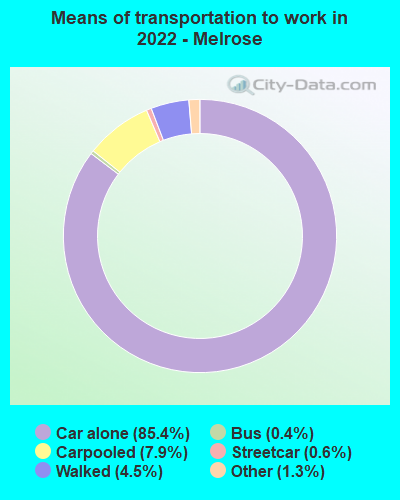
Means of transportation to work:
- Drove a car alone: 5,121 (52.7%)
- Carpooled: 495 (5.1%)
- Bus: 20 (0.2%)
- Subway or elevated rail: 34 (0.3%)
- Taxi: 99 (1.0%)
- Walked: 278 (2.9%)
- Worked at home: 4,209 (43.3%)

- Unemployment by race in 2022
- Unemployment rate for White non-Hispanic residents
- 2.1%Males
- 2.6%Females
- Unemployment rate for Black residents
- 2.8%Males
- Unemployment rate for Asian residents
- 6.1%Males
- 1.1%Females
- Unemployment rate for other race residents
- 15.0%Males
- Unemployment rate for two or more race residents
- 2.3%Males
- Unemployment rate for Hispanic or Latino residents
- 7.5%Males

- Year of entry for the foreign-born population in Melrose, Massachusetts
- 1,7442010 or later
- 1,1232000 to 2009
- 8351990 to 1999
- 2721980 to 1989
- 1711970 to 1979
- 628Before 1970

First ancestries reported:
- Irish: 2,859 (22.8%)
- Italian: 1,277 (10.2%)
- Moroccan: 983 (7.8%)
- American: 570 (4.5%)
- English: 494 (3.9%)
- Polish: 274 (2.2%)
- European: 272 (2.2%)
- French Canadian: 251 (2.0%)
- German: 181 (1.4%)
- Brazilian: 115 (0.9%)
- Scottish: 111 (0.9%)
- Greek: 100 (0.8%)
- Haitian: 96 (0.8%)
- Eastern European: 86 (0.7%)
- Albanian: 77 (0.6%)
- Norwegian: 74 (0.6%)
- Russian: 74 (0.6%)
- Scotch-Irish: 54 (0.4%)
- Canadian: 53 (0.4%)
- Armenian: 52 (0.4%)
- Dutch: 49 (0.4%)
- Ghanaian: 47 (0.4%)
- Ukrainian: 47 (0.4%)
- French: 43 (0.3%)
- Iranian: 34 (0.3%)
- Romanian: 32 (0.3%)
- Scandinavian: 31 (0.2%)
- Cape Verdean: 21 (0.2%)
- South African: 19 (0.2%)
- Hungarian: 17 (0.1%)
- Lithuanian: 15 (0.1%)
- Slovak: 14 (0.1%)
- Kenyan: 12 (0.10%)
- Yugoslavian: 11 (0.09%)
- Pennsylvania German: 10 (0.08%)
- Welsh: 8 (0.06%)
- Jordanian: 5 (0.04%)
- British: 4 (0.03%)
- Portuguese: 3 (0.02%)
Most common places of birth for foreign-born residents (%):
| Melrose: | 20.4% (958) |
| Massachusetts: | 8.4% (103,233) |
| Melrose: | 14.2% (670) |
| Massachusetts: | 0.7% (8,562) |
| Melrose: | 8.2% (385) |
| Massachusetts: | 7.6% (92,959) |
| Melrose: | 3.6% (170) |
| Massachusetts: | 2.3% (27,810) |
| Melrose: | 3.4% (160) |
| Massachusetts: | 0.6% (6,789) |
| Melrose: | 3.1% (146) |
| Massachusetts: | 4.9% (60,432) |
| Melrose: | 2.8% (130) |
| Massachusetts: | 1.5% (18,278) |
| Melrose: | 2.7% (127) |
| Massachusetts: | 2.7% (32,733) |
| Melrose: | 2.6% (121) |
| Massachusetts: | 0.2% (2,737) |
| Melrose: | 2.6% (120) |
| Massachusetts: | 8.3% (101,767) |
| Melrose: | 2.2% (103) |
| Massachusetts: | 1.1% (13,446) |
| Melrose: | 2.0% (94) |
| Massachusetts: | 0.1% (1,702) |
| Melrose: | 1.8% (87) |
| Massachusetts: | 3.0% (37,197) |
| Melrose: | 1.8% (84) |
| Massachusetts: | 2.3% (28,158) |
| Melrose: | 1.8% (83) |
| Massachusetts: | 3.7% (45,667) |
| Melrose: | 1.6% (77) |
| Massachusetts: | 1.2% (14,305) |
| Melrose: | 1.6% (75) |
| Massachusetts: | 0.6% (7,301) |
| Melrose: | 1.5% (72) |
| Massachusetts: | 1.0% (12,529) |
Place of birth for U.S.-born residents:
- This state: 17,802
- Other state: 5,835
- Northeast: 3,642
- Midwest: 862
- South: 912
- West: 373
93.4% of Melrose residents lived in the same house 1 years ago.
Out of people who lived in different houses, 32.1% lived in this county.
Out of people who lived in different counties, 73.7% lived in Massachusetts.
| Melrose: | 93.4% |
| State average: | 87.7% |
Education attainment for males 25 years and older:
- No schooling: 165
- Nursery to 4th grade: 6
- 5th and 6th grade: 21
- 7th and 8th grade: 37
- 9th grade: 52
- 10th grade: 57
- 11th grade: 18
- 12th grade, no diploma: 59
- High school graduate (or equivalency): 2,053
- Less than 1 year of college: 260
- Some college more than 1 year, no degree: 785
- Associate degree: 540
- Bachelor's degree: 3,542
- Master's degree: 2,015
- Professional school degree: 290
- Doctorate degree: 685

Education attainment for females 25 years and older:
- No schooling: 175
- Nursery to 4th grade: 31
- 5th and 6th grade: 58
- 7th and 8th grade: 73
- 9th grade: 42
- 10th grade: 117
- 11th grade: 23
- 12th grade, no diploma: 226
- High school graduate (or equivalency): 1,681
- Less than 1 year of college: 214
- Some college more than 1 year, no degree: 718
- Associate degree: 921
- Bachelor's degree: 3,786
- Master's degree: 2,439
- Professional school degree: 256
- Doctorate degree: 520


Housing units in structures:
- One, detached: 7,079
- One, attached: 472
- Two: 1,111
- 3 or 4: 359
- 5 to 9: 348
- 10 to 19: 832
- 20 to 49: 839
- 50 or more: 1,345
- Mobile homes: 143
- Boats, RVs, vans, etc.: 15
Housing units lacking complete kitchen facilities in 2022: 1.9%
House/condo owner moved in on average 16 years ago
Renter moved in on average 5 years ago

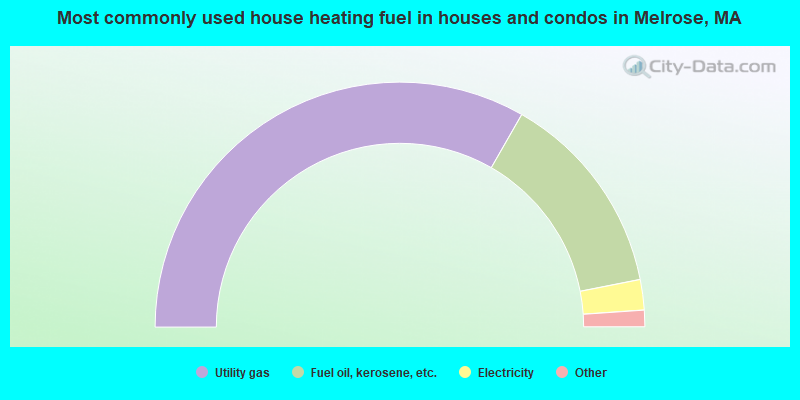
- 66.5%Utility gas
- 27.2%Fuel oil, kerosene, etc.
- 4.0%Electricity
- 1.7%Bottled, tank, or LP gas
- 0.5%Other fuel
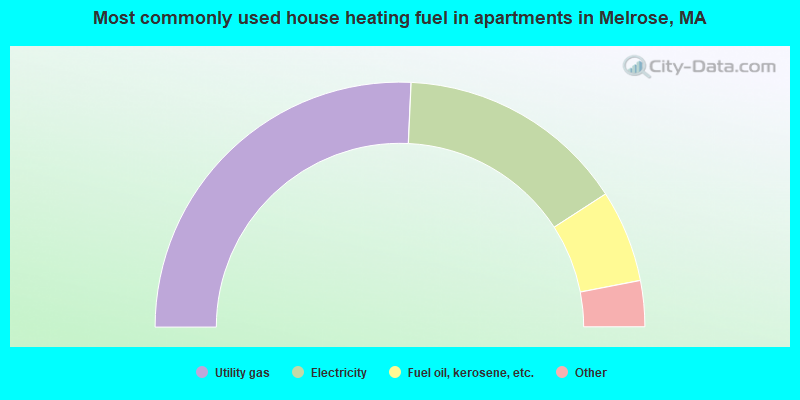
- 51.5%Utility gas
- 30.3%Electricity
- 12.2%Fuel oil, kerosene, etc.
- 2.1%Other fuel
- 2.1%Bottled, tank, or LP gas
- 1.8%No fuel used
Private vs. public school enrollment:
| Here: | 3.2% |
| Massachusetts: | 10.3% |
| Here: | 22.5% |
| Massachusetts: | 12.3% |
| Here: | 43.8% |
| Massachusetts: | 51.2% |


