Redland, OR (Oregon) Houses and Residents
| Redland: | $775,474 |
| Oregon: | $475,600 |
Total population: 6,564 (Urban population: 367, Rural population: 5,567 (367 farm, 5,200 nonfarm))
Houses: 2,178 (2,105 occupied: 1,881 owner occupied, 224 renter occupied)
| % of renters here: | 11% |
| State: | 37% |
Housing density: 58 houses/condos per square mile
Median price asked for vacant for-sale houses and condos in 2022 in this county: $788,071.
Median contract rent in 2022: $1,605 (lower quartile is $1,183, upper quartile is over $2,000)
Median rent asked for vacant for-rent units in 2022: $2,550
Median gross rent in Redland, OR in 2022: $1,981
Housing units in Redland with a mortgage: 1,020 (139 second mortgage, 140 home equity loan, 16 both second mortgage and home equity loan)
Houses without a mortgage: 321
Compare current foreclosures near Redland, OR:
| Photo | Address | Area | Beds / Baths | Price | Details |
|---|---|---|---|---|---|

|
#1
SW 1st Ave Apt 2125
Portland, OR 97201
|
1,950 sq. feet
|
2 baths 3 beds |
$695,000
|
show details |

|
#2
SE 116th Ave
Portland, OR 97266
|
1,678 sq. feet
|
1 baths 4 beds |
$485,000
|
show details |

|
#3
SE Renada St
Portland, OR 97267
|
2,439 sq. feet
|
2 baths 3 beds |
$449,500
|
show details |

|
#4
SE Nicholas St
Boring, OR 97009
|
1,686 sq. feet
|
3 baths 3 beds |
show details | |

|
#5
NE Morris Ct
Portland, OR 97230
|
2,162 sq. feet
|
2 baths 7 beds |
show details | |

|
#6
SE Tibbetts St
Portland, OR 97202
|
1,740 sq. feet
|
3 baths 2 beds |
show details | |

|
#7
Waluga Dr
Lake Oswego, OR 97035
|
4,413 sq. feet
|
4 baths 4 beds |
show details | |

|
#8
NE 162nd Ave
Portland, OR 97230
|
1,073 sq. feet
|
2 baths 3 beds |
show details | |

|
#9
SW Myers Dr
Gresham, OR 97080
|
2,324 sq. feet
|
3 baths 3 beds |
show details | |

|
#10
SE 118th Pl
Portland, OR 97266
|
1,966 sq. feet
|
2 baths 4 beds |
show details |
| Photo | Address | Area | Beds / Baths | Price | Details |
|---|---|---|---|---|---|

|
#11
NE Rose Pkwy
Portland, OR 97230
|
1,638 sq. feet
|
2 baths 4 beds |
show details | |

|
#12
SW Eastwood Ave
Gresham, OR 97080
|
1,370 sq. feet
|
2 baths 3 beds |
show details | |

|
#13
NE Brazee St
Portland, OR 97230
|
1,260 sq. feet
|
2 baths 2 beds |
show details | |

|
#14
SE Chatfield Ct
Happy Valley, OR 97086
|
3,355 sq. feet
|
4 baths 3 beds |
show details | |

|
#15
Touchstone Apt 100
Lake Oswego, OR 97035
|
984 sq. feet
|
2 baths 2 beds |
show details | |

|
#16
SE 136th Ave
Portland, OR 97236
|
1,318 sq. feet
|
3 baths 3 beds |
show details | |

|
#17
NE 155th Ave
Portland, OR 97230
|
2,280 sq. feet
|
2 baths 4 beds |
show details | |

|
#18
SE 49th Ave
Portland, OR 97215
|
2,605 sq. feet
|
2 baths 6 beds |
show details | |

|
#19
SE Tibbetts St
Portland, OR 97202
|
1,738 sq. feet
|
2 baths 4 beds |
show details | |

|
#20
SW Custer St
Portland, OR 97219
|
1,744 sq. feet
|
3 baths 2 beds |
show details |
| Photo | Address | Area | Beds / Baths | Price | Details |
|---|---|---|---|---|---|

|
#21
SE 83rd Ave
Portland, OR 97216
|
1,510 sq. feet
|
1 baths 4 beds |
show details | |

|
#22
Balken Ave
Sandy, OR 97055
|
- sq. feet
|
3 baths 3 beds |
show details | |

|
#23
SE 73rd Ave
Portland, OR 97222
|
- sq. feet
|
1 baths 2 beds |
show details | |

|
#24
SE Tibbetts St
Portland, OR 97202
|
1,326 sq. feet
|
1 baths 3 beds |
show details | |

|
#25
SE Overland St
Portland, OR 97222
|
750 sq. feet
|
1 baths 2 beds |
show details | |

|
#26
SE 51st Ave
Portland, OR 97215
|
2,128 sq. feet
|
3 baths 2 beds |
show details | |

|
#27
NE 118th Ave
Portland, OR 97220
|
3,598 sq. feet
|
3 baths 5 beds |
show details | |

|
#28
Canal Cir
Lake Oswego, OR 97035
|
1,774 sq. feet
|
3 baths 3 beds |
show details | |

|
#29
Warwick St
West Linn, OR 97068
|
1,104 sq. feet
|
2 baths 3 beds |
show details | |

|
#30
NE 86th Ave
Portland, OR 97220
|
1,888 sq. feet
|
2 baths 4 beds |
show details |
| Photo | Address | Area | Beds / Baths | Price | Details |
|---|---|---|---|---|---|

|
#31
SE 128th Ave
Portland, OR 97236
|
1,380 sq. feet
|
2 baths 3 beds |
show details | |

|
#32
NE Larkspur Ln
Fairview, OR 97024
|
1,941 sq. feet
|
2 baths 3 beds |
show details | |

|
#33
Greenridge Ct
Lake Oswego, OR 97035
|
1,314 sq. feet
|
2 baths 2 beds |
show details | |

|
#34
SE Anderson Rd
Gresham, OR 97080
|
1,309 sq. feet
|
2 baths 3 beds |
show details | |

|
#35
S Linda Ln
Canby, OR 97013
|
1,848 sq. feet
|
2 baths 3 beds |
show details | |

|
#36
SE Sun Crest Dr
Happy Valley, OR 97086
|
2,638 sq. feet
|
3 baths 3 beds |
show details | |

|
#37
SW 14th Ave
Portland, OR 97219
|
2,100 sq. feet
|
2 baths 4 beds |
show details | |

|
#38
NE 130th Ave
Portland, OR 97230
|
4,565 sq. feet
|
4 baths 7 beds |
show details | |

|
#39
SE Flavel Dr
Portland, OR 97236
|
2,218 sq. feet
|
2 baths 3 beds |
show details | |

|
#40
SW Gentle Woods Dr
Portland, OR 97224
|
2,411 sq. feet
|
3 baths 4 beds |
show details |
| Photo | Address | Area | Beds / Baths | Price | Details |
|---|---|---|---|---|---|

|
#41
NE Westview Ln
Estacada, OR 97023
|
2,900 sq. feet
|
3 baths 4 beds |
show details | |

|
#42
SW Water Ave
Portland, OR 97201
|
55,483 sq. feet
|
1 baths 3 beds |
show details | |

|
#43
Charman St
Oregon City, OR 97045
|
2,394 sq. feet
|
3 baths 3 beds |
show details | |

|
#44
SE Jennings Crest Ln
Portland, OR 97267
|
2,482 sq. feet
|
2 baths 3 beds |
show details | |

|
#45
Park Dr
Oregon City, OR 97045
|
1,484 sq. feet
|
2 baths 3 beds |
show details | |

|
#46
SW Mohawk St
Tualatin, OR 97062
|
852 sq. feet
|
1 baths 2 beds |
show details | |

|
#47
Kae Ct
Molalla, OR 97038
|
1,368 sq. feet
|
1 baths 3 beds |
show details | |

|
#48
NE 75th Ave
Portland, OR 97213
|
960 sq. feet
|
1 baths 2 beds |
show details | |

|
#49
SW Cedar Rd
Estacada, OR 97023
|
1,620 sq. feet
|
1 baths 3 beds |
show details | |

|
Check over 1 million property listings on Foreclosure.com!
|
browse all offers | |||

Household type by relationship:
Households: 373,239- In family households: 315,893 (73,770 male householders, 27,096 female householders)
79,856 spouses, 107,451 children (98,993 natural, 3,285 adopted, 5,173 stepchildren), 6,228 grandchildren, 2,852 brothers or sisters, 2,991 parents, foster children, 3,486 other relatives, 9,508 non-relatives
- In nonfamily households: 57,346 (20,413 male householders (14,825 living alone)), 24,511 female householders (20,254 living alone)), 12,422 nonrelatives
- In group quarters: 2,753 (1,340 institutionalized population)
65,696 married couples with children.
15,935 single-parent households (4,341 men, 11,594 women).
95.6% of residents of Redland speak English at home.
1.3% of residents speak Spanish at home (59% speak English very well, 41% speak English well).
1.7% of residents speak other Indo-European language at home (100% speak English very well).
1.1% of residents speak Asian or Pacific Island language at home (89% speak English very well, 11% don't speak English at all).
0.3% of residents speak other language at home (53% speak English very well, 47% speak English well).
Foreign born population: 222 (3.0%)
(83.8% of them are naturalized citizens)
| Here: | 6.9 |
| State: | 6.2 |
| Here: | 6.1 |
| State: | 4.0 |

- Bedrooms in owner-occupied houses and condos in Redland, Oregon
- 10no bedroom
- 311 bedroom
- 2452 bedrooms
- 1,0503 bedrooms
- 4414 bedrooms
- 1045+ bedrooms

- Bedrooms in renter-occupied apartments in Redland, Oregon
- 0no bedroom
- 01 bedroom
- 682 bedrooms
- 1383 bedrooms
- 184 bedrooms
- 05+ bedrooms

- Cars and other vehicles available in Redland in owner-occupied houses/condos
- 26no vehicle
- 2811 vehicle
- 8072 vehicles
- 4833 vehicles
- 1494 vehicles
- 1355+ vehicles

- Cars and other vehicles available in Redland in renter-occupied apartments
- 9no vehicle
- 711 vehicle
- 1022 vehicles
- 423 vehicles
- 04 vehicles
- 05+ vehicles

- Rooms in owner-occupied houses in Redland, Oregon
- 101 room
- 162 rooms
- 333 rooms
- 744 rooms
- 2245 rooms
- 4326 rooms
- 4407 rooms
- 2978 rooms
- 3559+ rooms

- Rooms in renter-occupied apartments in Redland, Oregon
- 01 room
- 02 rooms
- 03 rooms
- 304 rooms
- 415 rooms
- 826 rooms
- 227 rooms
- 378 rooms
- 129+ rooms


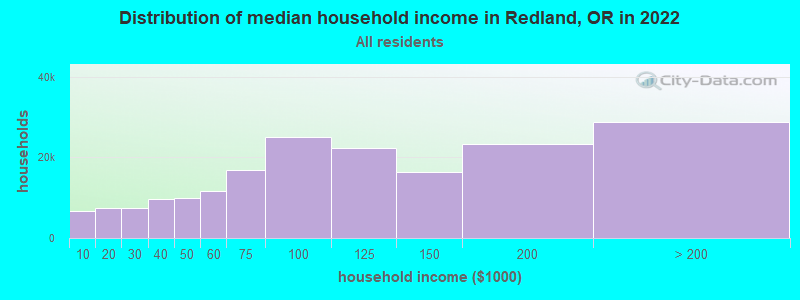
Redland, OR household income distribution

- 6,635Less than $10,000
- 7,464$10,000 to $19,999
- 7,468$20,000 to $29,999
- 9,614$30,000 to $39,999
- 9,942$40,000 to $49,999
- 11,761$50,000 to $59,999
- 16,799$60,000 to $74,999
- 24,997$75,000 to $99,999
- 22,327$100,000 to $124,999
- 16,376$125,000 to $149,999
- 23,291$150,000 to $199,999
- 28,783$200,000 or more
Percentage of workers working in this county: 75.6%
Number of people working at home: 784 (22.0% of all workers)
Travel time to work (commute)
- Less than 5 minutes: 17
- 5 to 9 minutes: 37
- 10 to 14 minutes: 157
- 15 to 19 minutes: 332
- 20 to 24 minutes: 487
- 25 to 29 minutes: 184
- 30 to 34 minutes: 428
- 35 to 39 minutes: 179
- 40 to 44 minutes: 184
- 45 to 59 minutes: 443
- 60 to 89 minutes: 171
- 90 or more minutes: 57
Means of transportation to work:
- Drove a car alone: 2,272 (80.7%)
- Carpooled: 298 (10.6%)
- Bus or trolley bus: 39 (1.4%)
- Bicycle: 20 (0.7%)
- Walked: 33 (1.2%)
- Other means: 14 (0.5%)
- Worked at home: 141 (5.0%)

- Year of entry for the foreign-born population in Redland, Oregon
- 191995 to March 2000
- 61990 to 1994
- 291985 to 1989
- 71980 to 1984
- 191975 to 1979
- 91970 to 1974
- 221965 to 1969
- 49Before 1965
Most common places of birth for foreign-born residents (%):
| Redland: | 20.6% (33) |
| Oregon: | 3.0% (8,568) |
| Redland: | 12.5% (20) |
| Oregon: | 2.6% (7,474) |
| Redland: | 10.6% (17) |
| Oregon: | 5.9% (17,137) |
| Redland: | 10.0% (16) |
| Oregon: | 0.2% (642) |
| Redland: | 7.5% (12) |
| Oregon: | 1.5% (4,202) |
| Redland: | 6.9% (11) |
| Oregon: | 0.2% (595) |
| Redland: | 6.9% (11) |
| Oregon: | 39.0% (113,083) |
| Redland: | 5.6% (9) |
| Oregon: | 0.4% (1,065) |
| Redland: | 5.0% (8) |
| Oregon: | 0.8% (2,299) |
| Redland: | 3.8% (6) |
| Oregon: | 0.6% (1,826) |
| Redland: | 3.8% (6) |
| Oregon: | 3.6% (10,488) |
| Redland: | 3.8% (6) |
| Oregon: | 0.7% (2,026) |
| Redland: | 3.1% (5) |
| Oregon: | 0.5% (1,526) |
Place of birth for U.S.-born residents:
- This state: 3,479
- Other state: 2,277
- Northeast: 232
- Midwest: 645
- South: 204
- West: 1,196
69% of Redland residents lived in the same house 5 years ago.
Out of people who lived in different houses, 56% lived in this county.
Out of people who lived in different counties, 71% lived in Oregon.
Education attainment for males 25 years and older:
- No schooling: 0
- Nursery to 4th grade: 0
- 5th and 6th grade: 8
- 7th and 8th grade: 26
- 9th grade: 17
- 10th grade: 23
- 11th grade: 18
- 12th grade, no diploma: 79
- High school graduate (or equivalency): 489
- Less than 1 year of college: 222
- Some college more than 1 year, no degree: 446
- Associate degree: 154
- Bachelor's degree: 359
- Master's degree: 109
- Professional school degree: 14
- Doctorate degree: 25

Education attainment for females 25 years and older:
- No schooling: 0
- Nursery to 4th grade: 0
- 5th and 6th grade: 0
- 7th and 8th grade: 25
- 9th grade: 15
- 10th grade: 36
- 11th grade: 59
- 12th grade, no diploma: 31
- High school graduate (or equivalency): 586
- Less than 1 year of college: 354
- Some college more than 1 year, no degree: 391
- Associate degree: 180
- Bachelor's degree: 263
- Master's degree: 87
- Professional school degree: 22
- Doctorate degree: 8


Housing units in structures:
- One, detached: 1,862
- One, attached: 9
- Two: 5
- Mobile homes: 302
Median worth of mobile homes: $429,693

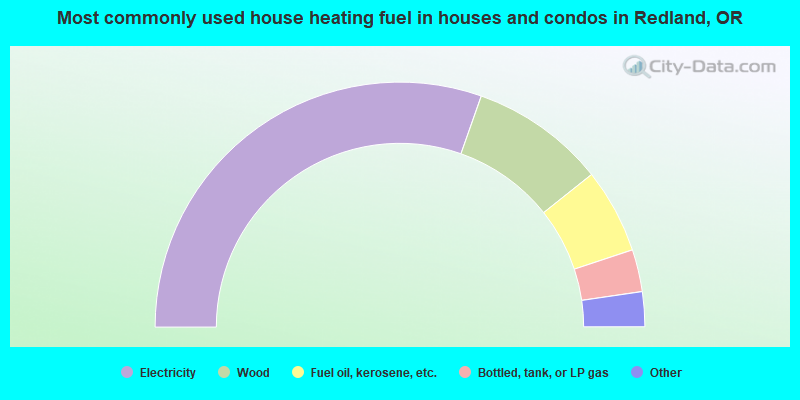
- 60.8%Electricity
- 17.8%Wood
- 11.2%Fuel oil, kerosene, etc.
- 5.6%Bottled, tank, or LP gas
- 1.6%Utility gas
- 1.6%Other fuel
- 0.9%Solar energy
- 0.5%No fuel used
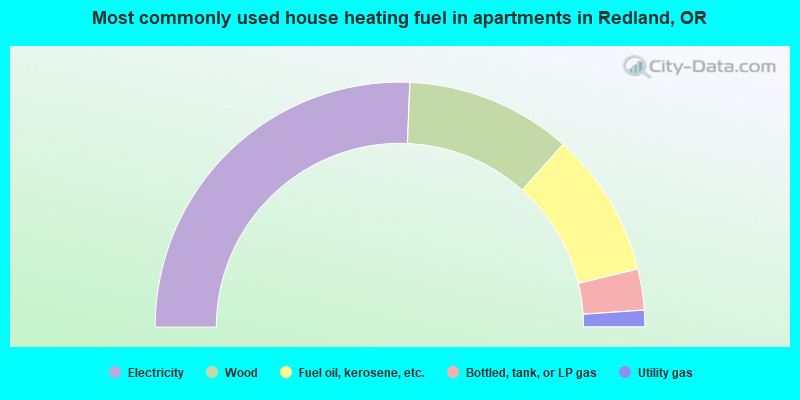
- 51.3%Electricity
- 21.9%Wood
- 19.2%Fuel oil, kerosene, etc.
- 5.4%Bottled, tank, or LP gas
- 2.2%Utility gas
Private vs. public school enrollment:
| Here: | 20.3% |
| Oregon: | 9.7% |
| Here: | 15.8% |
| Oregon: | 7.6% |
| Here: | 21.4% |
| Oregon: | 16.1% |


