South Hadley, MA (Massachusetts) Houses and Residents
| South Hadley: | $349,029 |
| Massachusetts: | $534,700 |
Total population: 17,514 (Urban population: 16,210, Rural population: 986 (6 farm, 980 nonfarm))
Houses: 6,784 (6,586 occupied: 4,874 owner occupied, 1,712 renter occupied)
| % of renters here: | 26% |
| State: | 38% |
Housing density: 383 houses/condos per square mile
Median price asked for vacant for-sale houses and condos in 2022 in this county: $222,792.
Median contract rent in 2022: $1,172 (lower quartile is $904, upper quartile is $1,627)
Median rent asked for vacant for-rent units in 2022: $2,377
Median gross rent in South Hadley, MA in 2022: $1,323
Housing units in South Hadley with a mortgage: 2,618 (108 second mortgage, 486 home equity loan, 10 both second mortgage and home equity loan)
Houses without a mortgage: 1,466
Compare current foreclosures near South Hadley, MA:
| Photo | Address | Area | Beds / Baths | Price | Details |
|---|---|---|---|---|---|

|
#1
Ridge Rd
South Hadley, MA 01075
|
1,056 sq. feet
|
2 baths 3 beds |
show details | |

|
#2
Alvord Pl
South Hadley, MA 01075
|
1,344 sq. feet
|
2 baths 2 beds |
show details | |

|
#3
Pine St
South Hadley, MA 01075
|
2,357 sq. feet
|
2 baths 4 beds |
show details | |

|
#4
W Parkview Dr
South Hadley, MA 01075
|
1,608 sq. feet
|
2 baths 3 beds |
show details | |

|
#5
Hillcrest Ave
South Hadley, MA 01075
|
1,646 sq. feet
|
1 baths 3 beds |
show details | |

|
#6
Alvord Pl
South Hadley, MA 01075
|
1,358 sq. feet
|
3 baths 3 beds |
show details | |

|
#7
Pershing Ave
South Hadley, MA 01075
|
1,228 sq. feet
|
1 baths 3 beds |
show details | |

|
#8
Dover Rd
South Hadley, MA 01075
|
1,492 sq. feet
|
1 baths 3 beds |
show details | |

|
#9
Lyman St
South Hadley, MA 01075
|
1,152 sq. feet
|
2 baths 2 beds |
show details | |

|
#10
Greenacre Rd
South Hadley, MA 01075
|
1,376 sq. feet
|
2 baths 3 beds |
show details |
| Photo | Address | Area | Beds / Baths | Price | Details |
|---|---|---|---|---|---|

|
#11
Mountain Ave
South Hadley, MA 01075
|
1,884 sq. feet
|
2 baths 3 beds |
show details | |

|
#12
Alvord Pl # 505
South Hadley, MA 01075
|
1,358 sq. feet
|
2 baths 2 beds |
show details | |

|
#13
Alvord 505
South Hadley, MA 01075
|
1,358 sq. feet
|
2 baths 2 beds |
show details | |

|
#14
Alvord Pl
South Hadley, MA 01075
|
- sq. feet
|
1 baths 2 beds |
show details | |

|
#15
Riverboat Village Rd
South Hadley, MA 01075
|
- sq. feet
|
- baths - beds |
show details | |

|
#16
Granby Rd
South Hadley, MA 01075
|
- sq. feet
|
- baths - beds |
show details | |

|
#17
Main St # 2f
South Hadley, MA 01075
|
- sq. feet
|
- baths - beds |
show details | |

|
#18
Rita Cir
South Hadley, MA 01075
|
- sq. feet
|
- baths - beds |
show details | |

|
#19
Walnut Street
Springfield, MA 01105
|
2,850 sq. feet
|
2 baths 6 beds |
$99,900
|
show details |

|
#20
Cold Spring Rd
Southampton, MA 01073
|
2,736 sq. feet
|
1 baths 3 beds |
$284,900
|
show details |
| Photo | Address | Area | Beds / Baths | Price | Details |
|---|---|---|---|---|---|

|
#21
Jondot Dr
Enfield, CT 06082
|
1,385 sq. feet
|
1 baths 3 beds |
$299,900
|
show details |

|
#22
Sanford Ave
Enfield, CT 06082
|
21 sq. feet
|
1 baths 4 beds |
$225,000
|
show details |

|
#23
W Franklin St
Holyoke, MA 01040
|
1,558 sq. feet
|
1 baths 2 beds |
$234,900
|
show details |

|
#24
Newman St
Springfield, MA 01105
|
1,676 sq. feet
|
2 baths 3 beds |
$45,900
|
show details |

|
#25
Main St # 3144
Palmer, MA 01069
|
875 sq. feet
|
1 baths 2 beds |
show details | |

|
#26
Connecticut Ave
Springfield, MA 01104
|
1,561 sq. feet
|
1 baths 3 beds |
show details | |

|
#27
Tiffany St
Springfield, MA 01108
|
1,040 sq. feet
|
1 baths 3 beds |
show details | |

|
#28
Day Ave
Northampton, MA 01060
|
2,406 sq. feet
|
2 baths 4 beds |
show details | |

|
#29
Saint James Blvd
Springfield, MA 01104
|
1,120 sq. feet
|
1 baths 2 beds |
show details | |

|
#30
Belchertown St
Three Rivers, MA 01080
|
1,304 sq. feet
|
1 baths 3 beds |
show details |
| Photo | Address | Area | Beds / Baths | Price | Details |
|---|---|---|---|---|---|

|
#31
Champlain Ave
Indian Orchard, MA 01151
|
1,484 sq. feet
|
2 baths 3 beds |
show details | |

|
#32
Marmon St
Springfield, MA 01129
|
980 sq. feet
|
1 baths 2 beds |
show details | |

|
#33
Washington St
Westfield, MA 01085
|
1,300 sq. feet
|
2 baths 3 beds |
show details | |

|
#34
Prospect Street Ext
Westfield, MA 01085
|
1,813 sq. feet
|
2 baths 4 beds |
show details | |

|
#35
Champlain Ave
Indian Orchard, MA 01151
|
630 sq. feet
|
1 baths 1 beds |
show details | |

|
#36
Thompson St
East Longmeadow, MA 01028
|
1,484 sq. feet
|
2 baths 4 beds |
show details | |

|
#37
Commonwealth Ave
Springfield, MA 01108
|
1,008 sq. feet
|
1 baths 3 beds |
show details | |

|
#38
Kingsley St
Springfield, MA 01104
|
1,586 sq. feet
|
2 baths 3 beds |
show details | |

|
#39
Nassau Dr
Springfield, MA 01129
|
796 sq. feet
|
1 baths 1 beds |
show details | |

|
#40
Montgomery St
Westfield, MA 01085
|
1,714 sq. feet
|
2 baths 4 beds |
show details |
| Photo | Address | Area | Beds / Baths | Price | Details |
|---|---|---|---|---|---|

|
#41
Anthony St
Agawam, MA 01001
|
1,448 sq. feet
|
2 baths 3 beds |
show details | |

|
#42
Notre Dame St
Springfield, MA 01104
|
1,310 sq. feet
|
2 baths 4 beds |
show details | |

|
#43
Raymond Cir
Agawam, MA 01001
|
1,048 sq. feet
|
1 baths 3 beds |
show details | |

|
#44
Ontario St
Springfield, MA 01104
|
1,405 sq. feet
|
1 baths 3 beds |
show details | |

|
#45
Voyer Ave
East Longmeadow, MA 01028
|
1,320 sq. feet
|
1 baths 3 beds |
show details | |

|
#46
School St
Chicopee, MA 01013
|
2,600 sq. feet
|
2 baths 4 beds |
show details | |

|
#47
Hancock St
Westfield, MA 01085
|
1,448 sq. feet
|
1 baths 2 beds |
show details | |

|
#48
Woodland Dr
Hampden, MA 01036
|
972 sq. feet
|
1 baths 3 beds |
show details | |

|
#49
Butler Ave
Chicopee, MA 01020
|
1,445 sq. feet
|
1 baths 3 beds |
show details | |

|
Check over 1 million property listings on Foreclosure.com!
|
browse all offers | |||

 | How Much Massachusetts Households Make Per Year: Census Data (37 replies) |
| 2021 Real Estate Observations (1729 replies) |
| Amherst? Older parents with kids looking to retire in a college town (25 replies) |
| Condos, Amherst/surrounding towns (2 replies) |
| Job transfer to Hadley Ma via Florida ISO 1,2 bedroom home (7 replies) |
| Oklahoma to (likely Western) Massachusetts - Beginning Research (274 replies) |

Household type by relationship:
Households: 137,248- In family households: 102,805 (23,141 male householders, 11,339 female householders)
26,289 spouses, 34,225 children (31,880 natural, 1,196 adopted, 1,149 stepchildren), 1,465 grandchildren, 834 brothers or sisters, 944 parents, foster children, 834 other relatives, 3,097 non-relatives
- In nonfamily households: 34,443 (10,544 male householders (7,207 living alone)), 13,678 female householders (10,221 living alone)), 10,221 nonrelatives
- In group quarters: 20,832 (1,268 institutionalized population)
21,116 married couples with children.
6,740 single-parent households (1,315 men, 5,425 women).
88.0% of residents of South Hadley speak English at home.
2.8% of residents speak Spanish at home (73% speak English very well, 13% speak English well, 14% speak English not well).
7.4% of residents speak other Indo-European language at home (81% speak English very well, 14% speak English well, 4% speak English not well, 1% don't speak English at all).
1.1% of residents speak Asian or Pacific Island language at home (59% speak English very well, 25% speak English well, 16% speak English not well).
0.6% of residents speak other language at home (100% speak English very well).
Foreign born population: 1,764 (9.6%)
(60.1% of them are naturalized citizens)
| Here: | 6.5 |
| State: | 6.5 |
| Here: | 6.0 |
| State: | 4.0 |

- Bedrooms in owner-occupied houses and condos in South Hadley, Massachusetts
- 0no bedroom
- 1781 bedroom
- 1,2352 bedrooms
- 2,3053 bedrooms
- 9714 bedrooms
- 1855+ bedrooms

- Bedrooms in renter-occupied apartments in South Hadley, Massachusetts
- 59no bedroom
- 5271 bedroom
- 6902 bedrooms
- 3803 bedrooms
- 374 bedrooms
- 195+ bedrooms

- Cars and other vehicles available in South Hadley in owner-occupied houses/condos
- 137no vehicle
- 1,6851 vehicle
- 2,3082 vehicles
- 6033 vehicles
- 1084 vehicles
- 335+ vehicles

- Cars and other vehicles available in South Hadley in renter-occupied apartments
- 253no vehicle
- 9681 vehicle
- 4492 vehicles
- 333 vehicles
- 94 vehicles
- 05+ vehicles

- Rooms in owner-occupied houses in South Hadley, Massachusetts
- 01 room
- 152 rooms
- 1543 rooms
- 5554 rooms
- 9725 rooms
- 1,2226 rooms
- 9667 rooms
- 5288 rooms
- 4629+ rooms

- Rooms in renter-occupied apartments in South Hadley, Massachusetts
- 491 room
- 1712 rooms
- 3023 rooms
- 4894 rooms
- 4145 rooms
- 1786 rooms
- 687 rooms
- 178 rooms
- 249+ rooms


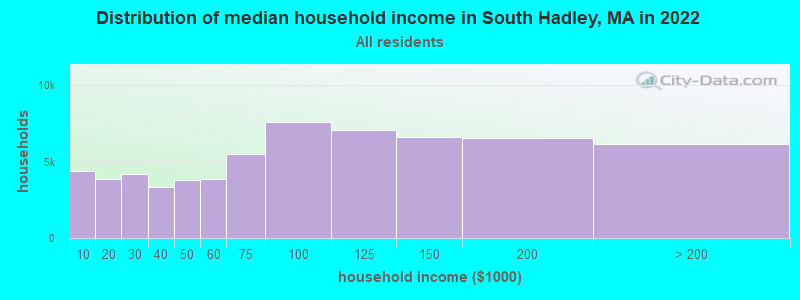
South Hadley, MA household income distribution

- 4,399Less than $10,000
- 3,862$10,000 to $19,999
- 4,171$20,000 to $29,999
- 3,350$30,000 to $39,999
- 3,770$40,000 to $49,999
- 3,887$50,000 to $59,999
- 5,479$60,000 to $74,999
- 7,596$75,000 to $99,999
- 7,081$100,000 to $124,999
- 6,613$125,000 to $149,999
- 6,576$150,000 to $199,999
- 6,177$200,000 or more
Percentage of workers working in this county: 47.3%
Number of people working at home: 1,945 (18.4% of all workers)
Travel time to work (commute)
- Less than 5 minutes: 523
- 5 to 9 minutes: 1,655
- 10 to 14 minutes: 1,497
- 15 to 19 minutes: 1,238
- 20 to 24 minutes: 1,475
- 25 to 29 minutes: 548
- 30 to 34 minutes: 899
- 35 to 39 minutes: 96
- 40 to 44 minutes: 91
- 45 to 59 minutes: 259
- 60 to 89 minutes: 202
- 90 or more minutes: 152
Means of transportation to work:
- Drove a car alone: 6,766 (75.2%)
- Carpooled: 784 (8.7%)
- Bus or trolley bus: 30 (0.3%)
- Railroad: 5 (0.1%)
- Motorcycle: 5 (0.1%)
- Bicycle: 23 (0.3%)
- Walked: 1,003 (11.2%)
- Other means: 19 (0.2%)
- Worked at home: 359 (4.0%)

- Year of entry for the foreign-born population in South Hadley, Massachusetts
- 2971995 to March 2000
- 951990 to 1994
- 1141985 to 1989
- 841980 to 1984
- 721975 to 1979
- 541970 to 1974
- 551965 to 1969
- 399Before 1965

First ancestries reported:
- Irish: 3,390 (16.0%)
- French: 2,685 (12.6%)
- Polish: 2,553 (12.0%)
- English: 2,355 (11.1%)
- Other: 2,164 (10.2%)
- French Canadian: 2,058 (9.7%)
- German: 1,965 (9.2%)
- Italian: 1,164 (5.5%)
- Scottish: 502 (2.4%)
- Scotch-Irish: 330 (1.6%)
- United States: 330 (1.6%)
- Portuguese: 236 (1.1%)
- Greek: 217 (1.0%)
- Swedish: 171 (0.8%)
- Russian: 169 (0.8%)
- Dutch: 151 (0.7%)
- Lithuanian: 120 (0.6%)
- Welsh: 108 (0.5%)
- Czech: 104 (0.5%)
- Ukrainian: 96 (0.5%)
- Norwegian: 73 (0.3%)
- West Indian: 64 (0.3%)
- Arab: 56 (0.3%)
- Subsaharan African: 53 (0.2%)
- Hungarian: 52 (0.2%)
- Danish: 44 (0.2%)
- Swiss: 33 (0.2%)
- Slovak: 9 (0.04%)
Most common places of birth for foreign-born residents (%):
| South Hadley: | 16.3% (191) |
| Massachusetts: | 5.2% (40,247) |
| South Hadley: | 11.5% (135) |
| Massachusetts: | 1.8% (13,543) |
| South Hadley: | 7.4% (87) |
| Massachusetts: | 1.9% (14,883) |
| South Hadley: | 7.4% (87) |
| Massachusetts: | 3.3% (25,403) |
| South Hadley: | 6.0% (70) |
| Massachusetts: | 1.7% (12,975) |
| South Hadley: | 5.7% (67) |
| Massachusetts: | 1.7% (13,456) |
| South Hadley: | 3.9% (46) |
| Massachusetts: | 0.5% (3,660) |
| South Hadley: | 3.2% (37) |
| Massachusetts: | 1.1% (8,682) |
| South Hadley: | 3.0% (35) |
| Massachusetts: | 0.9% (7,258) |
| South Hadley: | 3.0% (35) |
| Massachusetts: | 3.6% (28,086) |
| South Hadley: | 2.3% (27) |
| Massachusetts: | 1.0% (7,414) |
| South Hadley: | 2.2% (26) |
| Massachusetts: | 1.6% (12,350) |
| South Hadley: | 1.7% (20) |
| Massachusetts: | 0.3% (2,242) |
| South Hadley: | 1.7% (20) |
| Massachusetts: | 0.7% (5,693) |
| South Hadley: | 1.6% (19) |
| Massachusetts: | 8.6% (66,627) |
| South Hadley: | 1.5% (18) |
| Massachusetts: | 0.2% (1,243) |
| South Hadley: | 1.5% (18) |
| Massachusetts: | 0.6% (4,578) |
Place of birth for U.S.-born residents:
- This state: 11,475
- Other state: 4,297
- Northeast: 2,530
- Midwest: 525
- South: 681
- West: 561
61% of South Hadley residents lived in the same house 5 years ago.
Out of people who lived in different houses, 38% lived in this county.
Out of people who lived in different counties, 49% lived in Massachusetts.
Education attainment for males 25 years and older:
- No schooling: 13
- Nursery to 4th grade: 0
- 5th and 6th grade: 58
- 7th and 8th grade: 68
- 9th grade: 86
- 10th grade: 55
- 11th grade: 76
- 12th grade, no diploma: 129
- High school graduate (or equivalency): 1,475
- Less than 1 year of college: 412
- Some college more than 1 year, no degree: 649
- Associate degree: 301
- Bachelor's degree: 975
- Master's degree: 383
- Professional school degree: 147
- Doctorate degree: 176

Education attainment for females 25 years and older:
- No schooling: 44
- Nursery to 4th grade: 30
- 5th and 6th grade: 25
- 7th and 8th grade: 148
- 9th grade: 122
- 10th grade: 67
- 11th grade: 112
- 12th grade, no diploma: 162
- High school graduate (or equivalency): 1,648
- Less than 1 year of college: 525
- Some college more than 1 year, no degree: 800
- Associate degree: 571
- Bachelor's degree: 1,209
- Master's degree: 543
- Professional school degree: 121
- Doctorate degree: 167


Housing units in structures:
- One, detached: 4,400
- One, attached: 326
- Two: 666
- 3 or 4: 579
- 5 to 9: 357
- 10 to 19: 191
- 20 to 49: 149
- 50 or more: 100
- Mobile homes: 16
Median worth of mobile homes: $303,669
Housing units lacking complete kitchen facilities: 0.7%

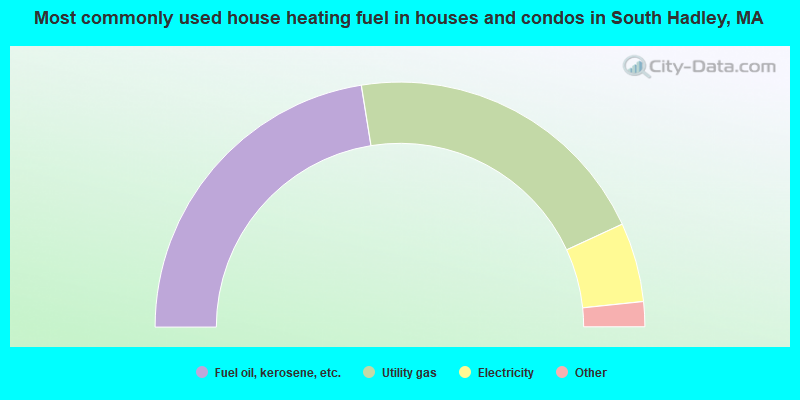
- 45.0%Fuel oil, kerosene, etc.
- 41.3%Utility gas
- 10.5%Electricity
- 1.4%Wood
- 1.0%Bottled, tank, or LP gas
- 0.5%Coal or coke
- 0.2%Other fuel
- 0.2%Solar energy
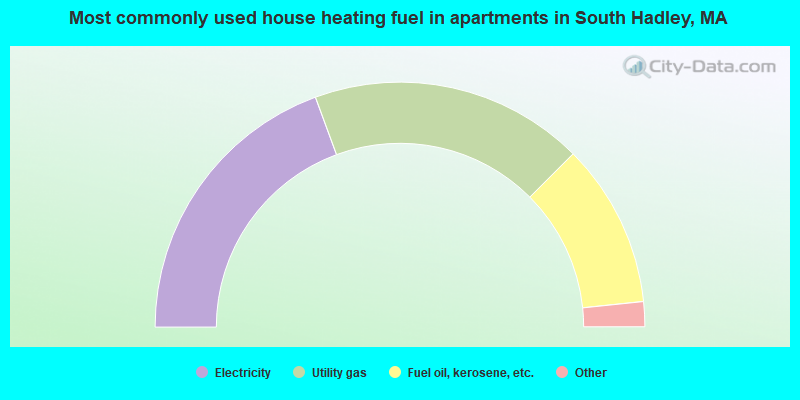
- 38.8%Electricity
- 36.2%Utility gas
- 21.7%Fuel oil, kerosene, etc.
- 2.9%Bottled, tank, or LP gas
- 0.4%Wood
Private vs. public school enrollment:
| Here: | 7.0% |
| Massachusetts: | 10.8% |
| Here: | 7.0% |
| Massachusetts: | 12.2% |
| Here: | 80.5% |
| Massachusetts: | 48.2% |


