Springfield, OR (Oregon) Houses and Residents
| Springfield: | $349,535 |
| Oregon: | $475,600 |
Mean price in 2022:
Detached houses: $375,691
Here: $375,691 State: $562,872 Townhouses or other attached units: $326,012
Here: $326,012 State: $463,029 In 2-unit structures: $398,047
Here: $398,047 State: $505,105 In 3-to-4-unit structures: $221,703
Here: $221,703 State: $419,673 In 5-or-more-unit structures: $320,254
Here: $320,254 State: $420,389 Mobile homes: $92,030
Here: $92,030 State: $214,044 Occupied boats, RVs, vans, etc.: $8,279
Here: $8,279 State: $122,960
Total population: 60,263 (Urban population: 52,668, Rural population: 61 (all nonfarm))
Houses: 26,051 (25,529 occupied: 13,653 owner occupied, 11,653 renter occupied)
| % of renters here: | 46% |
| State: | 37% |
Housing density: 1,809 houses/condos per square mile
Median price asked for vacant for-sale houses and condos in 2022: $244,521.
Median contract rent in 2022: $1,016 (lower quartile is $775, upper quartile is $1,260)
Median rent asked for vacant for-rent units in 2022: $1,585
Median gross rent in Springfield, OR in 2022: $1,158
Housing units in Springfield with a mortgage: 9,427 (1,097 second mortgage, 15 home equity loan, 1,077 both second mortgage and home equity loan)
Houses without a mortgage: 192
Median household income for houses/condos with a mortgage: $83,342
Median household income for apartments without a mortgage: $49,595
Median monthly housing costs: $1,177
Compare current foreclosures in Springfield, OR:
| Photo | Address | Area | Beds / Baths | Price | Details |
|---|---|---|---|---|---|

|
#1
14th St
Springfield, OR 97477
|
1,916 sq. feet
|
3 baths 4 beds |
show details | |

|
#2
Tamarack St
Springfield, OR 97477
|
1,465 sq. feet
|
1 baths 3 beds |
show details | |

|
#3
Dixie Dr
Springfield, OR 97478
|
1,329 sq. feet
|
2 baths 3 beds |
show details | |

|
#4
Osage St
Springfield, OR 97478
|
2,016 sq. feet
|
2 baths 4 beds |
show details | |

|
#5
57th St
Springfield, OR 97478
|
876 sq. feet
|
1 baths 3 beds |
show details | |

|
#6
D St
Springfield, OR 97478
|
960 sq. feet
|
1 baths 3 beds |
show details | |

|
#7
D St
Springfield, OR 97477
|
2,816 sq. feet
|
3 baths 7 beds |
show details | |

|
#8
55th St
Springfield, OR 97478
|
1,092 sq. feet
|
2 baths 3 beds |
show details | |

|
#9
Jules Pl
Springfield, OR 97478
|
1,156 sq. feet
|
2 baths 3 beds |
show details | |

|
#10
Glacier Dr
Springfield, OR 97478
|
1,975 sq. feet
|
2 baths 3 beds |
show details |
| Photo | Address | Area | Beds / Baths | Price | Details |
|---|---|---|---|---|---|

|
#11
S 41st St
Springfield, OR 97478
|
1,695 sq. feet
|
2 baths 3 beds |
show details | |

|
#12
T St
Springfield, OR 97477
|
1,328 sq. feet
|
2 baths 3 beds |
show details | |

|
#13
19th St
Springfield, OR 97477
|
880 sq. feet
|
1 baths 2 beds |
show details | |

|
#14
Winslow Ave
Springfield, OR 97477
|
1,729 sq. feet
|
2 baths 3 beds |
show details | |

|
#15
72nd St
Springfield, OR 97478
|
2,239 sq. feet
|
2 baths 4 beds |
show details | |

|
#16
Camellia St
Springfield, OR 97478
|
1,256 sq. feet
|
2 baths 3 beds |
show details | |

|
#17
C St
Springfield, OR 97478
|
1,350 sq. feet
|
2 baths 3 beds |
show details | |

|
#18
16th St
Springfield, OR 97477
|
1,296 sq. feet
|
1 baths 2 beds |
show details | |

|
#19
37th St
Springfield, OR 97477
|
1,285 sq. feet
|
2 baths 3 beds |
show details | |

|
#20
Stephens Rd
Springfield, OR 97478
|
1,568 sq. feet
|
1 baths 2 beds |
show details |
| Photo | Address | Area | Beds / Baths | Price | Details |
|---|---|---|---|---|---|

|
#21
S Redwood Dr
Springfield, OR 97478
|
2,148 sq. feet
|
2 baths 4 beds |
show details | |

|
#22
B St
Springfield, OR 97478
|
1,218 sq. feet
|
2 baths 3 beds |
show details | |

|
#23
E St
Springfield, OR 97478
|
1,892 sq. feet
|
2 baths 4 beds |
show details | |

|
#24
67th Pl
Springfield, OR 97478
|
1,152 sq. feet
|
1 baths 3 beds |
show details | |

|
#25
E St
Springfield, OR 97477
|
1,163 sq. feet
|
1 baths 3 beds |
show details | |

|
#26
72nd St
Springfield, OR 97478
|
1,496 sq. feet
|
1 baths 3 beds |
show details | |

|
#27
S 70th St
Springfield, OR 97478
|
1,365 sq. feet
|
1 baths 4 beds |
show details | |

|
#28
A St
Springfield, OR 97478
|
1,950 sq. feet
|
2 baths 4 beds |
show details | |

|
#29
Hamilton St
Springfield, OR 97477
|
1,170 sq. feet
|
2 baths 3 beds |
show details | |

|
#30
Lawnridge Ave
Springfield, OR 97477
|
1,530 sq. feet
|
2 baths 3 beds |
show details |
| Photo | Address | Area | Beds / Baths | Price | Details |
|---|---|---|---|---|---|

|
#31
52nd Pl
Springfield, OR 97478
|
984 sq. feet
|
1 baths 3 beds |
show details | |

|
#32
A St
Springfield, OR 97478
|
732 sq. feet
|
1 baths 2 beds |
show details | |

|
#33
21st St
Springfield, OR 97477
|
2,438 sq. feet
|
2 baths 4 beds |
show details | |

|
#34
D St
Springfield, OR 97477
|
792 sq. feet
|
1 baths 2 beds |
show details | |

|
#35
66th St
Springfield, OR 97478
|
1,220 sq. feet
|
2 baths 3 beds |
show details | |

|
#36
Laksonen Loop
Springfield, OR 97478
|
1,168 sq. feet
|
1 baths 3 beds |
show details | |

|
#37
S 70th St
Springfield, OR 97478
|
2,080 sq. feet
|
2 baths 3 beds |
show details | |

|
#38
21st St
Springfield, OR 97477
|
976 sq. feet
|
1 baths 3 beds |
show details | |

|
#39
Mica St
Springfield, OR 97478
|
1,310 sq. feet
|
2 baths 3 beds |
show details | |

|
#40
Rhododendron St
Springfield, OR 97477
|
1,056 sq. feet
|
1 baths 3 beds |
show details |
| Photo | Address | Area | Beds / Baths | Price | Details |
|---|---|---|---|---|---|

|
#41
S 60th St
Springfield, OR 97478
|
1,501 sq. feet
|
2 baths 3 beds |
show details | |

|
#42
Cottonwood Ave
Springfield, OR 97477
|
1,056 sq. feet
|
1 baths 3 beds |
show details | |

|
#43
Mill St
Springfield, OR 97477
|
1,062 sq. feet
|
1 baths 2 beds |
show details | |

|
#44
66th St
Springfield, OR 97478
|
1,431 sq. feet
|
2 baths 3 beds |
show details | |

|
#45
N St
Springfield, OR 97477
|
1,374 sq. feet
|
1 baths 4 beds |
show details | |

|
#46
F St
Springfield, OR 97477
|
1,124 sq. feet
|
1 baths 4 beds |
show details | |

|
#47
Mckenzie Hwy
Springfield, OR 97478
|
1,639 sq. feet
|
1 baths 4 beds |
show details | |

|
#48
6th St
Springfield, OR 97477
|
1,024 sq. feet
|
1 baths 2 beds |
show details | |

|
#49
33rd St
Springfield, OR 97478
|
1,149 sq. feet
|
1 baths 3 beds |
show details | |

|
Check over 1 million property listings on Foreclosure.com!
|
browse all offers | |||

Latest news about housing in Springfield, OR collected exclusively by city-data.com from local newspapers, TV, and radio stations

 | Move from North Carolina to Eugene: Looking for apartments/townhomes/duplexes (4 replies) |
| Weekly Motel/Short-term housing in Eugene/Springfield (6 replies) |
| How bad is homelessness in Eugene and Springfield? (8 replies) |
| Eugene Dog-Friendly Apartments (16 replies) |
| Another considering Eugene post, TIA (23 replies) |
| Quiet safe neighborhood to rent a house? (5 replies) |

Median year apartment built: 1976
Household type by relationship:
Households: 61,761- Male householders: 11,861 (3,069 living alone), Female householders: 13,186 (3,611 living alone)
10,564 spouses (10,354 opposite-sex spouses), 2,800 unmarried partners, (2,658 opposite-sex unmarried partners), 16,179 children (14,955 natural, 230 adopted, 994 stepchildren), 1,310 grandchildren, 447 brothers or sisters, 599 parents, 185 foster children, 936 other relatives, 2,955 non-relatives
- In group quarters: 735
Size of family households: 7,009 2-persons, 3,936 3-persons, 2,466 4-persons, 1,037 5-persons, 504 6-persons, 132 7-or-more-persons.
Size of nonfamily households: 7,895 1-person, 2,056 2-persons, 268 3-persons, 45 4-persons, 7 5-persons.
7,641 married couples with children.
3,864 single-parent households (1,368 men, 2,496 women).
89.6% of residents of Springfield speak English at home.
7.7% of residents speak Spanish at home (71% speak English very well, 13% speak English well, 11% speak English not well, 5% don't speak English at all).
1.2% of residents speak other Indo-European language at home (70% speak English very well, 17% speak English well, 13% speak English not well).
1.1% of residents speak Asian or Pacific Island language at home (72% speak English very well, 18% speak English well, 9% speak English not well, 2% don't speak English at all).
0.2% of residents speak other language at home (94% speak English very well, 6% speak English well).
Foreign born population: 3,777 (6.1%)
(40.0% of them are naturalized citizens)
| Here: | 5.6 |
| State: | 6.2 |
| Here: | 3.9 |
| State: | 4.0 |

- Bedrooms in owner-occupied houses and condos in Springfield, Oregon
- 123no bedroom
- 3681 bedroom
- 2,7232 bedrooms
- 8,2973 bedrooms
- 1,8734 bedrooms
- 2705+ bedrooms

- Bedrooms in renter-occupied apartments in Springfield, Oregon
- 486no bedroom
- 2,5951 bedroom
- 5,3912 bedrooms
- 2,7223 bedrooms
- 4204 bedrooms
- 385+ bedrooms

- Cars and other vehicles available in Springfield in owner-occupied houses/condos
- 531no vehicle
- 3,5181 vehicle
- 5,5222 vehicles
- 2,8263 vehicles
- 7824 vehicles
- 4745+ vehicles

- Cars and other vehicles available in Springfield in renter-occupied apartments
- 1,697no vehicle
- 5,0281 vehicle
- 3,5932 vehicles
- 8353 vehicles
- 4704 vehicles
- 305+ vehicles

- Rooms in owner-occupied houses in Springfield, Oregon
- 1231 room
- 1302 rooms
- 6573 rooms
- 1,6604 rooms
- 3,8335 rooms
- 3,4056 rooms
- 1,8357 rooms
- 1,0128 rooms
- 9999+ rooms

- Rooms in renter-occupied apartments in Springfield, Oregon
- 4271 room
- 6512 rooms
- 2,5213 rooms
- 3,7634 rooms
- 2,2695 rooms
- 1,2356 rooms
- 4837 rooms
- 1788 rooms
- 1279+ rooms


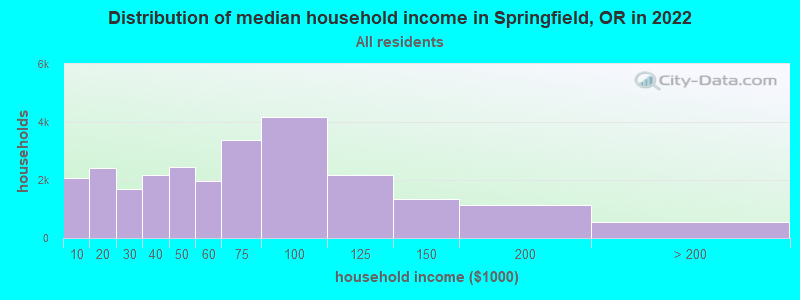
Springfield, OR household income distribution

- 2,067Less than $10,000
- 2,402$10,000 to $19,999
- 1,700$20,000 to $29,999
- 2,168$30,000 to $39,999
- 2,461$40,000 to $49,999
- 1,977$50,000 to $59,999
- 3,378$60,000 to $74,999
- 4,173$75,000 to $99,999
- 2,181$100,000 to $124,999
- 1,343$125,000 to $149,999
- 1,131$150,000 to $199,999
- 564$200,000 or more
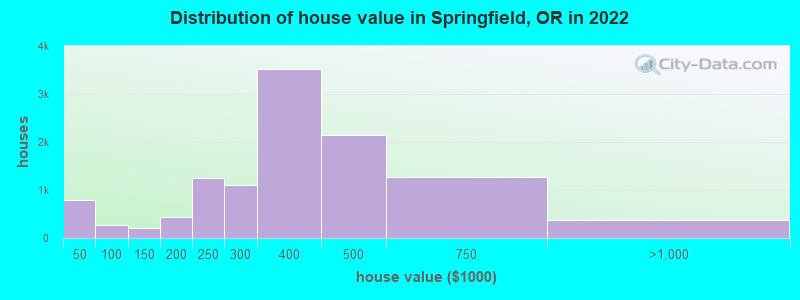
Home value of owner - occupied houses in 2022 in Springfield, OR
-
- 299Less than $10,000
- 84$10,000 to $14,999
- 71$15,000 to $19,999
- 98$20,000 to $24,999
- 93$25,000 to $29,999
- 51$30,000 to $34,999
- 24$35,000 to $39,999
- 71$40,000 to $49,999
- 40$50,000 to $59,999
- 28$60,000 to $69,999
- 85$70,000 to $79,999
- 30$80,000 to $89,999
- 22$90,000 to $99,999
- 108$100,000 to $124,999
- 104$125,000 to $149,999
- 184$150,000 to $174,999
- 260$175,000 to $199,999
- 1,255$200,000 to $249,999
- 1,102$250,000 to $299,999
- 3,524$300,000 to $399,999
- 2,142$400,000 to $499,999
- 1,276$500,000 to $749,999
- 326$750,000 to $999,999
- 22$1,000,000 to $1,499,999
- 29$2,000,000 or more
Rent paid by renters in 2022 in Springfield, OR
-
- 70Less than $100
- 32$100 to $149
- 51$150 to $199
- 55$200 to $249
- 42$250 to $299
- 62$300 to $349
- 181$350 to $399
- 101$400 to $449
- 76$450 to $499
- 244$500 to $549
- 276$550 to $599
- 233$600 to $649
- 480$650 to $699
- 452$700 to $749
- 608$750 to $799
- 1,056$800 to $899
- 1,385$900 to $999
- 2,408$1,000 to $1,249
- 1,729$1,250 to $1,499
- 1,012$1,500 to $1,999
- 113$2,000 to $2,499
- 52$3,500 or more
- 454No cash rent


Percentage of workers working in this county: 97.4%
Number of people working at home: 2,944 (9.3% of all workers)
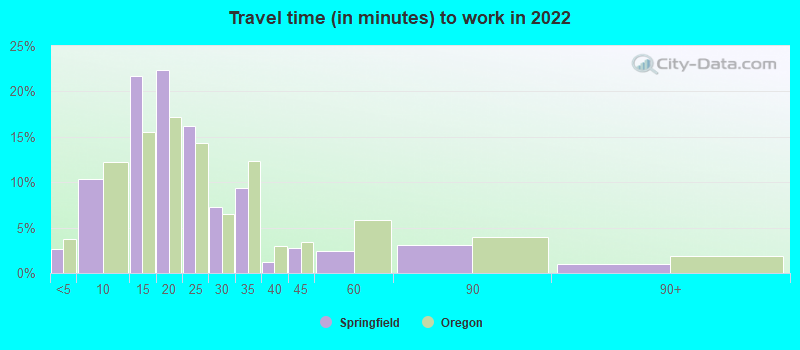
Travel time to work (commute)
- Less than 5 minutes: 611
- 5 to 9 minutes: 2,550
- 10 to 14 minutes: 7,075
- 15 to 19 minutes: 6,893
- 20 to 24 minutes: 4,525
- 25 to 29 minutes: 2,338
- 30 to 34 minutes: 2,092
- 35 to 39 minutes: 386
- 40 to 44 minutes: 430
- 45 to 59 minutes: 511
- 60 to 89 minutes: 545
- 90 or more minutes: 528
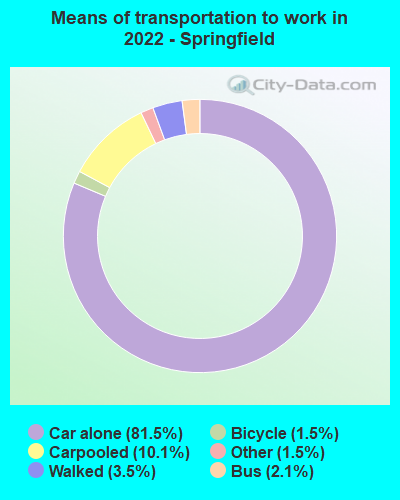
Means of transportation to work:
- Drove a car alone: 25,411 (73.1%)
- Carpooled: 3,095 (8.9%)
- Bus: 410 (1.2%)
- Taxi: 566 (1.6%)
- Bicycle: 466 (1.3%)
- Walked: 1,374 (4.0%)
- Worked at home: 2,944 (8.5%)

- Unemployment by race in 2022
- Unemployment rate for White non-Hispanic residents
- 4.4%Males
- 3.8%Females
- Unemployment rate for Black residents
- 34.6%Females
- Unemployment rate for American Indian and Alaska Native residents
- 11.0%Males
- Unemployment rate for Asian residents
- 5.8%Males
- 1.5%Females
- Unemployment rate for other race residents
- 10.4%Males
- 0.2%Females
- Unemployment rate for two or more race residents
- 4.9%Males
- 11.6%Females
- Unemployment rate for Hispanic or Latino residents
- 15.0%Males
- 3.9%Females

- Year of entry for the foreign-born population in Springfield, Oregon
- 9982010 or later
- 7352000 to 2009
- 8331990 to 1999
- 5321980 to 1989
- 2611970 to 1979
- 421Before 1970

First ancestries reported:
- English: 2,222 (10.1%)
- Irish: 2,073 (9.4%)
- German: 1,984 (9.0%)
- American: 1,879 (8.5%)
- European: 1,012 (4.6%)
- Italian: 542 (2.5%)
- Norwegian: 469 (2.1%)
- Scottish: 430 (1.9%)
- Dutch: 288 (1.3%)
- Swedish: 265 (1.2%)
- French Canadian: 198 (0.9%)
- Scandinavian: 174 (0.8%)
- French: 166 (0.8%)
- Scotch-Irish: 121 (0.5%)
- Danish: 116 (0.5%)
- Polish: 95 (0.4%)
- Australian: 75 (0.3%)
- Welsh: 68 (0.3%)
- Northern European: 63 (0.3%)
- Canadian: 62 (0.3%)
- British: 60 (0.3%)
- Eastern European: 54 (0.2%)
- Finnish: 53 (0.2%)
- Russian: 51 (0.2%)
- Swiss: 51 (0.2%)
- Egyptian: 48 (0.2%)
- Celtic: 39 (0.2%)
- Greek: 36 (0.2%)
- Czech: 34 (0.2%)
- Portuguese: 34 (0.2%)
- Ukrainian: 31 (0.1%)
- Nigerian: 20 (0.09%)
- Armenian: 19 (0.09%)
- Hungarian: 19 (0.09%)
- Albanian: 19 (0.09%)
- Croatian: 17 (0.08%)
- Czechoslovakian: 16 (0.07%)
- Icelander: 12 (0.05%)
- Austrian: 11 (0.05%)
- Basque: 8 (0.04%)
- Iranian: 8 (0.04%)
- Belgian: 5 (0.02%)
- Latvian: 5 (0.02%)
- New Zealander: 4 (0.02%)
Most common places of birth for foreign-born residents (%):
| Springfield: | 54.5% (2,029) |
| Oregon: | 33.9% (140,109) |
| Springfield: | 5.3% (196) |
| Oregon: | 3.5% (14,530) |
| Springfield: | 3.6% (135) |
| Oregon: | 4.7% (19,604) |
| Springfield: | 3.6% (133) |
| Oregon: | 0.7% (2,927) |
| Springfield: | 3.3% (122) |
| Oregon: | 0.5% (2,096) |
| Springfield: | 3.1% (114) |
| Oregon: | 1.7% (7,103) |
| Springfield: | 2.7% (101) |
| Oregon: | 1.9% (8,005) |
| Springfield: | 2.3% (87) |
| Oregon: | 3.7% (15,229) |
| Springfield: | 2.1% (78) |
| Oregon: | 2.1% (8,469) |
| Springfield: | 1.8% (67) |
| Oregon: | 0.5% (2,055) |
| Springfield: | 1.8% (66) |
| Oregon: | 1.0% (4,122) |
| Springfield: | 1.6% (60) |
| Oregon: | 0.7% (2,761) |
| Springfield: | 1.6% (60) |
| Oregon: | 0.1% (302) |
| Springfield: | 1.6% (58) |
| Oregon: | 0.2% (919) |
| Springfield: | 1.5% (57) |
| Oregon: | 0.5% (1,921) |
Place of birth for U.S.-born residents:
- This state: 32,025
- Other state: 25,310
- Northeast: 1,368
- Midwest: 4,585
- South: 2,723
- West: 16,707
85.9% of Springfield residents lived in the same house 1 years ago.
Out of people who lived in different houses, 40.1% lived in this county.
Out of people who lived in different counties, 39.2% lived in Oregon.
| Springfield: | 85.9% |
| State average: | 85.5% |
Education attainment for males 25 years and older:
- No schooling: 198
- Nursery to 4th grade: 66
- 5th and 6th grade: 524
- 7th and 8th grade: 56
- 9th grade: 110
- 10th grade: 304
- 11th grade: 326
- 12th grade, no diploma: 616
- High school graduate (or equivalency): 5,771
- Less than 1 year of college: 2,270
- Some college more than 1 year, no degree: 3,872
- Associate degree: 1,763
- Bachelor's degree: 3,119
- Master's degree: 766
- Professional school degree: 282
- Doctorate degree: 225

Education attainment for females 25 years and older:
- No schooling: 393
- Nursery to 4th grade: 5
- 5th and 6th grade: 482
- 7th and 8th grade: 72
- 9th grade: 166
- 10th grade: 228
- 11th grade: 316
- 12th grade, no diploma: 550
- High school graduate (or equivalency): 5,549
- Less than 1 year of college: 2,507
- Some college more than 1 year, no degree: 4,042
- Associate degree: 2,503
- Bachelor's degree: 3,634
- Master's degree: 1,112
- Professional school degree: 155
- Doctorate degree: 101


Housing units in structures:
- One, detached: 14,517
- One, attached: 2,149
- Two: 1,496
- 3 or 4: 1,543
- 5 to 9: 1,635
- 10 to 19: 905
- 20 to 49: 719
- 50 or more: 955
- Mobile homes: 1,975
- Boats, RVs, vans, etc.: 151
Median worth of mobile homes: $42,121
Housing units lacking complete kitchen facilities in 2022: 1.5%
House/condo owner moved in on average 10 years ago
Renter moved in on average 4 years ago

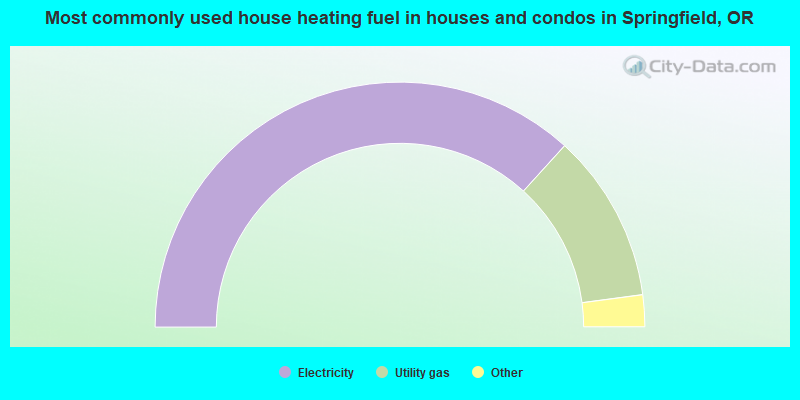
- 73.5%Electricity
- 22.3%Utility gas
- 2.6%Wood
- 0.8%No fuel used
- 0.6%Bottled, tank, or LP gas
- 0.1%Fuel oil, kerosene, etc.
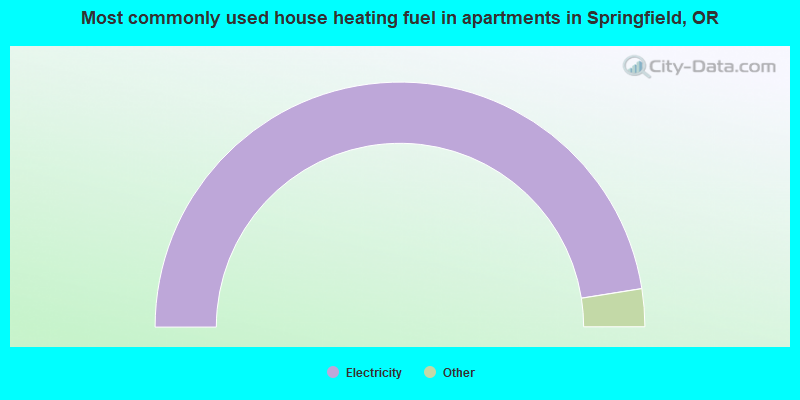
- 95.0%Electricity
- 3.3%Utility gas
- 0.5%Wood
- 0.4%Bottled, tank, or LP gas
- 0.3%Other fuel
- 0.2%Coal or coke
- 0.2%No fuel used
Private vs. public school enrollment:
| Here: | 12.7% |
| Oregon: | 13.7% |
| Here: | 12.5% |
| Oregon: | 8.8% |
| Here: | 17.3% |
| Oregon: | 17.7% |


