Races in Baker City, Oregon (OR) Detailed Stats
Ancestries, Foreign-born residents, place of birth
Settings
X


Recent posts about races in Baker City, Oregon on our local forum with over 2,400,000 registered users:
 | Anyone Knowledgeable About Baker City? (27 replies) |
| Pro and Cons on Klamath Falls (195 replies) |
| How to Oregonians feel about Calif. transplants (308 replies) |
| Baker City questions (34 replies) |
| House in the rural areas of eastern Oregon (27 replies) |
| Baker City, Oregon Snow levels, metal detecting, and housing (13 replies) |
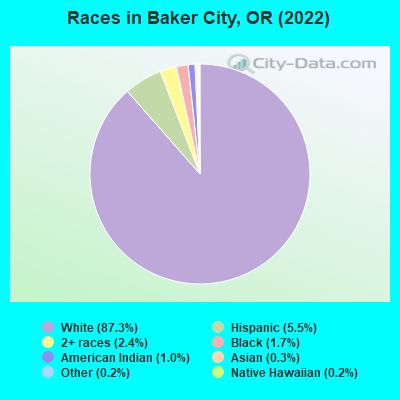
According to 2022 data, the most numerous races in Baker City, OR are White alone (8,849 residents), Hispanic (557 residents), and Two or more races (240 residents). 97.3% of Baker City residents speak English at home. 2.2% of Baker City, OR residents are foreign-born (1.0% born in Latin America, 0.8% born in Africa, 0.3% born in Europe), which is 310.9% less than the foreign-born rate of 9.0% across the entire state of Oregon.
Race distribution in Baker City
2000
2022

- 9,26894.0%White alone
- 2502.5%Hispanic
- 1471.5%Two or more races
- 981.0%American Indian alone
- 530.5%Asian alone
- 300.3%Black alone
- 80.08%Other race alone
- 60.06%Native Hawaiian and Other
Pacific Islander alone

-
- 8,84987.3%White alone
- 5575.5%Hispanic
- 2402.4%Two or more races
- 1741.7%Black alone
- 1001.0%American Indian alone
- 280.3%Asian alone
- 190.2%Other race alone
- 160.2%Native Hawaiian and Other
Pacific Islander alone
2000
2022
-
- 2,857,61683.5%White alone
- 275,3148.0%Hispanic
- 100,3332.9%Asian alone
- 82,7332.4%Two or more races
- 53,3251.6%Black alone
- 40,1301.2%American Indian alone
- 7,3980.2%Native Hawaiian and Other
Pacific Islander alone - 4,5500.1%Other race alone

-
- 3,037,57171.6%White alone
- 609,53814.4%Hispanic
- 252,7446.0%Two or more races
- 191,2834.5%Asian alone
- 78,2281.8%Black alone
- 29,3990.7%American Indian alone
- 25,7310.6%Other race alone
- 15,6430.4%Native Hawaiian and Other
Pacific Islander alone

Income and house value in Baker City
- Median household income in 2022
- $54,671White non-Hispanic householders
- $54,863Some other race householders
- $69,313Hispanic or Latino race householders
- Median 2022 house value
- $245,707White Non-Hispanic householders
- $224,458Black or African American householders
- $381,580American Indian or Alaska Native householders
- $164,603Asian householders
- $132,879Two or more races householders
- $112,229Hispanic or Latino householders
Household income for White non-Hispanic householders

Household income for Black householders

Household income for Some other race householders

Household income for Two or more races householders

Household income for Hispanic or Latino race householders

Median age by race in Baker City
- 45.8Median age for White residents
- 44.0Males
- 47.7Females
- 44.7Median age for Black or African American residents
- 46.6Males
- -625,514,402.7Females
- 56.0Median age for American Indian / Alaska Native residents
- 32.4Males
- 90.7Females
- 56.6Median age for Asian residents
- -696,883,852.0Males
- -681,895,092.4Females
- -764,705,881.6Median age for Native Hawaiian / Pacific Islander residents
- -764,119,600.6Males
- -774,891,774.1Females
- 17.3Median age for Other race residents
- 13.7Males
- 24.9Females
- 36.8Median age for Two or more races residents
- 32.6Males
- 49.0Females
- 45.6Median age for White alone residents
- 43.9Males
- 47.4Females
- 29.1Median age for Hispanic or Latino residents
- 29.5Males
- 26.3Females
Owner/renter occupied households by race in Baker City
- House owners and renters - White residents
- 2,85673.4%Owner occupied
- 1,03726.6%Renter occupied
- House owners and renters - Black or African American residents
- 61100.0%Owner occupied
- House owners and renters - American Indian / Alaska Native residents
- 50100.0%Owner occupied
- House owners and renters - Asian residents
- 17100.0%Owner occupied
- House owners and renters - Native Hawaiian / Pacific Islander residents
- 5100.0%Renter occupied
- House owners and renters - Other race residents
- 46100.0%Renter occupied
- House owners and renters - Two or more races residents
- 5630.8%Owner occupied
- 12569.2%Renter occupied
- House owners and renters - White alone residents
- 2,84572.9%Owner occupied
- 1,05627.1%Renter occupied
- House owners and renters - Hispanic or Latino residents
- 5840.5%Owner occupied
- 8559.5%Renter occupied
Language usage in Baker City
- English speakers - Total
- 97.3% of residents of Baker City speak English at home.
- 2.2% of residents speak Spanish at home
- 14769.7%Speak English very well
- 6430.3%Speak English less than very well
- 0.4% of residents speak other language at home
- 2256.4%Speak English very well
- 1743.6%Speak English less than very well
- English speakers - Born in the United States
- 96.9% of residents of Baker City speak English at home.
- 3.1% of residents speak Spanish at home
- 13596.4%Speak English very well
- 53.6%Speak English less than very well
- English speakers - Native, born elsewhere
- 76.4% of residents of Baker City speak English at home.
- 4.2% of residents speak Spanish at home
- 3100.0%Speak English less than very well
- 19.4% of residents speak other language at home
- 14100.0%Speak English very well
- English speakers - Foreign-born
- 76.1% of residents of Baker City speak English at home.
- 26.1% of residents speak Spanish at home
- 58.6%Speak English very well
- 5391.4%Speak English less than very well
White (Caucasian) - Speak only English
| Native: | 100.0% (8,386) |
| Foreign-born: | 100.0% (74) |
Black or African American - Speak only English
| Native: | 87.5% (100) |
| Foreign-born: | 100.0% (64) |
Other race - Speak another language
| Native: | 59.4% (98) |
| Foreign-born: | 100.0% (60) |
Two or more races - Speak another language
| Native: | 2.1% (7) |
| Foreign-born: | 100.0% (15) |
White alone - Speak only English
| Native: | 99.4% (8,315) |
| Foreign-born: | 100.0% (56) |
Hispanic or Latino - Speak only English
| Native: | 73.5% (305) |
| Foreign-born: | 48.1% (51) |
Hispanic or Latino - Speak another language
| Native: | 27.9% (116) |
| Foreign-born: | 55.2% (59) |
Foreign-born residents in Baker City
222 residents are foreign born (1.0% Latin America, 0.8% Africa, 0.3% Europe).
| This city: | 2.2% |
| Oregon: | 9.8% |


Marital status for residents in Baker City
Marital status - White (Caucasian) population 15 years and over
- Males
- 35.2%Never married
- 47.4%Now married
- 0.6%Separated
- 4.5%Widowed
- 12.3%Divorced
- Females
- 23.5%Never married
- 47.8%Now married
- 0.9%Separated
- 12.0%Widowed
- 15.8%Divorced
Women who gave birth in the past 12 months
| Now married: | 31.0% (21) |
| Unmarried: | 69.0% (46) |
Women who did not give birth in the past 12 months
| Now married: | 50.3% (775) |
| Unmarried: | 49.7% (767) |
Marital status - Black or African American population 15 years and over
- Males
- 63.6%Never married
- 7.5%Now married
- 0.0%Separated
- 0.0%Widowed
- 29.0%Divorced
- Females
- 100.0%Never married
- 0.0%Now married
- 0.0%Separated
- 0.0%Widowed
- 0.0%Divorced
Women who did not give birth in the past 12 months
| Now married: | 0.0% (0) |
| Unmarried: | 100.0% (1) |
Marital status - American Indian / Alaska Native population 15 years and over
- Males
- 12.8%Never married
- 76.6%Now married
- 0.0%Separated
- 0.0%Widowed
- 10.6%Divorced
- Females
- 13.0%Never married
- 87.0%Now married
- 0.0%Separated
- 0.0%Widowed
- 0.0%Divorced
Women who did not give birth in the past 12 months
| Now married: | 0.0% (0) |
| Unmarried: | 100.0% (10) |
Marital status - Asian population 15 years and over
- Males
- 0.0%Never married
- 100.0%Now married
- 0.0%Separated
- 0.0%Widowed
- 0.0%Divorced
- Females
- 0.0%Never married
- 20.0%Now married
- 0.0%Separated
- 0.0%Widowed
- 80.0%Divorced
Marital status - Native Hawaiian / Pacific Islander population 15 years and over
- Males
- 100.0%Never married
- 0.0%Now married
- 0.0%Separated
- 0.0%Widowed
- 0.0%Divorced
- Females
- 0.0%Never married
- 100.0%Now married
- 0.0%Separated
- 0.0%Widowed
- 0.0%Divorced
Women who did not give birth in the past 12 months
| Now married: | 100.0% (14) |
| Unmarried: | 0.0% (0) |
Marital status - Other race population 15 years and over
- Males
- 27.8%Never married
- 59.3%Now married
- 0.0%Separated
- 0.0%Widowed
- 13.0%Divorced
- Females
- 57.4%Never married
- 42.6%Now married
- 0.0%Separated
- 0.0%Widowed
- 0.0%Divorced
Women who gave birth in the past 12 months
| Now married: | 100.0% (34) |
| Unmarried: | 0.0% (0) |
Women who did not give birth in the past 12 months
| Now married: | 2.8% (1) |
| Unmarried: | 97.2% (48) |
Marital status - Two or more races population 15 years and over
- Males
- 18.8%Never married
- 32.0%Now married
- 0.0%Separated
- 21.9%Widowed
- 27.3%Divorced
- Females
- 37.6%Never married
- 30.1%Now married
- 0.0%Separated
- 26.9%Widowed
- 5.4%Divorced
Women who did not give birth in the past 12 months
| Now married: | 4.8% (3) |
| Unmarried: | 95.2% (50) |
Marital status - White alone, not Hispanic / Latino population 15 years and over
- Males
- 35.6%Never married
- 47.1%Now married
- 0.6%Separated
- 4.6%Widowed
- 12.2%Divorced
- Females
- 22.4%Never married
- 48.4%Now married
- 1.0%Separated
- 12.2%Widowed
- 16.1%Divorced
Women who gave birth in the past 12 months
| Now married: | 31.0% (21) |
| Unmarried: | 69.0% (48) |
Women who did not give birth in the past 12 months
| Now married: | 52.1% (805) |
| Unmarried: | 47.9% (739) |
Marital status - Hispanic or Latino population 15 years and over
- Males
- 25.0%Never married
- 47.4%Now married
- 0.0%Separated
- 0.0%Widowed
- 27.6%Divorced
- Females
- 58.7%Never married
- 34.2%Now married
- 0.0%Separated
- 7.1%Widowed
- 0.0%Divorced
Women who gave birth in the past 12 months
| Now married: | 100.0% (26) |
| Unmarried: | 0.0% (0) |
Women who did not give birth in the past 12 months
| Now married: | 1.1% (1) |
| Unmarried: | 98.9% (96) |
Ancestries in Baker City

- 63115.0%German
- 57613.7%English
- 45210.7%American
- 2696.4%Irish
- 2586.1%European
- 1613.8%French
- 1333.2%Norwegian
- 1052.5%Basque
- 982.3%Scottish
- 741.8%Italian
- 681.6%Swedish
- 551.3%Ethiopian
- 330.8%Dutch
- 320.8%Danish
- 320.8%Serbian
- 180.4%Northern European
- 160.4%Belgian
- 160.4%Ukrainian
- 100.2%Russian
- 80.2%Eastern European
- 70.2%Polish
- 60.1%Swiss
- 50.1%British
- 50.1%Portuguese
- 50.1%Scandinavian

Geographical mobility in Baker City

- Same house 1 year ago
- 7,38584.8%White (Caucasian)
- 14179.5%Black or African American
- 131100.0%American Indian / Alaska Native
- 1344.1%Asian
- 424.7%Native Hawaiian / Pacific Islander
- 7634.1%Other race
- 32578.7%Two or more races
- 7,44284.8%White alone, not Hispanic / Latino
- 34967.2%Hispanic or Latino

-
- Moved within same county
- 5606.4%White / Caucasian
- 10.4%Black or African American
- 10848.6%Other race
- 215.2%Two or more races
- 5746.5%White alone, not Hispanic / Latino
- 10420.0%Hispanic or Latino

-
- Moved within same state
- 6547.5%White / Caucasian
- 3419.4%Black or African American
- 2068.5%Asian
- 1695.2%Native Hawaiian / Pacific Islander
- 83.5%Other race
- 4611.0%Two or more races
- 6397.3%White alone, not Hispanic / Latino
- 468.8%Hispanic or Latino

-
- Moved from different state
- 1531.8%White / Caucasian
- 174.2%Two or more races
- 1531.7%White alone, not Hispanic / Latino
- 51.0%Hispanic or Latino

Children Nativity (place of birth) in Baker City
Place of birth for residents in Baker City
![Place of birth for the foreign-born population - Regions]()
- 115Americas
- 100Latin America
- 100Central America
- 79Africa
- 63Eastern Africa
- 27Europe
- 19Eastern Europe
- 16Southern Africa
- 14Northern America
- 8Western Europe

![Place of birth for the foreign-born population - Countries]()
- 100Mexico
- 63Ethiopia
- 17Ukraine
- 16South Africa
- 14Canada
- 8Netherlands
- 2Russia

Grandparents responsible for own grandchildren in Baker City
Zip codes: 97814.