Races in Dallas, Oregon (OR) Detailed Stats
Data:
Races - White alone (%)
Races - White alone (% change since 2000)
Races - Black alone (%)
Races - Black alone (% change since 2000)
Races - American Indian alone (%)
Races - American Indian alone (% change since 2000)
Races - Asian alone (%)
Races - Asian alone (% change since 2000)
Races - Hispanic (%)
Races - Hispanic (% change since 2000)
Races - Native Hawaiian and Other Pacific Islander alone (%)
Races - Native Hawaiian and Other Pacific Islander alone (% change since 2000)
Races - Two or more races(%)
Races - Two or more races(% change since 2000)
Races - Other race alone (%)
Races - Other race alone (% change since 2000)
Racial diversity
Place of birth - Born in state of residence (%)
Place of birth - Born in state of residence (%) - White
Place of birth - Born in state of residence (%) - Black or African American
Place of birth - Born in state of residence (%) - Asian
Place of birth - Born in state of residence (%) - Hispanic or Latino
Place of birth - Born in state of residence (%) - American Indian and Alaska Native
Place of birth - Born in state of residence (%) - Multirace
Place of birth - Born in state of residence (%) - Other Race
Place of birth - Born in other state (%)
Place of birth - Born in other state (%) - White
Place of birth - Born in other state (%) - Black or African American
Place of birth - Born in other state (%) - Asian
Place of birth - Born in other state (%) - Hispanic or Latino
Place of birth - Born in other state (%) - American Indian and Alaska Native
Place of birth - Born in other state (%) - Multirace
Place of birth - Born in other state (%) - Other Race
Place of birth - Native, outside of US (%)
Place of birth - Native, outside of US (%) - White
Place of birth - Native, outside of US (%) - Black or African American
Place of birth - Native, outside of US (%) - Asian
Place of birth - Native, outside of US (%) - Hispanic or Latino
Place of birth - Native, outside of US (%) - American Indian and Alaska Native
Place of birth - Native, outside of US (%) - Multirace
Place of birth - Native, outside of US (%) - Other Race
Place of birth - Foreign born (%)
Place of birth - Foreign born (%) - White
Place of birth - Foreign born (%) - Black or African American
Place of birth - Foreign born (%) - Asian
Place of birth - Foreign born (%) - Hispanic or Latino
Place of birth - Foreign born (%) - American Indian and Alaska Native
Place of birth - Foreign born (%) - Multirace
Place of birth - Foreign born (%) - Other Race
Residents speaking English at home (%)
Residents speaking English at home - Born in the United States (%)
Residents speaking English at home - Native, born elsewhere (%)
Residents speaking English at home - Foreign born (%)
Residents speaking Spanish at home (%)
Residents speaking Spanish at home - Born in the United States (%)
Residents speaking Spanish at home - Native, born elsewhere (%)
Residents speaking Spanish at home - Foreign born (%)
Residents speaking other language at home (%)
Residents speaking other language at home - Born in the United States (%)
Residents speaking other language at home - Native, born elsewhere (%)
Residents speaking other language at home - Foreign born (%)
Marital status - Never married (%)
Marital status - Now married (%)
Marital status - Separated (%)
Marital status - Widowed (%)
Marital status - Divorced (%)
Ancestries Reported - Arab (%)
Ancestries Reported - Czech (%)
Ancestries Reported - Danish (%)
Ancestries Reported - Dutch (%)
Ancestries Reported - English (%)
Ancestries Reported - French (%)
Ancestries Reported - French Canadian (%)
Ancestries Reported - German (%)
Ancestries Reported - Greek (%)
Ancestries Reported - Hungarian (%)
Ancestries Reported - Irish (%)
Ancestries Reported - Italian (%)
Ancestries Reported - Lithuanian (%)
Ancestries Reported - Norwegian (%)
Ancestries Reported - Polish (%)
Ancestries Reported - Portuguese (%)
Ancestries Reported - Russian (%)
Ancestries Reported - Scotch-Irish (%)
Ancestries Reported - Scottish (%)
Ancestries Reported - Slovak (%)
Ancestries Reported - Subsaharan African (%)
Ancestries Reported - Swedish (%)
Ancestries Reported - Swiss (%)
Ancestries Reported - Ukrainian (%)
Ancestries Reported - United States (%)
Ancestries Reported - Welsh (%)
Ancestries Reported - West Indian (%)
Ancestries Reported - Other (%)
Geographical mobility - Same house 1 year ago (%)
Geographical mobility - Same house 1 year ago (%) - White
Geographical mobility - Same house 1 year ago (%) - Black or African American
Geographical mobility - Same house 1 year ago (%) - Asian
Geographical mobility - Same house 1 year ago (%) - Hispanic or Latino
Geographical mobility - Same house 1 year ago (%) - American Indian and Alaska Native
Geographical mobility - Same house 1 year ago (%) - Multirace
Geographical mobility - Same house 1 year ago (%) - Other Race
Geographical mobility - Moved within same county (%)
Geographical mobility - Moved within same county (%) - White
Geographical mobility - Moved within same county (%) - Black or African American
Geographical mobility - Moved within same county (%) - Asian
Geographical mobility - Moved within same county (%) - Hispanic or Latino
Geographical mobility - Moved within same county (%) - American Indian and Alaska Native
Geographical mobility - Moved within same county (%) - Multirace
Geographical mobility - Moved within same county (%) - Other Race
Geographical mobility - Moved from different county within same state (%)
Geographical mobility - Moved from different county within same state (%) - White
Geographical mobility - Moved from different county within same state (%) - Black or African American
Geographical mobility - Moved from different county within same state (%) - Asian
Geographical mobility - Moved from different county within same state (%) - Hispanic or Latino
Geographical mobility - Moved from different county within same state (%) - American Indian and Alaska Native
Geographical mobility - Moved from different county within same state (%) - Multirace
Geographical mobility - Moved from different county within same state (%) - Other Race
Geographical mobility - Moved from different state (%)
Geographical mobility - Moved from different state (%) - White
Geographical mobility - Moved from different state (%) - Black or African American
Geographical mobility - Moved from different state (%) - Asian
Geographical mobility - Moved from different state (%) - Hispanic or Latino
Geographical mobility - Moved from different state (%) - American Indian and Alaska Native
Geographical mobility - Moved from different state (%) - Multirace
Geographical mobility - Moved from different state (%) - Other Race
Geographical mobility - Moved from abroad (%)
Geographical mobility - Moved from abroad (%) - White
Geographical mobility - Moved from abroad (%) - Black or African American
Geographical mobility - Moved from abroad (%) - Asian
Geographical mobility - Moved from abroad (%) - Hispanic or Latino
Geographical mobility - Moved from abroad (%) - American Indian and Alaska Native
Geographical mobility - Moved from abroad (%) - Multirace
Geographical mobility - Moved from abroad (%) - Other Race
Place of birth for the foreign-born population - Ireland (%)
Place of birth for the foreign-born population - Denmark (%)
Place of birth for the foreign-born population - Norway (%)
Place of birth for the foreign-born population - Sweden (%)
Place of birth for the foreign-born population - United Kingdom (%)
Place of birth for the foreign-born population - England (%)
Place of birth for the foreign-born population - Scotland (%)
Place of birth for the foreign-born population - Other Northern Europe (%)
Place of birth for the foreign-born population - Austria (%)
Place of birth for the foreign-born population - Belgium (%)
Place of birth for the foreign-born population - France (%)
Place of birth for the foreign-born population - Germany (%)
Place of birth for the foreign-born population - Netherlands (%)
Place of birth for the foreign-born population - Switzerland (%)
Place of birth for the foreign-born population - Other Western Europe (%)
Place of birth for the foreign-born population - Greece (%)
Place of birth for the foreign-born population - Italy (%)
Place of birth for the foreign-born population - Portugal (%)
Place of birth for the foreign-born population - Spain (%)
Place of birth for the foreign-born population - Other Southern Europe (%)
Place of birth for the foreign-born population - Albania (%)
Place of birth for the foreign-born population - Belarus (%)
Place of birth for the foreign-born population - Bosnia and Herzegovina (%)
Place of birth for the foreign-born population - Bulgaria (%)
Place of birth for the foreign-born population - Croatia (%)
Place of birth for the foreign-born population - Czechoslovakia (%)
Place of birth for the foreign-born population - Hungary (%)
Place of birth for the foreign-born population - Latvia (%)
Place of birth for the foreign-born population - Lithuania (%)
Place of birth for the foreign-born population - North Macedonia (Macedonia) (%)
Place of birth for the foreign-born population - Moldova (%)
Place of birth for the foreign-born population - Poland (%)
Place of birth for the foreign-born population - Romania (%)
Place of birth for the foreign-born population - Russia (%)
Place of birth for the foreign-born population - Serbia (%)
Place of birth for the foreign-born population - Ukraine (%)
Place of birth for the foreign-born population - Other Eastern Europe (%)
Place of birth for the foreign-born population - China (%)
Place of birth for the foreign-born population - Hong Kong (%)
Place of birth for the foreign-born population - Taiwan (%)
Place of birth for the foreign-born population - Japan (%)
Place of birth for the foreign-born population - Korea (%)
Place of birth for the foreign-born population - Other Eastern Asia (%)
Place of birth for the foreign-born population - Afghanistan (%)
Place of birth for the foreign-born population - Bangladesh (%)
Place of birth for the foreign-born population - India (%)
Place of birth for the foreign-born population - Iran (%)
Place of birth for the foreign-born population - Kazakhstan (%)
Place of birth for the foreign-born population - Nepal (%)
Place of birth for the foreign-born population - Pakistan (%)
Place of birth for the foreign-born population - Sri Lanka (%)
Place of birth for the foreign-born population - Uzbekistan (%)
Place of birth for the foreign-born population - Other South Central Asia (%)
Place of birth for the foreign-born population - Burma (%)
Place of birth for the foreign-born population - Cambodia (%)
Place of birth for the foreign-born population - Indonesia (%)
Place of birth for the foreign-born population - Laos (%)
Place of birth for the foreign-born population - Malaysia (%)
Place of birth for the foreign-born population - Philippines (%)
Place of birth for the foreign-born population - Singapore (%)
Place of birth for the foreign-born population - Thailand (%)
Place of birth for the foreign-born population - Vietnam (%)
Place of birth for the foreign-born population - Other South Eastern Asia (%)
Place of birth for the foreign-born population - Armenia (%)
Place of birth for the foreign-born population - Iraq (%)
Place of birth for the foreign-born population - Israel (%)
Place of birth for the foreign-born population - Jordan (%)
Place of birth for the foreign-born population - Kuwait (%)
Place of birth for the foreign-born population - Lebanon (%)
Place of birth for the foreign-born population - Saudi Arabia (%)
Place of birth for the foreign-born population - Syria (%)
Place of birth for the foreign-born population - Turkey (%)
Place of birth for the foreign-born population - Yemen (%)
Place of birth for the foreign-born population - Other Western Asia (%)
Place of birth for the foreign-born population - Eritrea (%)
Place of birth for the foreign-born population - Ethiopia (%)
Place of birth for the foreign-born population - Kenya (%)
Place of birth for the foreign-born population - Somalia (%)
Place of birth for the foreign-born population - Uganda (%)
Place of birth for the foreign-born population - Zimbabwe (%)
Place of birth for the foreign-born population - Other Eastern Africa (%)
Place of birth for the foreign-born population - Cameroon (%)
Place of birth for the foreign-born population - Congo (%)
Place of birth for the foreign-born population - Democratic Republic of Congo (Zaire) (%)
Place of birth for the foreign-born population - Other Middle Africa (%)
Place of birth for the foreign-born population - Egypt (%)
Place of birth for the foreign-born population - Morocco (%)
Place of birth for the foreign-born population - Sudan (%)
Place of birth for the foreign-born population - Other Northern Africa (%)
Place of birth for the foreign-born population - South Africa (%)
Place of birth for the foreign-born population - Other Southern Africa (%)
Place of birth for the foreign-born population - Cabo Verde (%)
Place of birth for the foreign-born population - Ghana (%)
Place of birth for the foreign-born population - Liberia (%)
Place of birth for the foreign-born population - Nigeria (%)
Place of birth for the foreign-born population - Senegal (%)
Place of birth for the foreign-born population - Sierra Leone (%)
Place of birth for the foreign-born population - Other Western Africa (%)
Place of birth for the foreign-born population - Australia (%)
Place of birth for the foreign-born population - New Zealand (%)
Place of birth for the foreign-born population - Fiji (%)
Place of birth for the foreign-born population - Micronesia (%)
Place of birth for the foreign-born population - Bahamas (%)
Place of birth for the foreign-born population - Barbados (%)
Place of birth for the foreign-born population - Cuba (%)
Place of birth for the foreign-born population - Dominica (%)
Place of birth for the foreign-born population - Dominican Republic (%)
Place of birth for the foreign-born population - Grenada (%)
Place of birth for the foreign-born population - Haiti (%)
Place of birth for the foreign-born population - Jamaica (%)
Place of birth for the foreign-born population - St. Vincent and the Grenadines (%)
Place of birth for the foreign-born population - Trinidad and Tobago (%)
Place of birth for the foreign-born population - West Indies (%)
Place of birth for the foreign-born population - Other Caribbean (%)
Place of birth for the foreign-born population - Belize (%)
Place of birth for the foreign-born population - Costa Rica (%)
Place of birth for the foreign-born population - El Salvador (%)
Place of birth for the foreign-born population - Guatemala (%)
Place of birth for the foreign-born population - Honduras (%)
Place of birth for the foreign-born population - Mexico (%)
Place of birth for the foreign-born population - Nicaragua (%)
Place of birth for the foreign-born population - Panama (%)
Place of birth for the foreign-born population - Other Central America (%)
Place of birth for the foreign-born population - Argentina (%)
Place of birth for the foreign-born population - Bolivia (%)
Place of birth for the foreign-born population - Brazil (%)
Place of birth for the foreign-born population - Chile (%)
Place of birth for the foreign-born population - Colombia (%)
Place of birth for the foreign-born population - Ecuador (%)
Place of birth for the foreign-born population - Guyana (%)
Place of birth for the foreign-born population - Peru (%)
Place of birth for the foreign-born population - Uruguay (%)
Place of birth for the foreign-born population - Venezuela (%)
Place of birth for the foreign-born population - Other South America (%)
Place of birth for the foreign-born population - Canada (%)
Place of birth for the foreign-born population - Other Northern America (%)
Place of birth for the foreign-born population - Other (%)
Latest news about races in Dallas, OR collected exclusively by city-data.com from local newspapers, TV, and radio stations
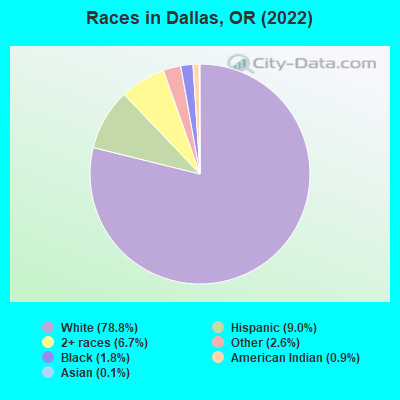
According to 2022 data, the most numerous races in Dallas, OR are White alone (13,667 residents), Hispanic (1,561 residents), and Two or more races (1,168 residents). 94.6% of Dallas residents speak English at home. 3.9% of Dallas, OR residents are foreign-born (2.2% born in Latin America, 1.1% born in Europe), which is 133.6% less than the foreign-born rate of 9.0% across the entire state of Oregon.
Race distribution in Dallas
2000 2022
2,857,616 83.5% White alone 275,314 8.0% Hispanic 100,333 2.9% Asian alone 82,733 2.4% Two or more races 53,325 1.6% Black alone 40,130 1.2% American Indian alone 7,398 0.2% Native Hawaiian and Other 4,550 0.1% Other race alone
3,037,571 71.6% White alone 609,538 14.4% Hispanic 252,744 6.0% Two or more races 191,283 4.5% Asian alone 78,228 1.8% Black alone 29,399 0.7% American Indian alone 25,731 0.6% Other race alone 15,643 0.4% Native Hawaiian and Other
Income and house value in Dallas Median household income in 2022 $67,343 White non-Hispanic householders$53,002 American Indian and Alaska Native householdersover $200,000 Some other race householders$63,733 Hispanic or Latino race householdersMedian 2022 house value $411,931 White Non-Hispanic householders$614,456 Black or African American householders$325,744 American Indian or Alaska Native householders $737,348 Asian householders$311,324 Some other race householders$448,307 Two or more races householders$320,500 Hispanic or Latino householders
Median age by race in Dallas
44.3 Median age for White residents42.8 47.6 40.9 Median age for Black or African American residents30.8 63.2 27.1 Median age for American Indian / Alaska Native residents31.2 43.8 66.0 Median age for Asian residents-889,570,551.3 -663,514,577.7 -1,538,461,536.9 Median age for Native Hawaiian / Pacific Islander residents-802,359,881.2 -706,093,189.3 33.7 Median age for Other race residents31.2 17.2 34.0 Median age for Two or more races residents28.5 38.8 45.0 Median age for White alone residents42.2 48.0 30.4 Median age for Hispanic or Latino residents28.3 27.2
Owner/renter occupied households by race in Dallas
House owners and renters - White residents 4,146 72.7% Owner occupied1,557 27.3% Renter occupiedHouse owners and renters - Black or African American residents 12 32.4% Owner occupied26 67.6% Renter occupiedHouse owners and renters - American Indian / Alaska Native residents 153 68.3% Owner occupied71 31.7% Renter occupiedHouse owners and renters - Asian residents 5 35.0% Owner occupied9 65.0% Renter occupiedHouse owners and renters - Other race residents 127 89.2% Owner occupied15 10.8% Renter occupiedHouse owners and renters - Two or more races residents 318 44.5% Owner occupied397 55.5% Renter occupiedHouse owners and renters - White alone residents 4,087 72.1% Owner occupied1,584 27.9% Renter occupiedHouse owners and renters - Hispanic or Latino residents 339 72.0% Owner occupied132 28.0% Renter occupied
Language usage in Dallas
English speakers - Total 94.6% of residents of Dallas speak English at home.
4.4% of residents speak Spanish at home 529 72.8% Speak English very well198 27.2% Speak English less than very well1.3% of residents speak other language at home 201 93.5% Speak English very well14 6.5% Speak English less than very well
English speakers - Born in the United States 96.8% of residents of Dallas speak English at home.
1.8% of residents speak Spanish at home 101 79.5% Speak English very well26 20.5% Speak English less than very well1.1% of residents speak other language at home 80 100.0% Speak English very well
English speakers - Native, born elsewhere 97.6% of residents of Dallas speak English at home.
English speakers - Foreign-born 46.1% of residents of Dallas speak English at home.
48.9% of residents speak Spanish at home 259 73.8% Speak English very well92 26.2% Speak English less than very well13.0% of residents speak other language at home 84 90.3% Speak English very well9 9.7% Speak English less than very well
White (Caucasian) - Speak only English Native:
99.4% (12,724)Foreign-born:
80.1% (187)
White (Caucasian) - Speak another language Native:
1.1% (143)Foreign-born:
32.0% (75)
Asian - Speak only English Native:
100.0% (8)Foreign-born:
94.4% (14)
Other race - Speak only English Native:
68.3% (331)Foreign-born:
57.8% (123)
Other race - Speak another language Native:
31.6% (153)Foreign-born:
61.1% (129)
Two or more races - Speak only English Native:
89.2% (1,513)Foreign-born:
15.9% (17)
Two or more races - Speak another language Native:
11.8% (199)Foreign-born:
85.7% (93)
White alone - Speak only English Native:
99.6% (12,554)Foreign-born:
78.0% (190)
White alone - Speak another language Native:
0.5% (65)Foreign-born:
23.0% (56)
Hispanic or Latino - Speak only English Native:
70.5% (721)Foreign-born:
22.5% (93)
Hispanic or Latino - Speak another language Native:
31.3% (320)Foreign-born:
80.2% (331)
Foreign-born residents in Dallas 668 residents are foreign born (2.2% Latin America , 1.1% Europe ).
This city:
3.9%Oregon:
9.8%
Marital status for residents in Dallas Marital status - White (Caucasian) population 15 years and over
Males 27.5% Never married59.2% Now married1.4% Separated1.9% Widowed10.1% DivorcedFemales 22.1% Never married50.0% Now married0.6% Separated8.7% Widowed18.6% DivorcedWomen who gave birth in the past 12 months Now married:
63.9% (120)Unmarried:
36.1% (68)
Women who did not give birth in the past 12 months Now married:
46.0% (1,329)Unmarried:
54.0% (1,558)
Marital status - Black or African American population 15 years and over
Males 16.7% Never married56.5% Now married0.0% Separated0.0% Widowed26.8% DivorcedFemales 42.5% Never married16.4% Now married0.0% Separated0.0% Widowed41.1% DivorcedWomen who did not give birth in the past 12 months Now married:
40.0% (13)Unmarried:
60.0% (19)
Marital status - American Indian / Alaska Native population 15 years and over
Males 74.4% Never married13.6% Now married0.0% Separated0.0% Widowed12.1% DivorcedFemales 20.2% Never married0.0% Now married0.0% Separated46.2% Widowed33.6% DivorcedWomen who did not give birth in the past 12 months Now married:
0.0% (0)Unmarried:
100.0% (26)
Marital status - Asian population 15 years and over
Males 0.0% Never married100.0% Now married0.0% Separated0.0% Widowed0.0% DivorcedFemales 0.0% Never married42.9% Now married0.0% Separated0.0% Widowed57.1% DivorcedWomen who did not give birth in the past 12 months Now married:
0.0% (0)Unmarried:
100.0% (8)
Marital status - Other race population 15 years and over
Males 50.2% Never married22.0% Now married0.0% Separated0.0% Widowed27.7% DivorcedFemales 6.7% Never married73.9% Now married0.0% Separated12.6% Widowed6.7% DivorcedWomen who did not give birth in the past 12 months Now married:
78.9% (82)Unmarried:
21.1% (22)
Marital status - Two or more races population 15 years and over
Males 55.3% Never married23.5% Now married0.0% Separated1.6% Widowed19.5% DivorcedFemales 48.6% Never married32.4% Now married0.0% Separated1.9% Widowed17.1% DivorcedWomen who gave birth in the past 12 months Now married:
100.0% (35)Unmarried:
0.0% (0)
Women who did not give birth in the past 12 months Now married:
22.5% (109)Unmarried:
77.5% (377)
Marital status - White alone, not Hispanic / Latino population 15 years and over
Males 26.6% Never married59.9% Now married1.4% Separated1.9% Widowed10.2% DivorcedFemales 21.1% Never married50.3% Now married0.6% Separated8.8% Widowed19.2% DivorcedWomen who gave birth in the past 12 months Now married:
63.9% (123)Unmarried:
36.1% (70)
Women who did not give birth in the past 12 months Now married:
46.6% (1,288)Unmarried:
53.4% (1,473)
Marital status - Hispanic or Latino population 15 years and over
Males 61.9% Never married32.1% Now married0.0% Separated0.0% Widowed6.0% DivorcedFemales 35.8% Never married44.7% Now married0.0% Separated5.5% Widowed14.0% DivorcedWomen who gave birth in the past 12 months Now married:
100.0% (9)Unmarried:
0.0% (0)
Women who did not give birth in the past 12 months Now married:
44.7% (179)Unmarried:
55.3% (222)
Ancestries in Dallas
1,000 13.8% American927 12.8% German876 12.1% English443 6.1% European408 5.6% Irish349 4.8% Norwegian276 3.8% Polish150 2.1% Scandinavian148 2.0% Swedish147 2.0% Dutch123 1.7% Italian68 0.9% Celtic64 0.9% Canadian56 0.8% Scottish47 0.6% French Canadian47 0.6% Welsh42 0.6% Northern European29 0.4% French25 0.3% Serbian25 0.3% Swiss24 0.3% Pennsylvania German17 0.2% Czech14 0.2% Czechoslovakian12 0.2% Portuguese11 0.2% Danish11 0.2% Ukrainian8 0.1% Luxembourger5 0.07% British5 0.07% Russian
Geographical mobility in Dallas Same house 1 year ago 11,011 81.6% White (Caucasian)166 73.6% Black or African American227 58.4% American Indian / Alaska Native22 100.0% Asian4 100.0% Native Hawaiian / Pacific Islander922 98.1% Other race1,357 81.8% Two or more races10,999 82.1% White alone, not Hispanic / Latino1,182 77.5% Hispanic or LatinoMoved within same county 1,137 8.4% White / Caucasian24 10.8% Black or African American89 22.8% American Indian / Alaska Native166 10.0% Two or more races1,113 8.3% White alone, not Hispanic / Latino191 12.5% Hispanic or LatinoMoved within same state 1,102 8.2% White / Caucasian13 3.3% American Indian / Alaska Native122 7.4% Two or more races1,084 8.1% White alone, not Hispanic / Latino97 6.3% Hispanic or LatinoMoved from different state 217 1.6% White / Caucasian29 12.7% Black or African American208 1.6% White alone, not Hispanic / LatinoMoved from abroad 29 0.2% White32 3.4% Other race29 0.2% White alone, not Hispanic / Latino37 2.4% Hispanic or Latino
Children Nativity (place of birth) in Dallas
Children under 6 years - Living with two parents Both parents native 554 100.0% NativeBoth parents foreign-born 13 100.0% NativeOne native, one foreign-born parent 113 100.0% NativeChildren under 6 years - Living with one parent Native parent 537 100.0% NativeChildren 6 to 17 years - Living with two parents Both parents native 1,072 100.0% NativeBoth parents foreign-born 136 100.0% NativeOne native, one foreign-born parent 279 100.0% NativeChildren 6 to 17 years - Living with one parent Native parent 583 100.0% NativeForeign-born parent 59 50.0% Native59 50.0% Foreign-born
Grandparents responsible for own grandchildren in Dallas
Grandparents (30 to 59 years) White / Caucasian 40 28.7% Responsible for grandchildren99 71.3% Not responsible for grandchildrenTwo or more races 3 100.0% Responsible for grandchildrenWhite alone, not Hispanic / Latino 41 26.7% Responsible for grandchildren114 73.3% Not responsible for grandchildrenGrandparents (60 years and over) White / Caucasian 5 4.9% Responsible for grandchildren103 95.1% Not responsible for grandchildrenTwo or more races 20 25.8% Responsible for grandchildren57 74.2% Not responsible for grandchildrenWhite alone, not Hispanic / Latino 6 4.8% Responsible for grandchildren109 95.2% Not responsible for grandchildren