Races in Harwich, Massachusetts (MA) Detailed Stats
Ancestries, Foreign-born residents, place of birth

Recent posts about races in Harwich, Massachusetts on our local forum with over 2,400,000 registered users:
 | 2023 Real Estate Observations (5278 replies) |
| MA 2022 Question 1 (258 replies) |
| 2021 Real Estate Observations (1729 replies) |
| Why is Boston so famous for its racism?! (1466 replies) |
| Big MA Ancestry Data Thread by Town (31 replies) |
| Shooting in Broad Daylight Main Street Hyannis (36 replies) |
Latest news about races in Harwich, MA collected exclusively by city-data.com from local newspapers, TV, and radio stations
3.0% of Harwich, MA residents are foreign-born (1.9% born in Europe, 0.4% born in Latin America, 0.4% born in Asia, 0.3% born in North America), which is 492.9% less than the foreign-born rate of 18.0% across the entire state of Massachusetts.
Race distribution in Harwich

- 11,73894.8%White alone
- 2351.9%Other race alone
- 1591.3%Two or more races
- 1191.0%Hispanic
- 850.7%Black alone
- 240.2%Asian alone
- 210.2%American Indian alone
- 50.04%Native Hawaiian and Other
Pacific Islander alone

2000
2022
-
- 5,198,35981.9%White alone
- 428,7296.8%Hispanic
- 318,3295.0%Black alone
- 236,7863.7%Asian alone
- 110,3381.7%Two or more races
- 43,5860.7%Other race alone
- 11,2640.2%American Indian alone
- 1,7060.03%Native Hawaiian and Other
Pacific Islander alone

-
- 4,676,62767.0%White alone
- 911,03813.0%Hispanic
- 501,4637.2%Asian alone
- 459,7406.6%Black alone
- 341,8894.9%Two or more races
- 84,4031.2%Other race alone
- 5,8380.08%American Indian alone
- 9760.01%Native Hawaiian and Other
Pacific Islander alone

Income and house value in Harwich
- Median household income in 2022
- $86,169White non-Hispanic householders
- $85,534Black householders
- $155,580American Indian and Alaska Native householders
- $81,055Asian householders
- $59,786Some other race householders
- $79,993Two or more races householders
- Median 2022 house value
- $654,396White Non-Hispanic householders
- $797,612Black or African American householders
- $523,942Some other race householders
- $493,810Two or more races householders
Household income for White non-Hispanic householders

Household income for Black householders

Household income for American Indian and Alaska Native householders

Household income for Asian householders

Household income for Two or more races householders

Foreign-born residents in Harwich
376 residents are foreign born (1.9% Europe, 0.4% Latin America, 0.4% Asia, 0.3% North America).
| This city: | 3.0% |
| Massachusetts: | 12.2% |
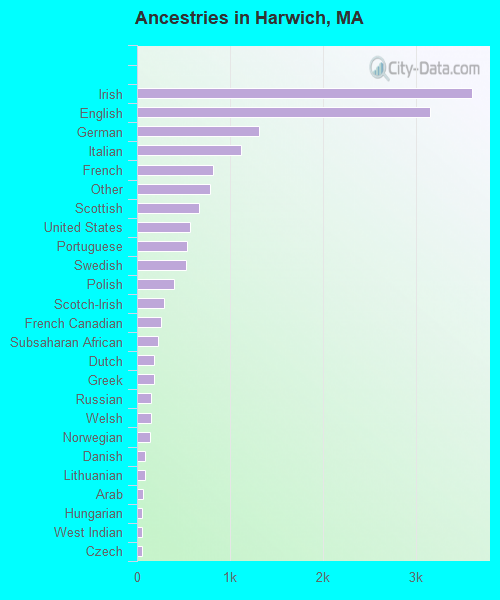
Ancestries in Harwich

- 3,60923.3%Irish
- 3,15920.4%English
- 1,3158.5%German
- 1,1187.2%Italian
- 8175.3%French
- 7905.1%Other
- 6684.3%Scottish
- 5703.7%United States
- 5383.5%Portuguese
- 5243.4%Swedish
- 3932.5%Polish
- 2861.8%Scotch-Irish
- 2591.7%French Canadian
- 2241.4%Subsaharan African
- 1841.2%Dutch
- 1821.2%Greek
- 1531.0%Russian
- 1521.0%Welsh
- 1450.9%Norwegian
- 890.6%Danish
- 890.6%Lithuanian
- 640.4%Arab
- 530.3%Hungarian
- 510.3%West Indian
- 500.3%Czech
- 140.09%Slovak
- 120.08%Swiss
- 90.06%Ukrainian
Zip codes: 02645.