Races in Keizer, Oregon (OR) Detailed Stats
Data:
Races - White alone (%)
Races - White alone (% change since 2000)
Races - Black alone (%)
Races - Black alone (% change since 2000)
Races - American Indian alone (%)
Races - American Indian alone (% change since 2000)
Races - Asian alone (%)
Races - Asian alone (% change since 2000)
Races - Hispanic (%)
Races - Hispanic (% change since 2000)
Races - Native Hawaiian and Other Pacific Islander alone (%)
Races - Native Hawaiian and Other Pacific Islander alone (% change since 2000)
Races - Two or more races(%)
Races - Two or more races(% change since 2000)
Races - Other race alone (%)
Races - Other race alone (% change since 2000)
Racial diversity
Place of birth - Born in state of residence (%)
Place of birth - Born in state of residence (%) - White
Place of birth - Born in state of residence (%) - Black or African American
Place of birth - Born in state of residence (%) - Asian
Place of birth - Born in state of residence (%) - Hispanic or Latino
Place of birth - Born in state of residence (%) - American Indian and Alaska Native
Place of birth - Born in state of residence (%) - Multirace
Place of birth - Born in state of residence (%) - Other Race
Place of birth - Born in other state (%)
Place of birth - Born in other state (%) - White
Place of birth - Born in other state (%) - Black or African American
Place of birth - Born in other state (%) - Asian
Place of birth - Born in other state (%) - Hispanic or Latino
Place of birth - Born in other state (%) - American Indian and Alaska Native
Place of birth - Born in other state (%) - Multirace
Place of birth - Born in other state (%) - Other Race
Place of birth - Native, outside of US (%)
Place of birth - Native, outside of US (%) - White
Place of birth - Native, outside of US (%) - Black or African American
Place of birth - Native, outside of US (%) - Asian
Place of birth - Native, outside of US (%) - Hispanic or Latino
Place of birth - Native, outside of US (%) - American Indian and Alaska Native
Place of birth - Native, outside of US (%) - Multirace
Place of birth - Native, outside of US (%) - Other Race
Place of birth - Foreign born (%)
Place of birth - Foreign born (%) - White
Place of birth - Foreign born (%) - Black or African American
Place of birth - Foreign born (%) - Asian
Place of birth - Foreign born (%) - Hispanic or Latino
Place of birth - Foreign born (%) - American Indian and Alaska Native
Place of birth - Foreign born (%) - Multirace
Place of birth - Foreign born (%) - Other Race
Residents speaking English at home (%)
Residents speaking English at home - Born in the United States (%)
Residents speaking English at home - Native, born elsewhere (%)
Residents speaking English at home - Foreign born (%)
Residents speaking Spanish at home (%)
Residents speaking Spanish at home - Born in the United States (%)
Residents speaking Spanish at home - Native, born elsewhere (%)
Residents speaking Spanish at home - Foreign born (%)
Residents speaking other language at home (%)
Residents speaking other language at home - Born in the United States (%)
Residents speaking other language at home - Native, born elsewhere (%)
Residents speaking other language at home - Foreign born (%)
Marital status - Never married (%)
Marital status - Now married (%)
Marital status - Separated (%)
Marital status - Widowed (%)
Marital status - Divorced (%)
Ancestries Reported - Arab (%)
Ancestries Reported - Czech (%)
Ancestries Reported - Danish (%)
Ancestries Reported - Dutch (%)
Ancestries Reported - English (%)
Ancestries Reported - French (%)
Ancestries Reported - French Canadian (%)
Ancestries Reported - German (%)
Ancestries Reported - Greek (%)
Ancestries Reported - Hungarian (%)
Ancestries Reported - Irish (%)
Ancestries Reported - Italian (%)
Ancestries Reported - Lithuanian (%)
Ancestries Reported - Norwegian (%)
Ancestries Reported - Polish (%)
Ancestries Reported - Portuguese (%)
Ancestries Reported - Russian (%)
Ancestries Reported - Scotch-Irish (%)
Ancestries Reported - Scottish (%)
Ancestries Reported - Slovak (%)
Ancestries Reported - Subsaharan African (%)
Ancestries Reported - Swedish (%)
Ancestries Reported - Swiss (%)
Ancestries Reported - Ukrainian (%)
Ancestries Reported - United States (%)
Ancestries Reported - Welsh (%)
Ancestries Reported - West Indian (%)
Ancestries Reported - Other (%)
Geographical mobility - Same house 1 year ago (%)
Geographical mobility - Same house 1 year ago (%) - White
Geographical mobility - Same house 1 year ago (%) - Black or African American
Geographical mobility - Same house 1 year ago (%) - Asian
Geographical mobility - Same house 1 year ago (%) - Hispanic or Latino
Geographical mobility - Same house 1 year ago (%) - American Indian and Alaska Native
Geographical mobility - Same house 1 year ago (%) - Multirace
Geographical mobility - Same house 1 year ago (%) - Other Race
Geographical mobility - Moved within same county (%)
Geographical mobility - Moved within same county (%) - White
Geographical mobility - Moved within same county (%) - Black or African American
Geographical mobility - Moved within same county (%) - Asian
Geographical mobility - Moved within same county (%) - Hispanic or Latino
Geographical mobility - Moved within same county (%) - American Indian and Alaska Native
Geographical mobility - Moved within same county (%) - Multirace
Geographical mobility - Moved within same county (%) - Other Race
Geographical mobility - Moved from different county within same state (%)
Geographical mobility - Moved from different county within same state (%) - White
Geographical mobility - Moved from different county within same state (%) - Black or African American
Geographical mobility - Moved from different county within same state (%) - Asian
Geographical mobility - Moved from different county within same state (%) - Hispanic or Latino
Geographical mobility - Moved from different county within same state (%) - American Indian and Alaska Native
Geographical mobility - Moved from different county within same state (%) - Multirace
Geographical mobility - Moved from different county within same state (%) - Other Race
Geographical mobility - Moved from different state (%)
Geographical mobility - Moved from different state (%) - White
Geographical mobility - Moved from different state (%) - Black or African American
Geographical mobility - Moved from different state (%) - Asian
Geographical mobility - Moved from different state (%) - Hispanic or Latino
Geographical mobility - Moved from different state (%) - American Indian and Alaska Native
Geographical mobility - Moved from different state (%) - Multirace
Geographical mobility - Moved from different state (%) - Other Race
Geographical mobility - Moved from abroad (%)
Geographical mobility - Moved from abroad (%) - White
Geographical mobility - Moved from abroad (%) - Black or African American
Geographical mobility - Moved from abroad (%) - Asian
Geographical mobility - Moved from abroad (%) - Hispanic or Latino
Geographical mobility - Moved from abroad (%) - American Indian and Alaska Native
Geographical mobility - Moved from abroad (%) - Multirace
Geographical mobility - Moved from abroad (%) - Other Race
Place of birth for the foreign-born population - Ireland (%)
Place of birth for the foreign-born population - Denmark (%)
Place of birth for the foreign-born population - Norway (%)
Place of birth for the foreign-born population - Sweden (%)
Place of birth for the foreign-born population - United Kingdom (%)
Place of birth for the foreign-born population - England (%)
Place of birth for the foreign-born population - Scotland (%)
Place of birth for the foreign-born population - Other Northern Europe (%)
Place of birth for the foreign-born population - Austria (%)
Place of birth for the foreign-born population - Belgium (%)
Place of birth for the foreign-born population - France (%)
Place of birth for the foreign-born population - Germany (%)
Place of birth for the foreign-born population - Netherlands (%)
Place of birth for the foreign-born population - Switzerland (%)
Place of birth for the foreign-born population - Other Western Europe (%)
Place of birth for the foreign-born population - Greece (%)
Place of birth for the foreign-born population - Italy (%)
Place of birth for the foreign-born population - Portugal (%)
Place of birth for the foreign-born population - Spain (%)
Place of birth for the foreign-born population - Other Southern Europe (%)
Place of birth for the foreign-born population - Albania (%)
Place of birth for the foreign-born population - Belarus (%)
Place of birth for the foreign-born population - Bosnia and Herzegovina (%)
Place of birth for the foreign-born population - Bulgaria (%)
Place of birth for the foreign-born population - Croatia (%)
Place of birth for the foreign-born population - Czechoslovakia (%)
Place of birth for the foreign-born population - Hungary (%)
Place of birth for the foreign-born population - Latvia (%)
Place of birth for the foreign-born population - Lithuania (%)
Place of birth for the foreign-born population - North Macedonia (Macedonia) (%)
Place of birth for the foreign-born population - Moldova (%)
Place of birth for the foreign-born population - Poland (%)
Place of birth for the foreign-born population - Romania (%)
Place of birth for the foreign-born population - Russia (%)
Place of birth for the foreign-born population - Serbia (%)
Place of birth for the foreign-born population - Ukraine (%)
Place of birth for the foreign-born population - Other Eastern Europe (%)
Place of birth for the foreign-born population - China (%)
Place of birth for the foreign-born population - Hong Kong (%)
Place of birth for the foreign-born population - Taiwan (%)
Place of birth for the foreign-born population - Japan (%)
Place of birth for the foreign-born population - Korea (%)
Place of birth for the foreign-born population - Other Eastern Asia (%)
Place of birth for the foreign-born population - Afghanistan (%)
Place of birth for the foreign-born population - Bangladesh (%)
Place of birth for the foreign-born population - India (%)
Place of birth for the foreign-born population - Iran (%)
Place of birth for the foreign-born population - Kazakhstan (%)
Place of birth for the foreign-born population - Nepal (%)
Place of birth for the foreign-born population - Pakistan (%)
Place of birth for the foreign-born population - Sri Lanka (%)
Place of birth for the foreign-born population - Uzbekistan (%)
Place of birth for the foreign-born population - Other South Central Asia (%)
Place of birth for the foreign-born population - Burma (%)
Place of birth for the foreign-born population - Cambodia (%)
Place of birth for the foreign-born population - Indonesia (%)
Place of birth for the foreign-born population - Laos (%)
Place of birth for the foreign-born population - Malaysia (%)
Place of birth for the foreign-born population - Philippines (%)
Place of birth for the foreign-born population - Singapore (%)
Place of birth for the foreign-born population - Thailand (%)
Place of birth for the foreign-born population - Vietnam (%)
Place of birth for the foreign-born population - Other South Eastern Asia (%)
Place of birth for the foreign-born population - Armenia (%)
Place of birth for the foreign-born population - Iraq (%)
Place of birth for the foreign-born population - Israel (%)
Place of birth for the foreign-born population - Jordan (%)
Place of birth for the foreign-born population - Kuwait (%)
Place of birth for the foreign-born population - Lebanon (%)
Place of birth for the foreign-born population - Saudi Arabia (%)
Place of birth for the foreign-born population - Syria (%)
Place of birth for the foreign-born population - Turkey (%)
Place of birth for the foreign-born population - Yemen (%)
Place of birth for the foreign-born population - Other Western Asia (%)
Place of birth for the foreign-born population - Eritrea (%)
Place of birth for the foreign-born population - Ethiopia (%)
Place of birth for the foreign-born population - Kenya (%)
Place of birth for the foreign-born population - Somalia (%)
Place of birth for the foreign-born population - Uganda (%)
Place of birth for the foreign-born population - Zimbabwe (%)
Place of birth for the foreign-born population - Other Eastern Africa (%)
Place of birth for the foreign-born population - Cameroon (%)
Place of birth for the foreign-born population - Congo (%)
Place of birth for the foreign-born population - Democratic Republic of Congo (Zaire) (%)
Place of birth for the foreign-born population - Other Middle Africa (%)
Place of birth for the foreign-born population - Egypt (%)
Place of birth for the foreign-born population - Morocco (%)
Place of birth for the foreign-born population - Sudan (%)
Place of birth for the foreign-born population - Other Northern Africa (%)
Place of birth for the foreign-born population - South Africa (%)
Place of birth for the foreign-born population - Other Southern Africa (%)
Place of birth for the foreign-born population - Cabo Verde (%)
Place of birth for the foreign-born population - Ghana (%)
Place of birth for the foreign-born population - Liberia (%)
Place of birth for the foreign-born population - Nigeria (%)
Place of birth for the foreign-born population - Senegal (%)
Place of birth for the foreign-born population - Sierra Leone (%)
Place of birth for the foreign-born population - Other Western Africa (%)
Place of birth for the foreign-born population - Australia (%)
Place of birth for the foreign-born population - New Zealand (%)
Place of birth for the foreign-born population - Fiji (%)
Place of birth for the foreign-born population - Micronesia (%)
Place of birth for the foreign-born population - Bahamas (%)
Place of birth for the foreign-born population - Barbados (%)
Place of birth for the foreign-born population - Cuba (%)
Place of birth for the foreign-born population - Dominica (%)
Place of birth for the foreign-born population - Dominican Republic (%)
Place of birth for the foreign-born population - Grenada (%)
Place of birth for the foreign-born population - Haiti (%)
Place of birth for the foreign-born population - Jamaica (%)
Place of birth for the foreign-born population - St. Vincent and the Grenadines (%)
Place of birth for the foreign-born population - Trinidad and Tobago (%)
Place of birth for the foreign-born population - West Indies (%)
Place of birth for the foreign-born population - Other Caribbean (%)
Place of birth for the foreign-born population - Belize (%)
Place of birth for the foreign-born population - Costa Rica (%)
Place of birth for the foreign-born population - El Salvador (%)
Place of birth for the foreign-born population - Guatemala (%)
Place of birth for the foreign-born population - Honduras (%)
Place of birth for the foreign-born population - Mexico (%)
Place of birth for the foreign-born population - Nicaragua (%)
Place of birth for the foreign-born population - Panama (%)
Place of birth for the foreign-born population - Other Central America (%)
Place of birth for the foreign-born population - Argentina (%)
Place of birth for the foreign-born population - Bolivia (%)
Place of birth for the foreign-born population - Brazil (%)
Place of birth for the foreign-born population - Chile (%)
Place of birth for the foreign-born population - Colombia (%)
Place of birth for the foreign-born population - Ecuador (%)
Place of birth for the foreign-born population - Guyana (%)
Place of birth for the foreign-born population - Peru (%)
Place of birth for the foreign-born population - Uruguay (%)
Place of birth for the foreign-born population - Venezuela (%)
Place of birth for the foreign-born population - Other South America (%)
Place of birth for the foreign-born population - Canada (%)
Place of birth for the foreign-born population - Other Northern America (%)
Place of birth for the foreign-born population - Other (%)
Latest news about races in Keizer, OR collected exclusively by city-data.com from local newspapers, TV, and radio stations
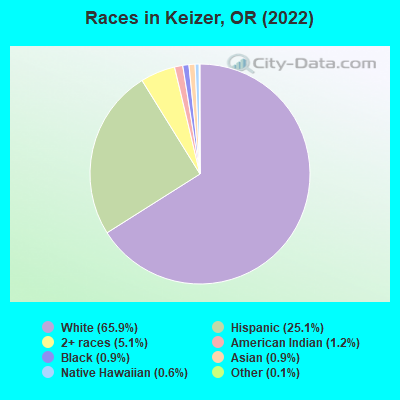
According to 2022 data, the most numerous races in Keizer, OR are White alone (25,844 residents), Hispanic (9,853 residents), and Two or more races (1,998 residents). 81.9% of Keizer residents speak English at home. 10.1% of Keizer, OR residents are foreign-born (6.5% born in Latin America, 1.4% born in Europe, 1.2% born in Asia), which is 11.0% greater than the foreign-born rate of 9.0% across the entire state of Oregon.
Race distribution in Keizer
2000 2022
2,857,616 83.5% White alone 275,314 8.0% Hispanic 100,333 2.9% Asian alone 82,733 2.4% Two or more races 53,325 1.6% Black alone 40,130 1.2% American Indian alone 7,398 0.2% Native Hawaiian and Other 4,550 0.1% Other race alone
3,037,571 71.6% White alone 609,538 14.4% Hispanic 252,744 6.0% Two or more races 191,283 4.5% Asian alone 78,228 1.8% Black alone 29,399 0.7% American Indian alone 25,731 0.6% Other race alone 15,643 0.4% Native Hawaiian and Other
Income and house value in Keizer Median household income in 2022 $81,330 White non-Hispanic householders$70,354 Black householders$127,337 American Indian and Alaska Native householders$88,980 Some other race householders$48,031 Two or more races householders$58,989 Hispanic or Latino race householdersMedian 2022 house value $421,680 White Non-Hispanic householders$566,613 Black or African American householders$416,493 American Indian or Alaska Native householders $438,767 Asian householders$421,680 Native Hawaiian and other Pacific Islander householders$380,488 Some other race householders$367,368 Two or more races householders$369,504 Hispanic or Latino householders
Median age by race in Keizer
40.5 Median age for White residents40.5 41.3 36.7 Median age for Black or African American residents33.2 103.7 37.1 Median age for American Indian / Alaska Native residents31.6 38.8 56.9 Median age for Asian residents45.2 56.4 43.6 Median age for Native Hawaiian / Pacific Islander residents75.7 38.6 32.8 Median age for Other race residents33.1 29.4 21.8 Median age for Two or more races residents24.7 19.0 42.0 Median age for White alone residents40.6 43.2 25.2 Median age for Hispanic or Latino residents26.5 24.5
Owner/renter occupied households by race in Keizer
House owners and renters - White residents 7,908 69.0% Owner occupied3,554 31.0% Renter occupiedHouse owners and renters - Black or African American residents 21 31.6% Owner occupied46 68.4% Renter occupiedHouse owners and renters - American Indian / Alaska Native residents 63 29.4% Owner occupied151 70.6% Renter occupiedHouse owners and renters - Asian residents 49 40.3% Owner occupied73 59.7% Renter occupiedHouse owners and renters - Native Hawaiian / Pacific Islander residents 19 26.0% Owner occupied53 74.0% Renter occupiedHouse owners and renters - Other race residents 513 51.7% Owner occupied479 48.3% Renter occupiedHouse owners and renters - Two or more races residents 709 44.3% Owner occupied891 55.7% Renter occupiedHouse owners and renters - White alone residents 7,708 69.5% Owner occupied3,387 30.5% Renter occupiedHouse owners and renters - Hispanic or Latino residents 1,362 52.6% Owner occupied1,227 47.4% Renter occupied
Language usage in Keizer
English speakers - Total 81.9% of residents of Keizer speak English at home.
13.9% of residents speak Spanish at home 2,794 54.5% Speak English very well2,331 45.5% Speak English less than very well3.9% of residents speak other language at home 684 47.9% Speak English very well743 52.1% Speak English less than very well
English speakers - Born in the United States 92.6% of residents of Keizer speak English at home.
5.6% of residents speak Spanish at home 641 90.2% Speak English very well70 9.8% Speak English less than very well2.1% of residents speak other language at home 200 74.1% Speak English very well70 25.9% Speak English less than very well
All residents speak only English at home
English speakers - Foreign-born 20.4% of residents of Keizer speak English at home.
57.7% of residents speak Spanish at home 765 29.8% Speak English very well1,804 70.2% Speak English less than very well21.1% of residents speak other language at home 313 33.2% Speak English very well629 66.8% Speak English less than very well
White (Caucasian) - Speak only English Native:
99.3% (24,722)Foreign-born:
53.4% (394)
White (Caucasian) - Speak another language Native:
2.2% (558)Foreign-born:
56.3% (416)
Black or African American - Speak only English Native:
80.8% (158)Foreign-born:
5.0% (7)
American Indian / Alaska Native - Speak only English Native:
96.5% (384)Foreign-born:
34.2% (41)
American Indian / Alaska Native - Speak another language Native:
3.6% (15)Foreign-born:
61.4% (74)
Asian - Speak only English Native:
100.0% (110)Foreign-born:
69.1% (209)
Asian - Speak another language Native:
40.2% (44)Foreign-born:
52.1% (158)
Native Hawaiian / Pacific Islander - Speak another language Native:
100.0% (64)Foreign-born:
87.5% (184)
Other race - Speak only English Native:
38.3% (607)Foreign-born:
10.9% (158)
Other race - Speak another language Native:
63.0% (997)Foreign-born:
88.7% (1,291)
Two or more races - Speak only English Native:
68.4% (3,206)Foreign-born:
9.7% (149)
Two or more races - Speak another language Native:
31.2% (1,464)Foreign-born:
89.9% (1,382)
White alone - Speak only English Native:
98.9% (23,830)Foreign-born:
50.4% (449)
White alone - Speak another language Native:
1.4% (330)Foreign-born:
48.1% (428)
Hispanic or Latino - Speak only English Native:
55.2% (3,025)Foreign-born:
8.9% (262)
Hispanic or Latino - Speak another language Native:
45.6% (2,495)Foreign-born:
90.2% (2,641)
Foreign-born residents in Keizer 3,967 residents are foreign born (6.5% Latin America , 1.4% Europe , 1.2% Asia ).
This city:
10.1%Oregon:
9.8%
Marital status for residents in Keizer Marital status - White (Caucasian) population 15 years and over
Males 27.1% Never married55.5% Now married1.0% Separated3.1% Widowed13.2% DivorcedFemales 25.1% Never married47.1% Now married2.4% Separated8.4% Widowed17.0% DivorcedWomen who gave birth in the past 12 months Now married:
83.3% (171)Unmarried:
16.7% (34)
Women who did not give birth in the past 12 months Now married:
48.2% (2,906)Unmarried:
51.8% (3,121)
Marital status - Black or African American population 15 years and over
Males 29.9% Never married56.0% Now married0.0% Separated0.0% Widowed14.1% DivorcedFemales 0.0% Never married41.7% Now married0.0% Separated0.0% Widowed58.3% DivorcedWomen who did not give birth in the past 12 months Now married:
100.0% (11)Unmarried:
0.0% (0)
Marital status - American Indian / Alaska Native population 15 years and over
Males 72.2% Never married18.3% Now married0.0% Separated0.0% Widowed9.5% DivorcedFemales 14.7% Never married73.1% Now married2.8% Separated0.0% Widowed9.4% DivorcedWomen who did not give birth in the past 12 months Now married:
91.0% (155)Unmarried:
9.0% (15)
Marital status - Asian population 15 years and over
Males 48.5% Never married51.5% Now married0.0% Separated0.0% Widowed0.0% DivorcedFemales 21.2% Never married44.7% Now married6.2% Separated12.8% Widowed15.0% DivorcedWomen who did not give birth in the past 12 months Now married:
48.1% (43)Unmarried:
51.9% (47)
Marital status - Native Hawaiian / Pacific Islander population 15 years and over
Males 22.4% Never married0.0% Now married40.0% Separated0.0% Widowed37.6% DivorcedFemales 100.0% Never married0.0% Now married0.0% Separated0.0% Widowed0.0% DivorcedWomen who did not give birth in the past 12 months Now married:
0.0% (0)Unmarried:
100.0% (76)
Marital status - Other race population 15 years and over
Males 56.0% Never married37.1% Now married3.1% Separated0.0% Widowed3.7% DivorcedFemales 56.0% Never married30.0% Now married2.4% Separated1.2% Widowed10.3% DivorcedWomen who gave birth in the past 12 months Now married:
22.1% (42)Unmarried:
77.9% (147)
Women who did not give birth in the past 12 months Now married:
18.0% (220)Unmarried:
82.0% (1,000)
Marital status - Two or more races population 15 years and over
Males 61.7% Never married32.0% Now married0.5% Separated1.7% Widowed4.0% DivorcedFemales 53.3% Never married29.9% Now married1.6% Separated0.6% Widowed14.6% DivorcedWomen who gave birth in the past 12 months Now married:
100.0% (63)Unmarried:
0.0% (0)
Women who did not give birth in the past 12 months Now married:
24.7% (405)Unmarried:
75.3% (1,236)
Marital status - White alone, not Hispanic / Latino population 15 years and over
Males 25.4% Never married56.5% Now married1.1% Separated2.9% Widowed14.1% DivorcedFemales 24.3% Never married46.9% Now married2.6% Separated8.9% Widowed17.3% DivorcedWomen who gave birth in the past 12 months Now married:
81.3% (142)Unmarried:
18.7% (33)
Women who did not give birth in the past 12 months Now married:
48.7% (2,830)Unmarried:
51.3% (2,986)
Marital status - Hispanic or Latino population 15 years and over
Males 56.8% Never married37.0% Now married1.5% Separated1.9% Widowed2.8% DivorcedFemales 48.1% Never married34.6% Now married2.2% Separated1.1% Widowed14.0% DivorcedWomen who gave birth in the past 12 months Now married:
53.4% (131)Unmarried:
46.6% (115)
Women who did not give birth in the past 12 months Now married:
28.8% (792)Unmarried:
71.2% (1,957)
Ancestries in Keizer
1,634 8.7% English1,554 8.3% German1,281 6.9% European1,050 5.6% American896 4.8% Irish581 3.1% Norwegian365 2.0% Italian330 1.8% French290 1.6% Scottish165 0.9% Russian157 0.8% Dutch124 0.7% French Canadian108 0.6% Polish99 0.5% Croatian93 0.5% Scandinavian87 0.5% Swedish83 0.4% Swiss76 0.4% Armenian73 0.4% Canadian70 0.4% Hungarian63 0.3% Eastern European60 0.3% Scotch-Irish54 0.3% Northern European53 0.3% British50 0.3% Ukrainian47 0.3% Basque45 0.2% Arab37 0.2% Czech32 0.2% Belgian26 0.1% Welsh23 0.1% Portuguese21 0.1% Icelander18 0.10% Romanian16 0.09% Australian14 0.07% Austrian14 0.07% Finnish12 0.06% Greek10 0.05% Jamaican2 0.01% Brazilian
Geographical mobility in Keizer Same house 1 year ago 23,075 87.1% White (Caucasian)216 66.6% Black or African American436 87.6% American Indian / Alaska Native427 89.4% Asian20 8.9% Native Hawaiian / Pacific Islander3,087 90.7% Other race5,929 82.9% Two or more races22,448 87.0% White alone, not Hispanic / Latino8,469 88.4% Hispanic or LatinoMoved within same county 1,939 7.3% White / Caucasian97 29.8% Black or African American35 7.0% American Indian / Alaska Native9 1.9% Asian167 75.0% Native Hawaiian / Pacific Islander166 4.9% Other race565 7.9% Two or more races1,908 7.4% White alone, not Hispanic / Latino539 5.6% Hispanic or LatinoMoved within same state 1,129 4.3% White / Caucasian16 3.2% American Indian / Alaska Native59 12.4% Asian102 3.0% Other race470 6.6% Two or more races1,132 4.4% White alone, not Hispanic / Latino573 6.0% Hispanic or LatinoMoved from different state 265 1.0% White / Caucasian11 3.3% Black or African American33 1.0% Other race68 0.9% Two or more races262 1.0% White alone, not Hispanic / Latino57 0.6% Hispanic or LatinoMoved from abroad 16 0.1% White13 0.1% White alone, not Hispanic / Latino
Children Nativity (place of birth) in Keizer
Children under 6 years - Living with two parents Both parents native 1,065 100.0% NativeBoth parents foreign-born 259 89.1% Native32 10.9% Foreign-bornOne native, one foreign-born parent 226 100.0% NativeChildren under 6 years - Living with one parent Native parent 684 100.0% NativeForeign-born parent 139 100.0% NativeChildren 6 to 17 years - Living with two parents Both parents native 3,298 96.7% Native113 3.3% Foreign-bornBoth parents foreign-born 481 95.4% Native23 4.6% Foreign-bornOne native, one foreign-born parent 337 95.1% Native17 4.9% Foreign-bornChildren 6 to 17 years - Living with one parent Native parent 1,108 100.0% NativeForeign-born parent 761 58.6% Native537 41.4% Foreign-born
Grandparents responsible for own grandchildren in Keizer
Grandparents (30 to 59 years) White / Caucasian 66 34.9% Responsible for grandchildren124 65.1% Not responsible for grandchildrenAmerican Indian / Alaska Native 1 4.1% Responsible for grandchildren18 95.9% Not responsible for grandchildrenNative Hawaiian / Pacific Islander 31 100.0% Not responsible for grandchildrenOther race 71 55.8% Responsible for grandchildren56 44.2% Not responsible for grandchildrenWhite alone, not Hispanic / Latino 82 29.5% Responsible for grandchildren196 70.5% Not responsible for grandchildrenHispanic or Latino 47 43.1% Responsible for grandchildren63 56.9% Not responsible for grandchildrenGrandparents (60 years and over) White / Caucasian 55 29.4% Responsible for grandchildren133 70.6% Not responsible for grandchildrenAmerican Indian / Alaska Native 30 100.0% Not responsible for grandchildrenOther race 101 100.0% Not responsible for grandchildrenWhite alone, not Hispanic / Latino 58 28.4% Responsible for grandchildren146 71.6% Not responsible for grandchildrenHispanic or Latino 213 100.0% Not responsible for grandchildren