Races in La Vergne, Tennessee (TN) Detailed Stats
Data:
Races - White alone (%)
Races - White alone (% change since 2000)
Races - Black alone (%)
Races - Black alone (% change since 2000)
Races - American Indian alone (%)
Races - American Indian alone (% change since 2000)
Races - Asian alone (%)
Races - Asian alone (% change since 2000)
Races - Hispanic (%)
Races - Hispanic (% change since 2000)
Races - Native Hawaiian and Other Pacific Islander alone (%)
Races - Native Hawaiian and Other Pacific Islander alone (% change since 2000)
Races - Two or more races(%)
Races - Two or more races(% change since 2000)
Races - Other race alone (%)
Races - Other race alone (% change since 2000)
Racial diversity
Place of birth - Born in state of residence (%)
Place of birth - Born in state of residence (%) - White
Place of birth - Born in state of residence (%) - Black or African American
Place of birth - Born in state of residence (%) - Asian
Place of birth - Born in state of residence (%) - Hispanic or Latino
Place of birth - Born in state of residence (%) - American Indian and Alaska Native
Place of birth - Born in state of residence (%) - Multirace
Place of birth - Born in state of residence (%) - Other Race
Place of birth - Born in other state (%)
Place of birth - Born in other state (%) - White
Place of birth - Born in other state (%) - Black or African American
Place of birth - Born in other state (%) - Asian
Place of birth - Born in other state (%) - Hispanic or Latino
Place of birth - Born in other state (%) - American Indian and Alaska Native
Place of birth - Born in other state (%) - Multirace
Place of birth - Born in other state (%) - Other Race
Place of birth - Native, outside of US (%)
Place of birth - Native, outside of US (%) - White
Place of birth - Native, outside of US (%) - Black or African American
Place of birth - Native, outside of US (%) - Asian
Place of birth - Native, outside of US (%) - Hispanic or Latino
Place of birth - Native, outside of US (%) - American Indian and Alaska Native
Place of birth - Native, outside of US (%) - Multirace
Place of birth - Native, outside of US (%) - Other Race
Place of birth - Foreign born (%)
Place of birth - Foreign born (%) - White
Place of birth - Foreign born (%) - Black or African American
Place of birth - Foreign born (%) - Asian
Place of birth - Foreign born (%) - Hispanic or Latino
Place of birth - Foreign born (%) - American Indian and Alaska Native
Place of birth - Foreign born (%) - Multirace
Place of birth - Foreign born (%) - Other Race
Residents speaking English at home (%)
Residents speaking English at home - Born in the United States (%)
Residents speaking English at home - Native, born elsewhere (%)
Residents speaking English at home - Foreign born (%)
Residents speaking Spanish at home (%)
Residents speaking Spanish at home - Born in the United States (%)
Residents speaking Spanish at home - Native, born elsewhere (%)
Residents speaking Spanish at home - Foreign born (%)
Residents speaking other language at home (%)
Residents speaking other language at home - Born in the United States (%)
Residents speaking other language at home - Native, born elsewhere (%)
Residents speaking other language at home - Foreign born (%)
Marital status - Never married (%)
Marital status - Now married (%)
Marital status - Separated (%)
Marital status - Widowed (%)
Marital status - Divorced (%)
Ancestries Reported - Arab (%)
Ancestries Reported - Czech (%)
Ancestries Reported - Danish (%)
Ancestries Reported - Dutch (%)
Ancestries Reported - English (%)
Ancestries Reported - French (%)
Ancestries Reported - French Canadian (%)
Ancestries Reported - German (%)
Ancestries Reported - Greek (%)
Ancestries Reported - Hungarian (%)
Ancestries Reported - Irish (%)
Ancestries Reported - Italian (%)
Ancestries Reported - Lithuanian (%)
Ancestries Reported - Norwegian (%)
Ancestries Reported - Polish (%)
Ancestries Reported - Portuguese (%)
Ancestries Reported - Russian (%)
Ancestries Reported - Scotch-Irish (%)
Ancestries Reported - Scottish (%)
Ancestries Reported - Slovak (%)
Ancestries Reported - Subsaharan African (%)
Ancestries Reported - Swedish (%)
Ancestries Reported - Swiss (%)
Ancestries Reported - Ukrainian (%)
Ancestries Reported - United States (%)
Ancestries Reported - Welsh (%)
Ancestries Reported - West Indian (%)
Ancestries Reported - Other (%)
Geographical mobility - Same house 1 year ago (%)
Geographical mobility - Same house 1 year ago (%) - White
Geographical mobility - Same house 1 year ago (%) - Black or African American
Geographical mobility - Same house 1 year ago (%) - Asian
Geographical mobility - Same house 1 year ago (%) - Hispanic or Latino
Geographical mobility - Same house 1 year ago (%) - American Indian and Alaska Native
Geographical mobility - Same house 1 year ago (%) - Multirace
Geographical mobility - Same house 1 year ago (%) - Other Race
Geographical mobility - Moved within same county (%)
Geographical mobility - Moved within same county (%) - White
Geographical mobility - Moved within same county (%) - Black or African American
Geographical mobility - Moved within same county (%) - Asian
Geographical mobility - Moved within same county (%) - Hispanic or Latino
Geographical mobility - Moved within same county (%) - American Indian and Alaska Native
Geographical mobility - Moved within same county (%) - Multirace
Geographical mobility - Moved within same county (%) - Other Race
Geographical mobility - Moved from different county within same state (%)
Geographical mobility - Moved from different county within same state (%) - White
Geographical mobility - Moved from different county within same state (%) - Black or African American
Geographical mobility - Moved from different county within same state (%) - Asian
Geographical mobility - Moved from different county within same state (%) - Hispanic or Latino
Geographical mobility - Moved from different county within same state (%) - American Indian and Alaska Native
Geographical mobility - Moved from different county within same state (%) - Multirace
Geographical mobility - Moved from different county within same state (%) - Other Race
Geographical mobility - Moved from different state (%)
Geographical mobility - Moved from different state (%) - White
Geographical mobility - Moved from different state (%) - Black or African American
Geographical mobility - Moved from different state (%) - Asian
Geographical mobility - Moved from different state (%) - Hispanic or Latino
Geographical mobility - Moved from different state (%) - American Indian and Alaska Native
Geographical mobility - Moved from different state (%) - Multirace
Geographical mobility - Moved from different state (%) - Other Race
Geographical mobility - Moved from abroad (%)
Geographical mobility - Moved from abroad (%) - White
Geographical mobility - Moved from abroad (%) - Black or African American
Geographical mobility - Moved from abroad (%) - Asian
Geographical mobility - Moved from abroad (%) - Hispanic or Latino
Geographical mobility - Moved from abroad (%) - American Indian and Alaska Native
Geographical mobility - Moved from abroad (%) - Multirace
Geographical mobility - Moved from abroad (%) - Other Race
Place of birth for the foreign-born population - Ireland (%)
Place of birth for the foreign-born population - Denmark (%)
Place of birth for the foreign-born population - Norway (%)
Place of birth for the foreign-born population - Sweden (%)
Place of birth for the foreign-born population - United Kingdom (%)
Place of birth for the foreign-born population - England (%)
Place of birth for the foreign-born population - Scotland (%)
Place of birth for the foreign-born population - Other Northern Europe (%)
Place of birth for the foreign-born population - Austria (%)
Place of birth for the foreign-born population - Belgium (%)
Place of birth for the foreign-born population - France (%)
Place of birth for the foreign-born population - Germany (%)
Place of birth for the foreign-born population - Netherlands (%)
Place of birth for the foreign-born population - Switzerland (%)
Place of birth for the foreign-born population - Other Western Europe (%)
Place of birth for the foreign-born population - Greece (%)
Place of birth for the foreign-born population - Italy (%)
Place of birth for the foreign-born population - Portugal (%)
Place of birth for the foreign-born population - Spain (%)
Place of birth for the foreign-born population - Other Southern Europe (%)
Place of birth for the foreign-born population - Albania (%)
Place of birth for the foreign-born population - Belarus (%)
Place of birth for the foreign-born population - Bosnia and Herzegovina (%)
Place of birth for the foreign-born population - Bulgaria (%)
Place of birth for the foreign-born population - Croatia (%)
Place of birth for the foreign-born population - Czechoslovakia (%)
Place of birth for the foreign-born population - Hungary (%)
Place of birth for the foreign-born population - Latvia (%)
Place of birth for the foreign-born population - Lithuania (%)
Place of birth for the foreign-born population - North Macedonia (Macedonia) (%)
Place of birth for the foreign-born population - Moldova (%)
Place of birth for the foreign-born population - Poland (%)
Place of birth for the foreign-born population - Romania (%)
Place of birth for the foreign-born population - Russia (%)
Place of birth for the foreign-born population - Serbia (%)
Place of birth for the foreign-born population - Ukraine (%)
Place of birth for the foreign-born population - Other Eastern Europe (%)
Place of birth for the foreign-born population - China (%)
Place of birth for the foreign-born population - Hong Kong (%)
Place of birth for the foreign-born population - Taiwan (%)
Place of birth for the foreign-born population - Japan (%)
Place of birth for the foreign-born population - Korea (%)
Place of birth for the foreign-born population - Other Eastern Asia (%)
Place of birth for the foreign-born population - Afghanistan (%)
Place of birth for the foreign-born population - Bangladesh (%)
Place of birth for the foreign-born population - India (%)
Place of birth for the foreign-born population - Iran (%)
Place of birth for the foreign-born population - Kazakhstan (%)
Place of birth for the foreign-born population - Nepal (%)
Place of birth for the foreign-born population - Pakistan (%)
Place of birth for the foreign-born population - Sri Lanka (%)
Place of birth for the foreign-born population - Uzbekistan (%)
Place of birth for the foreign-born population - Other South Central Asia (%)
Place of birth for the foreign-born population - Burma (%)
Place of birth for the foreign-born population - Cambodia (%)
Place of birth for the foreign-born population - Indonesia (%)
Place of birth for the foreign-born population - Laos (%)
Place of birth for the foreign-born population - Malaysia (%)
Place of birth for the foreign-born population - Philippines (%)
Place of birth for the foreign-born population - Singapore (%)
Place of birth for the foreign-born population - Thailand (%)
Place of birth for the foreign-born population - Vietnam (%)
Place of birth for the foreign-born population - Other South Eastern Asia (%)
Place of birth for the foreign-born population - Armenia (%)
Place of birth for the foreign-born population - Iraq (%)
Place of birth for the foreign-born population - Israel (%)
Place of birth for the foreign-born population - Jordan (%)
Place of birth for the foreign-born population - Kuwait (%)
Place of birth for the foreign-born population - Lebanon (%)
Place of birth for the foreign-born population - Saudi Arabia (%)
Place of birth for the foreign-born population - Syria (%)
Place of birth for the foreign-born population - Turkey (%)
Place of birth for the foreign-born population - Yemen (%)
Place of birth for the foreign-born population - Other Western Asia (%)
Place of birth for the foreign-born population - Eritrea (%)
Place of birth for the foreign-born population - Ethiopia (%)
Place of birth for the foreign-born population - Kenya (%)
Place of birth for the foreign-born population - Somalia (%)
Place of birth for the foreign-born population - Uganda (%)
Place of birth for the foreign-born population - Zimbabwe (%)
Place of birth for the foreign-born population - Other Eastern Africa (%)
Place of birth for the foreign-born population - Cameroon (%)
Place of birth for the foreign-born population - Congo (%)
Place of birth for the foreign-born population - Democratic Republic of Congo (Zaire) (%)
Place of birth for the foreign-born population - Other Middle Africa (%)
Place of birth for the foreign-born population - Egypt (%)
Place of birth for the foreign-born population - Morocco (%)
Place of birth for the foreign-born population - Sudan (%)
Place of birth for the foreign-born population - Other Northern Africa (%)
Place of birth for the foreign-born population - South Africa (%)
Place of birth for the foreign-born population - Other Southern Africa (%)
Place of birth for the foreign-born population - Cabo Verde (%)
Place of birth for the foreign-born population - Ghana (%)
Place of birth for the foreign-born population - Liberia (%)
Place of birth for the foreign-born population - Nigeria (%)
Place of birth for the foreign-born population - Senegal (%)
Place of birth for the foreign-born population - Sierra Leone (%)
Place of birth for the foreign-born population - Other Western Africa (%)
Place of birth for the foreign-born population - Australia (%)
Place of birth for the foreign-born population - New Zealand (%)
Place of birth for the foreign-born population - Fiji (%)
Place of birth for the foreign-born population - Micronesia (%)
Place of birth for the foreign-born population - Bahamas (%)
Place of birth for the foreign-born population - Barbados (%)
Place of birth for the foreign-born population - Cuba (%)
Place of birth for the foreign-born population - Dominica (%)
Place of birth for the foreign-born population - Dominican Republic (%)
Place of birth for the foreign-born population - Grenada (%)
Place of birth for the foreign-born population - Haiti (%)
Place of birth for the foreign-born population - Jamaica (%)
Place of birth for the foreign-born population - St. Vincent and the Grenadines (%)
Place of birth for the foreign-born population - Trinidad and Tobago (%)
Place of birth for the foreign-born population - West Indies (%)
Place of birth for the foreign-born population - Other Caribbean (%)
Place of birth for the foreign-born population - Belize (%)
Place of birth for the foreign-born population - Costa Rica (%)
Place of birth for the foreign-born population - El Salvador (%)
Place of birth for the foreign-born population - Guatemala (%)
Place of birth for the foreign-born population - Honduras (%)
Place of birth for the foreign-born population - Mexico (%)
Place of birth for the foreign-born population - Nicaragua (%)
Place of birth for the foreign-born population - Panama (%)
Place of birth for the foreign-born population - Other Central America (%)
Place of birth for the foreign-born population - Argentina (%)
Place of birth for the foreign-born population - Bolivia (%)
Place of birth for the foreign-born population - Brazil (%)
Place of birth for the foreign-born population - Chile (%)
Place of birth for the foreign-born population - Colombia (%)
Place of birth for the foreign-born population - Ecuador (%)
Place of birth for the foreign-born population - Guyana (%)
Place of birth for the foreign-born population - Peru (%)
Place of birth for the foreign-born population - Uruguay (%)
Place of birth for the foreign-born population - Venezuela (%)
Place of birth for the foreign-born population - Other South America (%)
Place of birth for the foreign-born population - Canada (%)
Place of birth for the foreign-born population - Other Northern America (%)
Place of birth for the foreign-born population - Other (%)
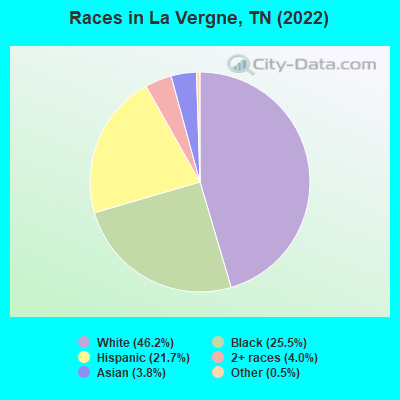
According to 2022 data, the most numerous races in La Vergne, TN are White alone (18,667 residents), Black alone (10,323 residents), and Hispanic (8,776 residents). 71.9% of La Vergne residents speak English at home. 16.2% of La Vergne, TN residents are foreign-born (10.1% born in Latin America, 3.2% born in Africa, 2.4% born in Asia), which is 69.1% greater than the foreign-born rate of 5.0% across the entire state of Tennessee.
Race distribution in La Vergne
2000 2022
4,505,930 79.2% White alone 928,204 16.3% Black alone 123,838 2.2% Hispanic 54,824 1.0% Two or more races 56,077 1.0% Asian alone 13,820 0.2% American Indian alone 4,780 0.08% Other race alone 1,810 0.03% Native Hawaiian and Other
5,070,026 71.9% White alone 1,089,738 15.5% Black alone 442,629 6.3% Hispanic 279,381 4.0% Two or more races 131,817 1.9% Asian alone 26,972 0.4% Other race alone 6,387 0.09% American Indian alone 4,389 0.06% Native Hawaiian and Other
Income and house value in La Vergne Median household income in 2022 $73,333 White non-Hispanic householders$78,011 Black householders$122,646 Asian householders$67,263 Some other race householders$68,556 Two or more races householders$89,254 Hispanic or Latino race householdersMedian 2022 house value $333,712 White Non-Hispanic householders$330,599 Black or African American householders $348,031 Asian householders$340,560 Some other race householders$237,832 Two or more races householders$338,381 Hispanic or Latino householders
Median age by race in La Vergne
35.9 Median age for White residents35.4 36.5 33.8 Median age for Black or African American residents34.5 31.1 65.7 Median age for American Indian / Alaska Native residents-633,911,367.4 -801,477,376.9 32.9 Median age for Asian residents24.4 36.3 -949,999,999.1 Median age for Native Hawaiian / Pacific Islander residents-951,707,890.7 -928,150,764.7 29.1 Median age for Other race residents31.0 30.8 21.5 Median age for Two or more races residents24.8 18.2 37.4 Median age for White alone residents38.4 37.2 24.8 Median age for Hispanic or Latino residents28.6 22.4
Owner/renter occupied households by race in La Vergne
House owners and renters - White residents 6,293 79.8% Owner occupied1,595 20.2% Renter occupiedHouse owners and renters - Black or African American residents 2,043 52.7% Owner occupied1,834 47.3% Renter occupiedHouse owners and renters - American Indian / Alaska Native residents 15 100.0% Owner occupiedHouse owners and renters - Asian residents 499 97.7% Owner occupied12 2.3% Renter occupiedHouse owners and renters - Other race residents 675 74.1% Owner occupied236 25.9% Renter occupiedHouse owners and renters - Two or more races residents 752 66.1% Owner occupied385 33.9% Renter occupiedHouse owners and renters - White alone residents 6,011 80.8% Owner occupied1,425 19.2% Renter occupiedHouse owners and renters - Hispanic or Latino residents 897 53.8% Owner occupied769 46.2% Renter occupied
Language usage in La Vergne
English speakers - Total 71.9% of residents of La Vergne speak English at home.
18.6% of residents speak Spanish at home 3,019 43.1% Speak English very well3,978 56.9% Speak English less than very well11.2% of residents speak other language at home 2,465 58.2% Speak English very well1,767 41.8% Speak English less than very well
English speakers - Born in the United States 93.8% of residents of La Vergne speak English at home.
3.9% of residents speak Spanish at home 349 69.4% Speak English very well154 30.6% Speak English less than very well2.4% of residents speak other language at home 305 96.5% Speak English very well11 3.5% Speak English less than very well
English speakers - Native, born elsewhere 40.6% of residents of La Vergne speak English at home.
83.8% of residents speak Spanish at home 399 56.0% Speak English very well313 44.0% Speak English less than very well16.5% of residents speak other language at home 31 22.1% Speak English very well109 77.9% Speak English less than very well
English speakers - Foreign-born 10.4% of residents of La Vergne speak English at home.
51.4% of residents speak Spanish at home 941 21.2% Speak English very well3,489 78.8% Speak English less than very well36.0% of residents speak other language at home 1,695 54.6% Speak English very well1,408 45.4% Speak English less than very well
White (Caucasian) - Speak only English Native:
91.7% (16,064)Foreign-born:
16.6% (250)
White (Caucasian) - Speak another language Native:
7.7% (1,357)Foreign-born:
82.6% (1,244)
Black or African American - Speak only English Native:
96.3% (7,823)Foreign-born:
34.8% (701)
Black or African American - Speak another language Native:
2.5% (202)Foreign-born:
25.8% (519)
American Indian / Alaska Native - Speak another language Native:
100.0% (10)Foreign-born:
100.0% (15)
Asian - Speak only English Native:
28.3% (141)Foreign-born:
14.7% (142)
Asian - Speak another language Native:
68.6% (341)Foreign-born:
84.6% (817)
Other race - Speak only English Native:
29.5% (531)Foreign-born:
2.4% (34)
Other race - Speak another language Native:
60.2% (1,083)Foreign-born:
100.0% (1,455)
Two or more races - Speak only English Native:
65.8% (1,583)Foreign-born:
0.2% (6)
Two or more races - Speak another language Native:
39.0% (939)Foreign-born:
100.0% (3,566)
White alone - Speak only English Native:
95.6% (15,583)Foreign-born:
15.9% (225)
White alone - Speak another language Native:
4.9% (800)Foreign-born:
84.1% (1,190)
Hispanic or Latino - Speak only English Native:
31.2% (1,165)Foreign-born:
2.1% (90)
Hispanic or Latino - Speak another language Native:
64.2% (2,397)Foreign-born:
100.0% (4,357)
Foreign-born residents in La Vergne 6,542 residents are foreign born (10.1% Latin America , 3.2% Africa , 2.4% Asia ).
This city:
16.2%Tennessee:
5.4%
Marital status for residents in La Vergne Marital status - White (Caucasian) population 15 years and over
Males 32.1% Never married53.1% Now married1.5% Separated1.3% Widowed12.1% DivorcedFemales 21.4% Never married56.8% Now married1.5% Separated6.0% Widowed14.2% DivorcedWomen who gave birth in the past 12 months Now married:
74.0% (279)Unmarried:
26.0% (98)
Women who did not give birth in the past 12 months Now married:
59.2% (2,551)Unmarried:
40.8% (1,758)
Marital status - Black or African American population 15 years and over
Males 35.8% Never married49.9% Now married5.6% Separated0.1% Widowed8.5% DivorcedFemales 43.6% Never married35.6% Now married1.1% Separated5.5% Widowed14.2% DivorcedWomen who gave birth in the past 12 months Now married:
23.9% (77)Unmarried:
76.1% (244)
Women who did not give birth in the past 12 months Now married:
34.0% (864)Unmarried:
66.0% (1,676)
Marital status - American Indian / Alaska Native population 15 years and over
Males 0.0% Never married100.0% Now married0.0% Separated0.0% Widowed0.0% DivorcedFemales 0.0% Never married100.0% Now married0.0% Separated0.0% Widowed0.0% DivorcedMarital status - Asian population 15 years and over
Males 51.7% Never married44.9% Now married0.0% Separated0.0% Widowed3.4% DivorcedFemales 37.6% Never married47.9% Now married0.0% Separated7.6% Widowed6.9% DivorcedWomen who gave birth in the past 12 months Now married:
0.0% (0)Unmarried:
100.0% (32)
Women who did not give birth in the past 12 months Now married:
48.6% (246)Unmarried:
51.4% (260)
Marital status - Other race population 15 years and over
Males 30.8% Never married59.9% Now married0.0% Separated2.3% Widowed7.1% DivorcedFemales 27.8% Never married58.2% Now married0.0% Separated4.2% Widowed9.7% DivorcedWomen who gave birth in the past 12 months Now married:
69.9% (120)Unmarried:
30.1% (52)
Women who did not give birth in the past 12 months Now married:
54.7% (417)Unmarried:
45.3% (345)
Marital status - Two or more races population 15 years and over
Males 49.1% Never married47.7% Now married0.0% Separated1.9% Widowed1.4% DivorcedFemales 42.4% Never married43.2% Now married0.3% Separated8.1% Widowed6.1% DivorcedWomen who gave birth in the past 12 months Now married:
12.0% (5)Unmarried:
88.0% (34)
Women who did not give birth in the past 12 months Now married:
40.7% (611)Unmarried:
59.3% (891)
Marital status - White alone, not Hispanic / Latino population 15 years and over
Males 31.8% Never married52.3% Now married1.6% Separated1.5% Widowed12.9% DivorcedFemales 20.2% Never married56.8% Now married1.7% Separated6.4% Widowed14.9% DivorcedWomen who gave birth in the past 12 months Now married:
77.1% (249)Unmarried:
22.9% (74)
Women who did not give birth in the past 12 months Now married:
59.9% (2,339)Unmarried:
40.1% (1,565)
Marital status - Hispanic or Latino population 15 years and over
Males 34.1% Never married61.4% Now married0.0% Separated0.9% Widowed3.6% DivorcedFemales 31.7% Never married54.2% Now married0.1% Separated5.9% Widowed8.1% DivorcedWomen who gave birth in the past 12 months Now married:
61.0% (177)Unmarried:
39.0% (113)
Women who did not give birth in the past 12 months Now married:
52.0% (1,199)Unmarried:
48.0% (1,106)
Ancestries in La Vergne
2,544 11.1% American1,160 5.1% English944 4.1% Irish802 3.5% German646 2.8% Egyptian439 1.9% African350 1.5% Haitian336 1.5% Italian222 1.0% European221 1.0% Nigerian215 0.9% Arab202 0.9% Ethiopian142 0.6% Yugoslavian104 0.5% West Indian93 0.4% Dutch89 0.4% British71 0.3% Lebanese67 0.3% Scottish61 0.3% Polish58 0.3% French54 0.2% Scotch-Irish53 0.2% Turkish46 0.2% Norwegian43 0.2% Northern European42 0.2% Russian32 0.1% Danish27 0.1% Scandinavian23 0.1% French Canadian21 0.09% Jamaican20 0.09% Swedish20 0.09% Pennsylvania German19 0.08% Romanian17 0.07% Swiss13 0.06% Cajun13 0.06% Welsh12 0.05% Hungarian11 0.05% Czechoslovakian10 0.04% Cypriot7 0.03% Portuguese4 0.02% Belizean
Geographical mobility in La Vergne Same house 1 year ago 18,019 89.2% White (Caucasian)8,916 86.6% Black or African American13 59.9% American Indian / Alaska Native1,339 91.3% Asian2,573 78.4% Other race4,572 79.6% Two or more races16,388 89.3% White alone, not Hispanic / Latino7,132 83.9% Hispanic or LatinoMoved within same county 526 2.6% White / Caucasian661 6.4% Black or African American21 1.4% Asian35 1.1% Other race320 5.6% Two or more races397 2.2% White alone, not Hispanic / Latino265 3.1% Hispanic or LatinoMoved within same state 1,170 5.8% White / Caucasian484 4.7% Black or African American18 81.2% American Indian / Alaska Native34 2.3% Asian295 9.0% Other race418 7.3% Two or more races1,075 5.9% White alone, not Hispanic / Latino392 4.6% Hispanic or LatinoMoved from different state 573 2.8% White / Caucasian162 1.6% Black or African American33 2.3% Asian4 0.1% Other race143 2.5% Two or more races621 3.4% White alone, not Hispanic / Latino15 0.2% Hispanic or LatinoMoved from abroad 55 0.3% White13 0.9% Asian7 0.2% Other race130 2.3% Two or more races65 0.4% White alone, not Hispanic / Latino105 1.2% Hispanic or Latino
Children Nativity (place of birth) in La Vergne
Children under 6 years - Living with two parents Both parents native 1,046 96.5% Native38 3.5% Foreign-bornBoth parents foreign-born 574 83.4% Native114 16.6% Foreign-bornOne native, one foreign-born parent 388 100.0% NativeChildren under 6 years - Living with one parent Native parent 903 100.0% NativeForeign-born parent 199 100.0% NativeChildren 6 to 17 years - Living with two parents Both parents native 2,298 100.0% NativeBoth parents foreign-born 1,441 61.0% Native921 39.0% Foreign-bornOne native, one foreign-born parent 200 100.0% NativeChildren 6 to 17 years - Living with one parent Native parent 1,954 100.0% NativeForeign-born parent 1,321 56.5% Native1,018 43.5% Foreign-born
Grandparents responsible for own grandchildren in La Vergne
Grandparents (30 to 59 years) White / Caucasian 90 40.7% Responsible for grandchildren131 59.3% Not responsible for grandchildrenBlack or African American 96 50.6% Responsible for grandchildren94 49.4% Not responsible for grandchildrenAsian 41 37.5% Responsible for grandchildren68 62.5% Not responsible for grandchildrenOther race 84 100.0% Not responsible for grandchildrenWhite alone, not Hispanic / Latino 92 45.2% Responsible for grandchildren111 54.8% Not responsible for grandchildrenHispanic or Latino 85 100.0% Not responsible for grandchildrenGrandparents (60 years and over) White / Caucasian 135 54.4% Responsible for grandchildren113 45.6% Not responsible for grandchildrenBlack or African American 37 34.2% Responsible for grandchildren72 65.8% Not responsible for grandchildrenAsian 8 100.0% Not responsible for grandchildrenOther race 26 52.4% Responsible for grandchildren23 47.6% Not responsible for grandchildrenWhite alone, not Hispanic / Latino 125 54.4% Responsible for grandchildren105 45.6% Not responsible for grandchildrenHispanic or Latino 19 10.7% Responsible for grandchildren156 89.3% Not responsible for grandchildren