Races in Millis, Massachusetts (MA) Detailed Stats
Ancestries, Foreign-born residents, place of birth

Recent posts about races in Millis, Massachusetts on our local forum with over 2,400,000 registered users:
 | People are leaving Massachusetts in droves. Who are they? (334 replies) |
| 2023 Real Estate Observations (5278 replies) |
| towns that offer the most jobs per dollar of house (58 replies) |
| Big MA Ancestry Data Thread by Town (31 replies) |
| Thoughts on these 10 towns (92 replies) |
| Levels of diversity and integration among the towns and cities of Greater Boston (256 replies) |
5.7% of Millis, MA residents are foreign-born (2.7% born in Europe, 1.2% born in Asia, 1.0% born in Latin America, 0.8% born in North America), which is 218.2% less than the foreign-born rate of 18.0% across the entire state of Massachusetts.
Race distribution in Millis

- 7,59896.2%White alone
- 901.1%Asian alone
- 740.9%Hispanic
- 560.7%Black alone
- 590.7%Two or more races
- 140.2%Other race alone
- 110.1%American Indian alone

2000
2022
-
- 5,198,35981.9%White alone
- 428,7296.8%Hispanic
- 318,3295.0%Black alone
- 236,7863.7%Asian alone
- 110,3381.7%Two or more races
- 43,5860.7%Other race alone
- 11,2640.2%American Indian alone
- 1,7060.03%Native Hawaiian and Other
Pacific Islander alone

-
- 4,676,62767.0%White alone
- 911,03813.0%Hispanic
- 501,4637.2%Asian alone
- 459,7406.6%Black alone
- 341,8894.9%Two or more races
- 84,4031.2%Other race alone
- 5,8380.08%American Indian alone
- 9760.01%Native Hawaiian and Other
Pacific Islander alone

Income and house value in Millis
- Median household income in 2022
- $117,584White non-Hispanic householders
- $119,406Black householders
- $25,855Asian householders
- $51,646Some other race householders
- $189,112Two or more races householders
- $4,492Hispanic or Latino race householders
- Median 2022 house value
- $586,388White Non-Hispanic householders
- $646,118Black or African American householders
- $394,850Asian householders
- $583,229Two or more races householders
Household income for White non-Hispanic householders

Household income for Black householders

Household income for Asian householders

Household income for Two or more races householders

Household income for Hispanic or Latino race householders

Foreign-born residents in Millis
447 residents are foreign born (2.7% Europe, 1.2% Asia, 1.0% Latin America, 0.8% North America).
| This city: | 5.7% |
| Massachusetts: | 12.2% |
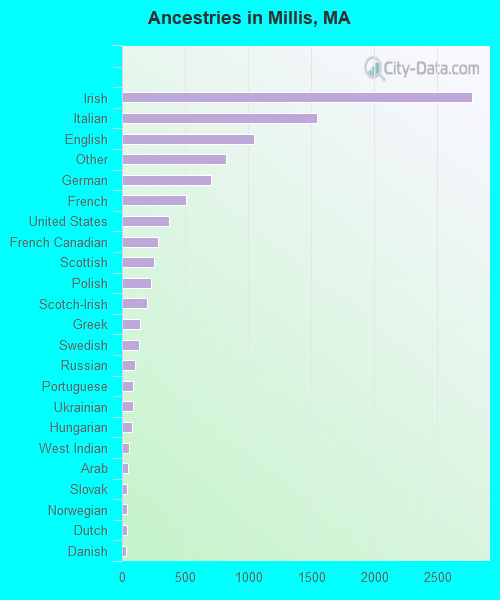
Ancestries in Millis

- 2,77128.6%Irish
- 1,54215.9%Italian
- 1,04510.8%English
- 8278.5%Other
- 7097.3%German
- 5075.2%French
- 3763.9%United States
- 2893.0%French Canadian
- 2522.6%Scottish
- 2272.3%Polish
- 1972.0%Scotch-Irish
- 1441.5%Greek
- 1311.4%Swedish
- 1041.1%Russian
- 870.9%Portuguese
- 860.9%Ukrainian
- 760.8%Hungarian
- 570.6%West Indian
- 490.5%Arab
- 420.4%Slovak
- 410.4%Norwegian
- 360.4%Dutch
- 290.3%Danish
- 240.2%Czech
- 200.2%Lithuanian
- 80.08%Swiss
Zip codes: 02054.