Races in Milwaukie, Oregon (OR) Detailed Stats
Data:
Races - White alone (%)
Races - White alone (% change since 2000)
Races - Black alone (%)
Races - Black alone (% change since 2000)
Races - American Indian alone (%)
Races - American Indian alone (% change since 2000)
Races - Asian alone (%)
Races - Asian alone (% change since 2000)
Races - Hispanic (%)
Races - Hispanic (% change since 2000)
Races - Native Hawaiian and Other Pacific Islander alone (%)
Races - Native Hawaiian and Other Pacific Islander alone (% change since 2000)
Races - Two or more races(%)
Races - Two or more races(% change since 2000)
Races - Other race alone (%)
Races - Other race alone (% change since 2000)
Racial diversity
Place of birth - Born in state of residence (%)
Place of birth - Born in state of residence (%) - White
Place of birth - Born in state of residence (%) - Black or African American
Place of birth - Born in state of residence (%) - Asian
Place of birth - Born in state of residence (%) - Hispanic or Latino
Place of birth - Born in state of residence (%) - American Indian and Alaska Native
Place of birth - Born in state of residence (%) - Multirace
Place of birth - Born in state of residence (%) - Other Race
Place of birth - Born in other state (%)
Place of birth - Born in other state (%) - White
Place of birth - Born in other state (%) - Black or African American
Place of birth - Born in other state (%) - Asian
Place of birth - Born in other state (%) - Hispanic or Latino
Place of birth - Born in other state (%) - American Indian and Alaska Native
Place of birth - Born in other state (%) - Multirace
Place of birth - Born in other state (%) - Other Race
Place of birth - Native, outside of US (%)
Place of birth - Native, outside of US (%) - White
Place of birth - Native, outside of US (%) - Black or African American
Place of birth - Native, outside of US (%) - Asian
Place of birth - Native, outside of US (%) - Hispanic or Latino
Place of birth - Native, outside of US (%) - American Indian and Alaska Native
Place of birth - Native, outside of US (%) - Multirace
Place of birth - Native, outside of US (%) - Other Race
Place of birth - Foreign born (%)
Place of birth - Foreign born (%) - White
Place of birth - Foreign born (%) - Black or African American
Place of birth - Foreign born (%) - Asian
Place of birth - Foreign born (%) - Hispanic or Latino
Place of birth - Foreign born (%) - American Indian and Alaska Native
Place of birth - Foreign born (%) - Multirace
Place of birth - Foreign born (%) - Other Race
Residents speaking English at home (%)
Residents speaking English at home - Born in the United States (%)
Residents speaking English at home - Native, born elsewhere (%)
Residents speaking English at home - Foreign born (%)
Residents speaking Spanish at home (%)
Residents speaking Spanish at home - Born in the United States (%)
Residents speaking Spanish at home - Native, born elsewhere (%)
Residents speaking Spanish at home - Foreign born (%)
Residents speaking other language at home (%)
Residents speaking other language at home - Born in the United States (%)
Residents speaking other language at home - Native, born elsewhere (%)
Residents speaking other language at home - Foreign born (%)
Marital status - Never married (%)
Marital status - Now married (%)
Marital status - Separated (%)
Marital status - Widowed (%)
Marital status - Divorced (%)
Ancestries Reported - Arab (%)
Ancestries Reported - Czech (%)
Ancestries Reported - Danish (%)
Ancestries Reported - Dutch (%)
Ancestries Reported - English (%)
Ancestries Reported - French (%)
Ancestries Reported - French Canadian (%)
Ancestries Reported - German (%)
Ancestries Reported - Greek (%)
Ancestries Reported - Hungarian (%)
Ancestries Reported - Irish (%)
Ancestries Reported - Italian (%)
Ancestries Reported - Lithuanian (%)
Ancestries Reported - Norwegian (%)
Ancestries Reported - Polish (%)
Ancestries Reported - Portuguese (%)
Ancestries Reported - Russian (%)
Ancestries Reported - Scotch-Irish (%)
Ancestries Reported - Scottish (%)
Ancestries Reported - Slovak (%)
Ancestries Reported - Subsaharan African (%)
Ancestries Reported - Swedish (%)
Ancestries Reported - Swiss (%)
Ancestries Reported - Ukrainian (%)
Ancestries Reported - United States (%)
Ancestries Reported - Welsh (%)
Ancestries Reported - West Indian (%)
Ancestries Reported - Other (%)
Geographical mobility - Same house 1 year ago (%)
Geographical mobility - Same house 1 year ago (%) - White
Geographical mobility - Same house 1 year ago (%) - Black or African American
Geographical mobility - Same house 1 year ago (%) - Asian
Geographical mobility - Same house 1 year ago (%) - Hispanic or Latino
Geographical mobility - Same house 1 year ago (%) - American Indian and Alaska Native
Geographical mobility - Same house 1 year ago (%) - Multirace
Geographical mobility - Same house 1 year ago (%) - Other Race
Geographical mobility - Moved within same county (%)
Geographical mobility - Moved within same county (%) - White
Geographical mobility - Moved within same county (%) - Black or African American
Geographical mobility - Moved within same county (%) - Asian
Geographical mobility - Moved within same county (%) - Hispanic or Latino
Geographical mobility - Moved within same county (%) - American Indian and Alaska Native
Geographical mobility - Moved within same county (%) - Multirace
Geographical mobility - Moved within same county (%) - Other Race
Geographical mobility - Moved from different county within same state (%)
Geographical mobility - Moved from different county within same state (%) - White
Geographical mobility - Moved from different county within same state (%) - Black or African American
Geographical mobility - Moved from different county within same state (%) - Asian
Geographical mobility - Moved from different county within same state (%) - Hispanic or Latino
Geographical mobility - Moved from different county within same state (%) - American Indian and Alaska Native
Geographical mobility - Moved from different county within same state (%) - Multirace
Geographical mobility - Moved from different county within same state (%) - Other Race
Geographical mobility - Moved from different state (%)
Geographical mobility - Moved from different state (%) - White
Geographical mobility - Moved from different state (%) - Black or African American
Geographical mobility - Moved from different state (%) - Asian
Geographical mobility - Moved from different state (%) - Hispanic or Latino
Geographical mobility - Moved from different state (%) - American Indian and Alaska Native
Geographical mobility - Moved from different state (%) - Multirace
Geographical mobility - Moved from different state (%) - Other Race
Geographical mobility - Moved from abroad (%)
Geographical mobility - Moved from abroad (%) - White
Geographical mobility - Moved from abroad (%) - Black or African American
Geographical mobility - Moved from abroad (%) - Asian
Geographical mobility - Moved from abroad (%) - Hispanic or Latino
Geographical mobility - Moved from abroad (%) - American Indian and Alaska Native
Geographical mobility - Moved from abroad (%) - Multirace
Geographical mobility - Moved from abroad (%) - Other Race
Place of birth for the foreign-born population - Ireland (%)
Place of birth for the foreign-born population - Denmark (%)
Place of birth for the foreign-born population - Norway (%)
Place of birth for the foreign-born population - Sweden (%)
Place of birth for the foreign-born population - United Kingdom (%)
Place of birth for the foreign-born population - England (%)
Place of birth for the foreign-born population - Scotland (%)
Place of birth for the foreign-born population - Other Northern Europe (%)
Place of birth for the foreign-born population - Austria (%)
Place of birth for the foreign-born population - Belgium (%)
Place of birth for the foreign-born population - France (%)
Place of birth for the foreign-born population - Germany (%)
Place of birth for the foreign-born population - Netherlands (%)
Place of birth for the foreign-born population - Switzerland (%)
Place of birth for the foreign-born population - Other Western Europe (%)
Place of birth for the foreign-born population - Greece (%)
Place of birth for the foreign-born population - Italy (%)
Place of birth for the foreign-born population - Portugal (%)
Place of birth for the foreign-born population - Spain (%)
Place of birth for the foreign-born population - Other Southern Europe (%)
Place of birth for the foreign-born population - Albania (%)
Place of birth for the foreign-born population - Belarus (%)
Place of birth for the foreign-born population - Bosnia and Herzegovina (%)
Place of birth for the foreign-born population - Bulgaria (%)
Place of birth for the foreign-born population - Croatia (%)
Place of birth for the foreign-born population - Czechoslovakia (%)
Place of birth for the foreign-born population - Hungary (%)
Place of birth for the foreign-born population - Latvia (%)
Place of birth for the foreign-born population - Lithuania (%)
Place of birth for the foreign-born population - North Macedonia (Macedonia) (%)
Place of birth for the foreign-born population - Moldova (%)
Place of birth for the foreign-born population - Poland (%)
Place of birth for the foreign-born population - Romania (%)
Place of birth for the foreign-born population - Russia (%)
Place of birth for the foreign-born population - Serbia (%)
Place of birth for the foreign-born population - Ukraine (%)
Place of birth for the foreign-born population - Other Eastern Europe (%)
Place of birth for the foreign-born population - China (%)
Place of birth for the foreign-born population - Hong Kong (%)
Place of birth for the foreign-born population - Taiwan (%)
Place of birth for the foreign-born population - Japan (%)
Place of birth for the foreign-born population - Korea (%)
Place of birth for the foreign-born population - Other Eastern Asia (%)
Place of birth for the foreign-born population - Afghanistan (%)
Place of birth for the foreign-born population - Bangladesh (%)
Place of birth for the foreign-born population - India (%)
Place of birth for the foreign-born population - Iran (%)
Place of birth for the foreign-born population - Kazakhstan (%)
Place of birth for the foreign-born population - Nepal (%)
Place of birth for the foreign-born population - Pakistan (%)
Place of birth for the foreign-born population - Sri Lanka (%)
Place of birth for the foreign-born population - Uzbekistan (%)
Place of birth for the foreign-born population - Other South Central Asia (%)
Place of birth for the foreign-born population - Burma (%)
Place of birth for the foreign-born population - Cambodia (%)
Place of birth for the foreign-born population - Indonesia (%)
Place of birth for the foreign-born population - Laos (%)
Place of birth for the foreign-born population - Malaysia (%)
Place of birth for the foreign-born population - Philippines (%)
Place of birth for the foreign-born population - Singapore (%)
Place of birth for the foreign-born population - Thailand (%)
Place of birth for the foreign-born population - Vietnam (%)
Place of birth for the foreign-born population - Other South Eastern Asia (%)
Place of birth for the foreign-born population - Armenia (%)
Place of birth for the foreign-born population - Iraq (%)
Place of birth for the foreign-born population - Israel (%)
Place of birth for the foreign-born population - Jordan (%)
Place of birth for the foreign-born population - Kuwait (%)
Place of birth for the foreign-born population - Lebanon (%)
Place of birth for the foreign-born population - Saudi Arabia (%)
Place of birth for the foreign-born population - Syria (%)
Place of birth for the foreign-born population - Turkey (%)
Place of birth for the foreign-born population - Yemen (%)
Place of birth for the foreign-born population - Other Western Asia (%)
Place of birth for the foreign-born population - Eritrea (%)
Place of birth for the foreign-born population - Ethiopia (%)
Place of birth for the foreign-born population - Kenya (%)
Place of birth for the foreign-born population - Somalia (%)
Place of birth for the foreign-born population - Uganda (%)
Place of birth for the foreign-born population - Zimbabwe (%)
Place of birth for the foreign-born population - Other Eastern Africa (%)
Place of birth for the foreign-born population - Cameroon (%)
Place of birth for the foreign-born population - Congo (%)
Place of birth for the foreign-born population - Democratic Republic of Congo (Zaire) (%)
Place of birth for the foreign-born population - Other Middle Africa (%)
Place of birth for the foreign-born population - Egypt (%)
Place of birth for the foreign-born population - Morocco (%)
Place of birth for the foreign-born population - Sudan (%)
Place of birth for the foreign-born population - Other Northern Africa (%)
Place of birth for the foreign-born population - South Africa (%)
Place of birth for the foreign-born population - Other Southern Africa (%)
Place of birth for the foreign-born population - Cabo Verde (%)
Place of birth for the foreign-born population - Ghana (%)
Place of birth for the foreign-born population - Liberia (%)
Place of birth for the foreign-born population - Nigeria (%)
Place of birth for the foreign-born population - Senegal (%)
Place of birth for the foreign-born population - Sierra Leone (%)
Place of birth for the foreign-born population - Other Western Africa (%)
Place of birth for the foreign-born population - Australia (%)
Place of birth for the foreign-born population - New Zealand (%)
Place of birth for the foreign-born population - Fiji (%)
Place of birth for the foreign-born population - Micronesia (%)
Place of birth for the foreign-born population - Bahamas (%)
Place of birth for the foreign-born population - Barbados (%)
Place of birth for the foreign-born population - Cuba (%)
Place of birth for the foreign-born population - Dominica (%)
Place of birth for the foreign-born population - Dominican Republic (%)
Place of birth for the foreign-born population - Grenada (%)
Place of birth for the foreign-born population - Haiti (%)
Place of birth for the foreign-born population - Jamaica (%)
Place of birth for the foreign-born population - St. Vincent and the Grenadines (%)
Place of birth for the foreign-born population - Trinidad and Tobago (%)
Place of birth for the foreign-born population - West Indies (%)
Place of birth for the foreign-born population - Other Caribbean (%)
Place of birth for the foreign-born population - Belize (%)
Place of birth for the foreign-born population - Costa Rica (%)
Place of birth for the foreign-born population - El Salvador (%)
Place of birth for the foreign-born population - Guatemala (%)
Place of birth for the foreign-born population - Honduras (%)
Place of birth for the foreign-born population - Mexico (%)
Place of birth for the foreign-born population - Nicaragua (%)
Place of birth for the foreign-born population - Panama (%)
Place of birth for the foreign-born population - Other Central America (%)
Place of birth for the foreign-born population - Argentina (%)
Place of birth for the foreign-born population - Bolivia (%)
Place of birth for the foreign-born population - Brazil (%)
Place of birth for the foreign-born population - Chile (%)
Place of birth for the foreign-born population - Colombia (%)
Place of birth for the foreign-born population - Ecuador (%)
Place of birth for the foreign-born population - Guyana (%)
Place of birth for the foreign-born population - Peru (%)
Place of birth for the foreign-born population - Uruguay (%)
Place of birth for the foreign-born population - Venezuela (%)
Place of birth for the foreign-born population - Other South America (%)
Place of birth for the foreign-born population - Canada (%)
Place of birth for the foreign-born population - Other Northern America (%)
Place of birth for the foreign-born population - Other (%)
Latest news about races in Milwaukie, OR collected exclusively by city-data.com from local newspapers, TV, and radio stations
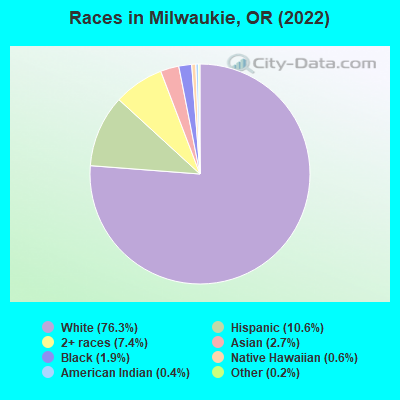
According to 2022 data, the most numerous races in Milwaukie, OR are White alone (16,261 residents), Hispanic (2,265 residents), and Two or more races (1,580 residents). 93.7% of Milwaukie residents speak English at home. 4.6% of Milwaukie, OR residents are foreign-born (1.5% born in Europe, 1.3% born in Asia, 1.1% born in Latin America), which is 93.7% less than the foreign-born rate of 9.0% across the entire state of Oregon.
Race distribution in Milwaukie
2000 2022
2,857,616 83.5% White alone 275,314 8.0% Hispanic 100,333 2.9% Asian alone 82,733 2.4% Two or more races 53,325 1.6% Black alone 40,130 1.2% American Indian alone 7,398 0.2% Native Hawaiian and Other 4,550 0.1% Other race alone
3,037,571 71.6% White alone 609,538 14.4% Hispanic 252,744 6.0% Two or more races 191,283 4.5% Asian alone 78,228 1.8% Black alone 29,399 0.7% American Indian alone 25,731 0.6% Other race alone 15,643 0.4% Native Hawaiian and Other
Income and house value in Milwaukie Median household income in 2022 $81,592 White non-Hispanic householders$84,079 Some other race householders$65,810 Two or more races householders$92,023 Hispanic or Latino race householdersMedian 2022 house value $514,657 White Non-Hispanic householders$290,908 Black or African American householders$507,011 American Indian or Alaska Native householders $504,019 Asian householders$511,665 Some other race householders$656,621 Two or more races householders$504,351 Hispanic or Latino householders
Median age by race in Milwaukie
42.3 Median age for White residents42.3 42.2 47.8 Median age for Black or African American residents75.3 27.5 46.2 Median age for American Indian / Alaska Native residents-600,368,323.5 41.0 36.6 Median age for Asian residents54.9 28.4 31.2 Median age for Native Hawaiian / Pacific Islander residents-764,119,600.6 32.2 34.1 Median age for Other race residents35.2 47.0 26.1 Median age for Two or more races residents26.3 26.6 43.8 Median age for White alone residents42.6 44.8 22.1 Median age for Hispanic or Latino residents22.0 22.1
Owner/renter occupied households by race in Milwaukie
House owners and renters - White residents 4,934 61.3% Owner occupied3,113 38.7% Renter occupiedHouse owners and renters - Black or African American residents 32 40.9% Owner occupied47 59.1% Renter occupiedHouse owners and renters - American Indian / Alaska Native residents 34 38.3% Owner occupied56 61.7% Renter occupiedHouse owners and renters - Asian residents 22 18.8% Owner occupied93 81.2% Renter occupiedHouse owners and renters - Native Hawaiian / Pacific Islander residents 18 63.7% Owner occupied11 36.3% Renter occupiedHouse owners and renters - Other race residents 123 67.3% Owner occupied60 32.7% Renter occupiedHouse owners and renters - Two or more races residents 352 41.2% Owner occupied502 58.8% Renter occupiedHouse owners and renters - White alone residents 4,893 60.9% Owner occupied3,136 39.1% Renter occupiedHouse owners and renters - Hispanic or Latino residents 238 57.8% Owner occupied174 42.2% Renter occupied
Language usage in Milwaukie
English speakers - Total 93.7% of residents of Milwaukie speak English at home.
3.3% of residents speak Spanish at home 569 86.0% Speak English very well93 14.0% Speak English less than very well3.3% of residents speak other language at home 438 66.1% Speak English very well225 33.9% Speak English less than very well
English speakers - Born in the United States 93.8% of residents of Milwaukie speak English at home.
5.0% of residents speak Spanish at home 406 91.9% Speak English very well36 8.1% Speak English less than very well1.4% of residents speak other language at home 123 100.0% Speak English very well
English speakers - Native, born elsewhere 61.2% of residents of Milwaukie speak English at home.
2.5% of residents speak Spanish at home 8 100.0% Speak English very well42.2% of residents speak other language at home 71 52.2% Speak English very well65 47.8% Speak English less than very well
English speakers - Foreign-born 46.7% of residents of Milwaukie speak English at home.
14.4% of residents speak Spanish at home 74 56.5% Speak English very well57 43.5% Speak English less than very well38.3% of residents speak other language at home 179 51.3% Speak English very well170 48.7% Speak English less than very well
White (Caucasian) - Speak only English Native:
97.5% (15,781)Foreign-born:
66.6% (229)
White (Caucasian) - Speak another language Native:
2.6% (426)Foreign-born:
40.6% (140)
Black or African American - Speak only English Native:
99.5% (270)Foreign-born:
100.0% (4)
American Indian / Alaska Native - Speak only English Native:
100.0% (105)Foreign-born:
86.0% (10)
Asian - Speak only English Native:
65.8% (145)Foreign-born:
32.2% (107)
Asian - Speak another language Native:
32.8% (72)Foreign-born:
59.3% (197)
Other race - Speak another language Native:
50.1% (232)Foreign-born:
89.1% (62)
Two or more races - Speak only English Native:
93.3% (1,849)Foreign-born:
17.3% (18)
Two or more races - Speak another language Native:
6.8% (134)Foreign-born:
75.9% (77)
White alone - Speak only English Native:
98.1% (15,134)Foreign-born:
68.1% (240)
White alone - Speak another language Native:
1.9% (296)Foreign-born:
34.2% (120)
Hispanic or Latino - Speak another language Native:
21.5% (419)Foreign-born:
83.8% (144)
Foreign-born residents in Milwaukie 990 residents are foreign born (1.5% Europe , 1.3% Asia , 1.1% Latin America ).
This city:
4.6%Oregon:
9.8%
Marital status for residents in Milwaukie Marital status - White (Caucasian) population 15 years and over
Males 35.6% Never married44.6% Now married1.0% Separated1.8% Widowed17.0% DivorcedFemales 29.5% Never married42.1% Now married1.6% Separated9.2% Widowed17.6% DivorcedWomen who gave birth in the past 12 months Now married:
85.5% (119)Unmarried:
14.5% (20)
Women who did not give birth in the past 12 months Now married:
36.9% (1,529)Unmarried:
63.1% (2,610)
Marital status - Black or African American population 15 years and over
Males 0.7% Never married87.8% Now married0.0% Separated0.0% Widowed11.6% DivorcedFemales 30.7% Never married63.4% Now married0.0% Separated5.9% Widowed0.0% DivorcedWomen who did not give birth in the past 12 months Now married:
63.5% (58)Unmarried:
36.5% (33)
Marital status - American Indian / Alaska Native population 15 years and over
Males 0.0% Never married0.0% Now married0.0% Separated0.0% Widowed100.0% DivorcedFemales 39.3% Never married21.3% Now married0.0% Separated0.0% Widowed39.3% DivorcedWomen who did not give birth in the past 12 months Now married:
17.6% (10)Unmarried:
82.4% (46)
Marital status - Asian population 15 years and over
Males 26.7% Never married73.3% Now married0.0% Separated0.0% Widowed0.0% DivorcedFemales 36.8% Never married58.2% Now married0.0% Separated0.0% Widowed5.0% DivorcedWomen who gave birth in the past 12 months Now married:
100.0% (33)Unmarried:
0.0% (0)
Women who did not give birth in the past 12 months Now married:
45.8% (116)Unmarried:
54.2% (138)
Marital status - Native Hawaiian / Pacific Islander population 15 years and over
Males 100.0% Never married0.0% Now married0.0% Separated0.0% Widowed0.0% DivorcedFemales 56.6% Never married0.0% Now married0.0% Separated0.0% Widowed43.4% DivorcedWomen who did not give birth in the past 12 months Now married:
0.0% (0)Unmarried:
100.0% (56)
Marital status - Other race population 15 years and over
Males 22.0% Never married66.5% Now married0.0% Separated11.5% Widowed0.0% DivorcedFemales 5.7% Never married91.1% Now married0.0% Separated0.0% Widowed3.2% DivorcedWomen who gave birth in the past 12 months Now married:
100.0% (29)Unmarried:
0.0% (0)
Women who did not give birth in the past 12 months Now married:
84.9% (100)Unmarried:
15.1% (18)
Marital status - Two or more races population 15 years and over
Males 37.8% Never married49.6% Now married0.0% Separated0.0% Widowed12.6% DivorcedFemales 40.1% Never married43.2% Now married0.9% Separated0.1% Widowed15.7% DivorcedWomen who gave birth in the past 12 months Now married:
100.0% (149)Unmarried:
0.0% (0)
Women who did not give birth in the past 12 months Now married:
30.3% (198)Unmarried:
69.7% (456)
Marital status - White alone, not Hispanic / Latino population 15 years and over
Males 34.9% Never married44.9% Now married1.1% Separated1.8% Widowed17.4% DivorcedFemales 27.7% Never married42.9% Now married1.5% Separated9.4% Widowed18.5% DivorcedWomen who gave birth in the past 12 months Now married:
92.5% (121)Unmarried:
7.5% (10)
Women who did not give birth in the past 12 months Now married:
37.6% (1,463)Unmarried:
62.4% (2,429)
Marital status - Hispanic or Latino population 15 years and over
Males 37.3% Never married55.4% Now married0.0% Separated3.0% Widowed4.3% DivorcedFemales 49.1% Never married41.8% Now married1.4% Separated2.4% Widowed5.4% DivorcedWomen who gave birth in the past 12 months Now married:
78.8% (43)Unmarried:
21.2% (12)
Women who did not give birth in the past 12 months Now married:
37.5% (264)Unmarried:
62.5% (439)
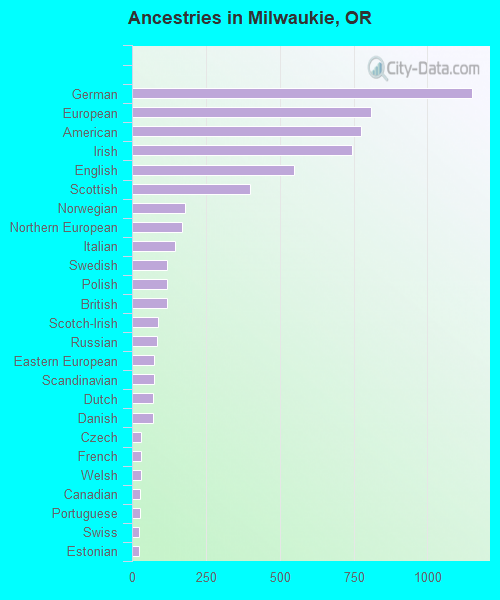
Ancestries in Milwaukie
1,151 13.0% German810 9.2% European774 8.8% American746 8.4% Irish549 6.2% English401 4.5% Scottish178 2.0% Norwegian168 1.9% Northern European145 1.6% Italian120 1.4% Swedish119 1.3% Polish117 1.3% British89 1.0% Scotch-Irish85 1.0% Russian75 0.8% Eastern European75 0.8% Scandinavian71 0.8% Dutch70 0.8% Danish32 0.4% Czech29 0.3% French29 0.3% Welsh28 0.3% Canadian26 0.3% Portuguese25 0.3% Swiss24 0.3% Estonian16 0.2% Finnish16 0.2% Latvian10 0.1% Czechoslovakian10 0.1% French Canadian8 0.09% Ukrainian7 0.08% Iraqi5 0.06% West Indian3 0.03% Slovak
Geographical mobility in Milwaukie Same house 1 year ago 14,683 86.8% White (Caucasian)266 98.2% Black or African American78 62.2% American Indian / Alaska Native344 61.6% Asian82 100.0% Native Hawaiian / Pacific Islander422 75.1% Other race2,169 91.6% Two or more races13,978 86.6% White alone, not Hispanic / Latino1,847 83.4% Hispanic or LatinoMoved within same county 598 3.5% White / Caucasian58 10.3% Other race35 1.5% Two or more races550 3.4% White alone, not Hispanic / Latino130 5.9% Hispanic or LatinoMoved within same state 1,371 8.1% White / Caucasian13 4.8% Black or African American65 51.7% American Indian / Alaska Native31 5.5% Asian38 6.8% Other race102 4.3% Two or more races1,402 8.7% White alone, not Hispanic / Latino136 6.1% Hispanic or LatinoMoved from different state 385 2.3% White / Caucasian4 1.4% Black or African American153 27.5% Asian30 5.4% Other race375 2.3% White alone, not Hispanic / Latino40 1.8% Hispanic or LatinoMoved from abroad 50 0.3% White28 4.9% Asian33 1.4% Two or more races11 0.1% White alone, not Hispanic / Latino67 3.0% Hispanic or Latino
Children Nativity (place of birth) in Milwaukie
Children under 6 years - Living with two parents Both parents native 976 100.0% NativeBoth parents foreign-born 39 100.0% NativeOne native, one foreign-born parent 60 100.0% NativeChildren under 6 years - Living with one parent Native parent 214 100.0% NativeForeign-born parent 11 100.0% NativeChildren 6 to 17 years - Living with two parents Both parents native 1,139 100.0% NativeBoth parents foreign-born 6 100.0% NativeOne native, one foreign-born parent 119 100.0% NativeChildren 6 to 17 years - Living with one parent Native parent 1,045 100.0% NativeForeign-born parent 20 47.4% Native23 52.6% Foreign-born
Grandparents responsible for own grandchildren in Milwaukie
Grandparents (30 to 59 years) White / Caucasian 25 22.9% Responsible for grandchildren85 77.1% Not responsible for grandchildrenAsian 20 100.0% Not responsible for grandchildrenWhite alone, not Hispanic / Latino 25 35.2% Responsible for grandchildren46 64.8% Not responsible for grandchildrenGrandparents (60 years and over) White / Caucasian 47 30.0% Responsible for grandchildren109 70.0% Not responsible for grandchildrenWhite alone, not Hispanic / Latino 47 28.7% Responsible for grandchildren116 71.3% Not responsible for grandchildren