Races in Waltham, Massachusetts (MA) Detailed Stats
Data:
Races - White alone (%)
Races - White alone (% change since 2000)
Races - Black alone (%)
Races - Black alone (% change since 2000)
Races - American Indian alone (%)
Races - American Indian alone (% change since 2000)
Races - Asian alone (%)
Races - Asian alone (% change since 2000)
Races - Hispanic (%)
Races - Hispanic (% change since 2000)
Races - Native Hawaiian and Other Pacific Islander alone (%)
Races - Native Hawaiian and Other Pacific Islander alone (% change since 2000)
Races - Two or more races(%)
Races - Two or more races(% change since 2000)
Races - Other race alone (%)
Races - Other race alone (% change since 2000)
Racial diversity
Place of birth - Born in state of residence (%)
Place of birth - Born in state of residence (%) - White
Place of birth - Born in state of residence (%) - Black or African American
Place of birth - Born in state of residence (%) - Asian
Place of birth - Born in state of residence (%) - Hispanic or Latino
Place of birth - Born in state of residence (%) - American Indian and Alaska Native
Place of birth - Born in state of residence (%) - Multirace
Place of birth - Born in state of residence (%) - Other Race
Place of birth - Born in other state (%)
Place of birth - Born in other state (%) - White
Place of birth - Born in other state (%) - Black or African American
Place of birth - Born in other state (%) - Asian
Place of birth - Born in other state (%) - Hispanic or Latino
Place of birth - Born in other state (%) - American Indian and Alaska Native
Place of birth - Born in other state (%) - Multirace
Place of birth - Born in other state (%) - Other Race
Place of birth - Native, outside of US (%)
Place of birth - Native, outside of US (%) - White
Place of birth - Native, outside of US (%) - Black or African American
Place of birth - Native, outside of US (%) - Asian
Place of birth - Native, outside of US (%) - Hispanic or Latino
Place of birth - Native, outside of US (%) - American Indian and Alaska Native
Place of birth - Native, outside of US (%) - Multirace
Place of birth - Native, outside of US (%) - Other Race
Place of birth - Foreign born (%)
Place of birth - Foreign born (%) - White
Place of birth - Foreign born (%) - Black or African American
Place of birth - Foreign born (%) - Asian
Place of birth - Foreign born (%) - Hispanic or Latino
Place of birth - Foreign born (%) - American Indian and Alaska Native
Place of birth - Foreign born (%) - Multirace
Place of birth - Foreign born (%) - Other Race
Residents speaking English at home (%)
Residents speaking English at home - Born in the United States (%)
Residents speaking English at home - Native, born elsewhere (%)
Residents speaking English at home - Foreign born (%)
Residents speaking Spanish at home (%)
Residents speaking Spanish at home - Born in the United States (%)
Residents speaking Spanish at home - Native, born elsewhere (%)
Residents speaking Spanish at home - Foreign born (%)
Residents speaking other language at home (%)
Residents speaking other language at home - Born in the United States (%)
Residents speaking other language at home - Native, born elsewhere (%)
Residents speaking other language at home - Foreign born (%)
Marital status - Never married (%)
Marital status - Now married (%)
Marital status - Separated (%)
Marital status - Widowed (%)
Marital status - Divorced (%)
Ancestries Reported - Arab (%)
Ancestries Reported - Czech (%)
Ancestries Reported - Danish (%)
Ancestries Reported - Dutch (%)
Ancestries Reported - English (%)
Ancestries Reported - French (%)
Ancestries Reported - French Canadian (%)
Ancestries Reported - German (%)
Ancestries Reported - Greek (%)
Ancestries Reported - Hungarian (%)
Ancestries Reported - Irish (%)
Ancestries Reported - Italian (%)
Ancestries Reported - Lithuanian (%)
Ancestries Reported - Norwegian (%)
Ancestries Reported - Polish (%)
Ancestries Reported - Portuguese (%)
Ancestries Reported - Russian (%)
Ancestries Reported - Scotch-Irish (%)
Ancestries Reported - Scottish (%)
Ancestries Reported - Slovak (%)
Ancestries Reported - Subsaharan African (%)
Ancestries Reported - Swedish (%)
Ancestries Reported - Swiss (%)
Ancestries Reported - Ukrainian (%)
Ancestries Reported - United States (%)
Ancestries Reported - Welsh (%)
Ancestries Reported - West Indian (%)
Ancestries Reported - Other (%)
Geographical mobility - Same house 1 year ago (%)
Geographical mobility - Same house 1 year ago (%) - White
Geographical mobility - Same house 1 year ago (%) - Black or African American
Geographical mobility - Same house 1 year ago (%) - Asian
Geographical mobility - Same house 1 year ago (%) - Hispanic or Latino
Geographical mobility - Same house 1 year ago (%) - American Indian and Alaska Native
Geographical mobility - Same house 1 year ago (%) - Multirace
Geographical mobility - Same house 1 year ago (%) - Other Race
Geographical mobility - Moved within same county (%)
Geographical mobility - Moved within same county (%) - White
Geographical mobility - Moved within same county (%) - Black or African American
Geographical mobility - Moved within same county (%) - Asian
Geographical mobility - Moved within same county (%) - Hispanic or Latino
Geographical mobility - Moved within same county (%) - American Indian and Alaska Native
Geographical mobility - Moved within same county (%) - Multirace
Geographical mobility - Moved within same county (%) - Other Race
Geographical mobility - Moved from different county within same state (%)
Geographical mobility - Moved from different county within same state (%) - White
Geographical mobility - Moved from different county within same state (%) - Black or African American
Geographical mobility - Moved from different county within same state (%) - Asian
Geographical mobility - Moved from different county within same state (%) - Hispanic or Latino
Geographical mobility - Moved from different county within same state (%) - American Indian and Alaska Native
Geographical mobility - Moved from different county within same state (%) - Multirace
Geographical mobility - Moved from different county within same state (%) - Other Race
Geographical mobility - Moved from different state (%)
Geographical mobility - Moved from different state (%) - White
Geographical mobility - Moved from different state (%) - Black or African American
Geographical mobility - Moved from different state (%) - Asian
Geographical mobility - Moved from different state (%) - Hispanic or Latino
Geographical mobility - Moved from different state (%) - American Indian and Alaska Native
Geographical mobility - Moved from different state (%) - Multirace
Geographical mobility - Moved from different state (%) - Other Race
Geographical mobility - Moved from abroad (%)
Geographical mobility - Moved from abroad (%) - White
Geographical mobility - Moved from abroad (%) - Black or African American
Geographical mobility - Moved from abroad (%) - Asian
Geographical mobility - Moved from abroad (%) - Hispanic or Latino
Geographical mobility - Moved from abroad (%) - American Indian and Alaska Native
Geographical mobility - Moved from abroad (%) - Multirace
Geographical mobility - Moved from abroad (%) - Other Race
Place of birth for the foreign-born population - Ireland (%)
Place of birth for the foreign-born population - Denmark (%)
Place of birth for the foreign-born population - Norway (%)
Place of birth for the foreign-born population - Sweden (%)
Place of birth for the foreign-born population - United Kingdom (%)
Place of birth for the foreign-born population - England (%)
Place of birth for the foreign-born population - Scotland (%)
Place of birth for the foreign-born population - Other Northern Europe (%)
Place of birth for the foreign-born population - Austria (%)
Place of birth for the foreign-born population - Belgium (%)
Place of birth for the foreign-born population - France (%)
Place of birth for the foreign-born population - Germany (%)
Place of birth for the foreign-born population - Netherlands (%)
Place of birth for the foreign-born population - Switzerland (%)
Place of birth for the foreign-born population - Other Western Europe (%)
Place of birth for the foreign-born population - Greece (%)
Place of birth for the foreign-born population - Italy (%)
Place of birth for the foreign-born population - Portugal (%)
Place of birth for the foreign-born population - Spain (%)
Place of birth for the foreign-born population - Other Southern Europe (%)
Place of birth for the foreign-born population - Albania (%)
Place of birth for the foreign-born population - Belarus (%)
Place of birth for the foreign-born population - Bosnia and Herzegovina (%)
Place of birth for the foreign-born population - Bulgaria (%)
Place of birth for the foreign-born population - Croatia (%)
Place of birth for the foreign-born population - Czechoslovakia (%)
Place of birth for the foreign-born population - Hungary (%)
Place of birth for the foreign-born population - Latvia (%)
Place of birth for the foreign-born population - Lithuania (%)
Place of birth for the foreign-born population - North Macedonia (Macedonia) (%)
Place of birth for the foreign-born population - Moldova (%)
Place of birth for the foreign-born population - Poland (%)
Place of birth for the foreign-born population - Romania (%)
Place of birth for the foreign-born population - Russia (%)
Place of birth for the foreign-born population - Serbia (%)
Place of birth for the foreign-born population - Ukraine (%)
Place of birth for the foreign-born population - Other Eastern Europe (%)
Place of birth for the foreign-born population - China (%)
Place of birth for the foreign-born population - Hong Kong (%)
Place of birth for the foreign-born population - Taiwan (%)
Place of birth for the foreign-born population - Japan (%)
Place of birth for the foreign-born population - Korea (%)
Place of birth for the foreign-born population - Other Eastern Asia (%)
Place of birth for the foreign-born population - Afghanistan (%)
Place of birth for the foreign-born population - Bangladesh (%)
Place of birth for the foreign-born population - India (%)
Place of birth for the foreign-born population - Iran (%)
Place of birth for the foreign-born population - Kazakhstan (%)
Place of birth for the foreign-born population - Nepal (%)
Place of birth for the foreign-born population - Pakistan (%)
Place of birth for the foreign-born population - Sri Lanka (%)
Place of birth for the foreign-born population - Uzbekistan (%)
Place of birth for the foreign-born population - Other South Central Asia (%)
Place of birth for the foreign-born population - Burma (%)
Place of birth for the foreign-born population - Cambodia (%)
Place of birth for the foreign-born population - Indonesia (%)
Place of birth for the foreign-born population - Laos (%)
Place of birth for the foreign-born population - Malaysia (%)
Place of birth for the foreign-born population - Philippines (%)
Place of birth for the foreign-born population - Singapore (%)
Place of birth for the foreign-born population - Thailand (%)
Place of birth for the foreign-born population - Vietnam (%)
Place of birth for the foreign-born population - Other South Eastern Asia (%)
Place of birth for the foreign-born population - Armenia (%)
Place of birth for the foreign-born population - Iraq (%)
Place of birth for the foreign-born population - Israel (%)
Place of birth for the foreign-born population - Jordan (%)
Place of birth for the foreign-born population - Kuwait (%)
Place of birth for the foreign-born population - Lebanon (%)
Place of birth for the foreign-born population - Saudi Arabia (%)
Place of birth for the foreign-born population - Syria (%)
Place of birth for the foreign-born population - Turkey (%)
Place of birth for the foreign-born population - Yemen (%)
Place of birth for the foreign-born population - Other Western Asia (%)
Place of birth for the foreign-born population - Eritrea (%)
Place of birth for the foreign-born population - Ethiopia (%)
Place of birth for the foreign-born population - Kenya (%)
Place of birth for the foreign-born population - Somalia (%)
Place of birth for the foreign-born population - Uganda (%)
Place of birth for the foreign-born population - Zimbabwe (%)
Place of birth for the foreign-born population - Other Eastern Africa (%)
Place of birth for the foreign-born population - Cameroon (%)
Place of birth for the foreign-born population - Congo (%)
Place of birth for the foreign-born population - Democratic Republic of Congo (Zaire) (%)
Place of birth for the foreign-born population - Other Middle Africa (%)
Place of birth for the foreign-born population - Egypt (%)
Place of birth for the foreign-born population - Morocco (%)
Place of birth for the foreign-born population - Sudan (%)
Place of birth for the foreign-born population - Other Northern Africa (%)
Place of birth for the foreign-born population - South Africa (%)
Place of birth for the foreign-born population - Other Southern Africa (%)
Place of birth for the foreign-born population - Cabo Verde (%)
Place of birth for the foreign-born population - Ghana (%)
Place of birth for the foreign-born population - Liberia (%)
Place of birth for the foreign-born population - Nigeria (%)
Place of birth for the foreign-born population - Senegal (%)
Place of birth for the foreign-born population - Sierra Leone (%)
Place of birth for the foreign-born population - Other Western Africa (%)
Place of birth for the foreign-born population - Australia (%)
Place of birth for the foreign-born population - New Zealand (%)
Place of birth for the foreign-born population - Fiji (%)
Place of birth for the foreign-born population - Micronesia (%)
Place of birth for the foreign-born population - Bahamas (%)
Place of birth for the foreign-born population - Barbados (%)
Place of birth for the foreign-born population - Cuba (%)
Place of birth for the foreign-born population - Dominica (%)
Place of birth for the foreign-born population - Dominican Republic (%)
Place of birth for the foreign-born population - Grenada (%)
Place of birth for the foreign-born population - Haiti (%)
Place of birth for the foreign-born population - Jamaica (%)
Place of birth for the foreign-born population - St. Vincent and the Grenadines (%)
Place of birth for the foreign-born population - Trinidad and Tobago (%)
Place of birth for the foreign-born population - West Indies (%)
Place of birth for the foreign-born population - Other Caribbean (%)
Place of birth for the foreign-born population - Belize (%)
Place of birth for the foreign-born population - Costa Rica (%)
Place of birth for the foreign-born population - El Salvador (%)
Place of birth for the foreign-born population - Guatemala (%)
Place of birth for the foreign-born population - Honduras (%)
Place of birth for the foreign-born population - Mexico (%)
Place of birth for the foreign-born population - Nicaragua (%)
Place of birth for the foreign-born population - Panama (%)
Place of birth for the foreign-born population - Other Central America (%)
Place of birth for the foreign-born population - Argentina (%)
Place of birth for the foreign-born population - Bolivia (%)
Place of birth for the foreign-born population - Brazil (%)
Place of birth for the foreign-born population - Chile (%)
Place of birth for the foreign-born population - Colombia (%)
Place of birth for the foreign-born population - Ecuador (%)
Place of birth for the foreign-born population - Guyana (%)
Place of birth for the foreign-born population - Peru (%)
Place of birth for the foreign-born population - Uruguay (%)
Place of birth for the foreign-born population - Venezuela (%)
Place of birth for the foreign-born population - Other South America (%)
Place of birth for the foreign-born population - Canada (%)
Place of birth for the foreign-born population - Other Northern America (%)
Place of birth for the foreign-born population - Other (%)
Latest news about races in Waltham, MA collected exclusively by city-data.com from local newspapers, TV, and radio stations
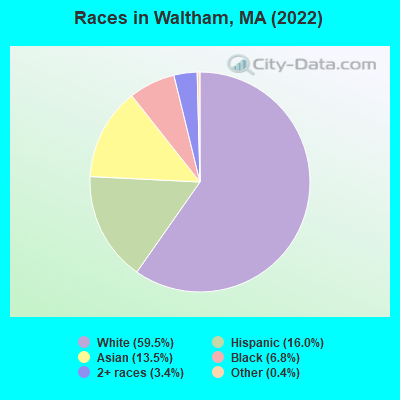
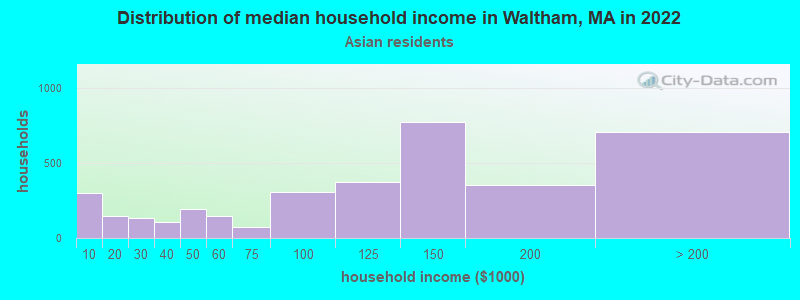
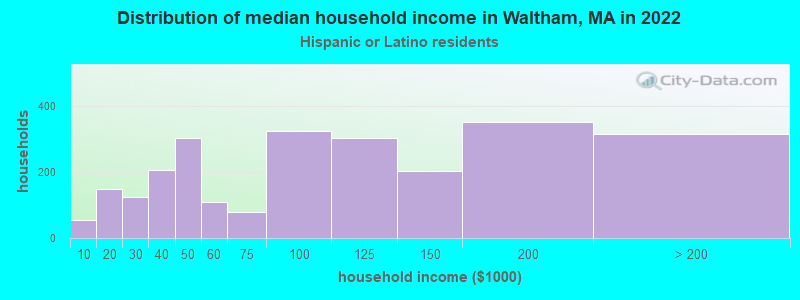
According to 2022 data, the most numerous races in Waltham, MA are White alone (38,336 residents), Hispanic (10,321 residents), and Asian alone (8,715 residents). 67.2% of Waltham residents speak English at home. 26.5% of Waltham, MA residents are foreign-born (11.4% born in Asia, 8.3% born in Latin America, 2.8% born in Europe), which is 32.2% greater than the foreign-born rate of 18.0% across the entire state of Massachusetts.
Race distribution in Waltham
2000 2022
5,198,359 81.9% White alone 428,729 6.8% Hispanic 318,329 5.0% Black alone 236,786 3.7% Asian alone 110,338 1.7% Two or more races 43,586 0.7% Other race alone 11,264 0.2% American Indian alone 1,706 0.03% Native Hawaiian and Other
4,676,627 67.0% White alone 911,038 13.0% Hispanic 501,463 7.2% Asian alone 459,740 6.6% Black alone 341,889 4.9% Two or more races 84,403 1.2% Other race alone 5,838 0.08% American Indian alone 976 0.01% Native Hawaiian and Other
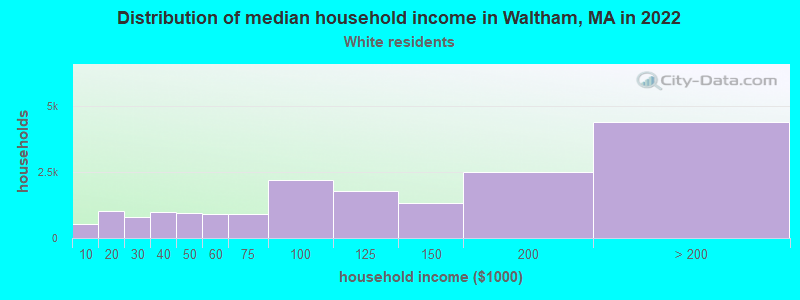
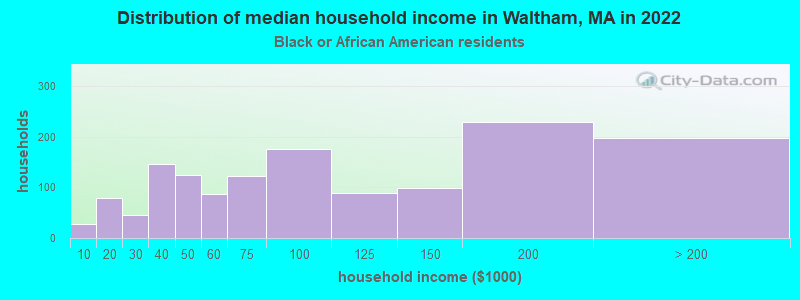
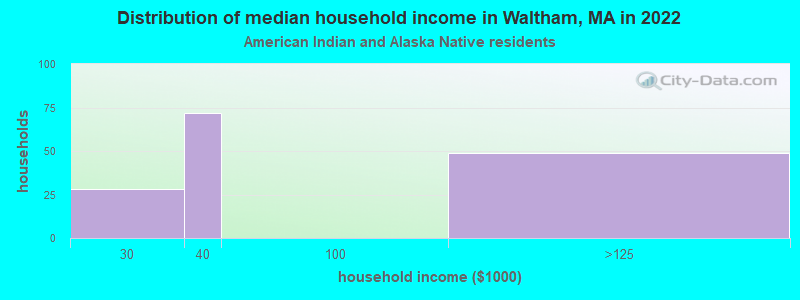
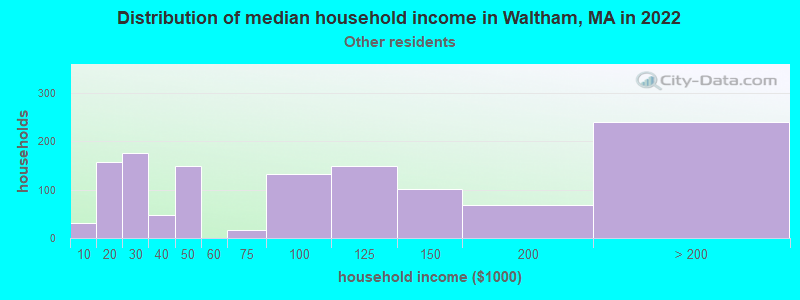
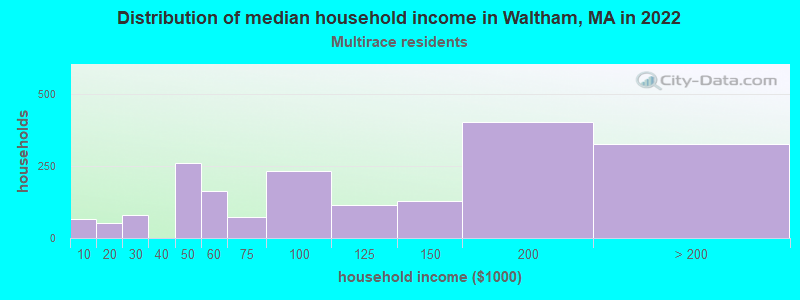
Income and house value in Waltham Median household income in 2022 $112,453 White non-Hispanic householders$92,486 Black householders$122,994 Asian householders$78,674 Some other race householders$111,173 Two or more races householders$93,146 Hispanic or Latino race householdersMedian 2022 house value $737,534 White Non-Hispanic householders$626,977 Black or African American householders $673,818 Asian householders$472,778 Some other race householders$759,646 Two or more races householders$624,940 Hispanic or Latino householders
Median age by race in Waltham
39.9 Median age for White residents39.5 40.5 33.9 Median age for Black or African American residents33.7 32.6 65.3 Median age for American Indian / Alaska Native residents64.8 86.4 30.0 Median age for Asian residents30.0 30.0 15.3 Median age for Native Hawaiian / Pacific Islander residents15.3 -508,717,948.2 26.8 Median age for Other race residents25.6 28.1 28.7 Median age for Two or more races residents30.1 28.5 40.5 Median age for White alone residents39.7 41.7 27.3 Median age for Hispanic or Latino residents27.9 26.7
Owner/renter occupied households by race in Waltham
House owners and renters - White residents 10,205 55.8% Owner occupied8,094 44.2% Renter occupiedHouse owners and renters - Black or African American residents 441 32.4% Owner occupied918 67.6% Renter occupiedHouse owners and renters - American Indian / Alaska Native residents 193 100.0% Renter occupiedHouse owners and renters - Asian residents 1,316 37.5% Owner occupied2,191 62.5% Renter occupiedHouse owners and renters - Native Hawaiian / Pacific Islander residents 23 100.0% Renter occupiedHouse owners and renters - Other race residents 135 11.3% Owner occupied1,062 88.7% Renter occupiedHouse owners and renters - Two or more races residents 561 29.1% Owner occupied1,366 70.9% Renter occupiedHouse owners and renters - White alone residents 10,135 56.8% Owner occupied7,703 43.2% Renter occupiedHouse owners and renters - Hispanic or Latino residents 394 15.2% Owner occupied2,193 84.8% Renter occupied
Language usage in Waltham
English speakers - Total 67.2% of residents of Waltham speak English at home.
11.5% of residents speak Spanish at home 4,519 63.8% Speak English very well2,563 36.2% Speak English less than very well21.2% of residents speak other language at home 9,218 70.8% Speak English very well3,808 29.2% Speak English less than very well
English speakers - Born in the United States 89.3% of residents of Waltham speak English at home.
3.3% of residents speak Spanish at home 411 85.1% Speak English very well72 14.9% Speak English less than very well7.5% of residents speak other language at home 971 89.1% Speak English very well119 10.9% Speak English less than very well
English speakers - Native, born elsewhere 27.6% of residents of Waltham speak English at home.
68.1% of residents speak Spanish at home 602 71.0% Speak English very well246 29.0% Speak English less than very well6.7% of residents speak other language at home 33 39.8% Speak English very well50 60.2% Speak English less than very well
English speakers - Foreign-born 16.3% of residents of Waltham speak English at home.
24.1% of residents speak Spanish at home 1,975 48.2% Speak English very well2,119 51.8% Speak English less than very well59.6% of residents speak other language at home 6,595 65.2% Speak English very well3,519 34.8% Speak English less than very well
White (Caucasian) - Speak only English Native:
94.2% (32,233)Foreign-born:
21.2% (938)
White (Caucasian) - Speak another language Native:
5.7% (1,962)Foreign-born:
79.0% (3,499)
Black or African American - Speak only English Native:
79.0% (1,849)Foreign-born:
39.6% (734)
Black or African American - Speak another language Native:
20.8% (488)Foreign-born:
60.9% (1,130)
American Indian / Alaska Native - Speak another language Native:
7.2% (10)Foreign-born:
100.0% (230)
Asian - Speak only English Native:
54.7% (1,339)Foreign-born:
12.5% (758)
Asian - Speak another language Native:
45.3% (1,109)Foreign-born:
87.2% (5,279)
Native Hawaiian / Pacific Islander - Speak only English Native:
99.5% (59)Foreign-born:
96.3% (6)
Other race - Speak only English Native:
29.0% (535)Foreign-born:
3.7% (84)
Other race - Speak another language Native:
67.0% (1,237)Foreign-born:
96.0% (2,189)
Two or more races - Speak only English Native:
63.6% (2,373)Foreign-born:
13.8% (292)
Two or more races - Speak another language Native:
37.2% (1,391)Foreign-born:
85.9% (1,814)
White alone - Speak only English Native:
95.6% (31,694)Foreign-born:
21.6% (856)
White alone - Speak another language Native:
4.4% (1,474)Foreign-born:
78.9% (3,125)
Hispanic or Latino - Speak only English Native:
40.3% (1,911)Foreign-born:
8.2% (355)
Hispanic or Latino - Speak another language Native:
59.0% (2,799)Foreign-born:
91.8% (3,990)
Foreign-born residents in Waltham 17,111 residents are foreign born (11.4% Asia , 8.3% Latin America , 2.8% Europe ).
This city:
26.5%Massachusetts:
17.6%
Marital status for residents in Waltham Marital status - White (Caucasian) population 15 years and over
Males 47.7% Never married42.0% Now married1.2% Separated2.9% Widowed6.2% DivorcedFemales 43.6% Never married35.9% Now married1.0% Separated10.2% Widowed9.3% DivorcedWomen who gave birth in the past 12 months Now married:
88.0% (276)Unmarried:
12.0% (38)
Women who did not give birth in the past 12 months Now married:
28.5% (2,844)Unmarried:
71.5% (7,123)
Marital status - Black or African American population 15 years and over
Males 57.4% Never married26.3% Now married3.4% Separated0.0% Widowed12.9% DivorcedFemales 43.4% Never married35.3% Now married3.5% Separated3.0% Widowed14.8% DivorcedWomen who gave birth in the past 12 months Now married:
29.5% (13)Unmarried:
70.5% (30)
Women who did not give birth in the past 12 months Now married:
31.5% (366)Unmarried:
68.5% (794)
Marital status - American Indian / Alaska Native population 15 years and over
Males 27.2% Never married17.6% Now married35.2% Separated10.8% Widowed9.2% DivorcedFemales 13.3% Never married72.2% Now married0.0% Separated0.0% Widowed14.4% DivorcedWomen who did not give birth in the past 12 months Now married:
70.0% (33)Unmarried:
30.0% (14)
Marital status - Asian population 15 years and over
Males 60.6% Never married32.1% Now married0.6% Separated3.9% Widowed2.8% DivorcedFemales 58.0% Never married34.3% Now married1.6% Separated4.3% Widowed1.8% DivorcedWomen who gave birth in the past 12 months Now married:
100.0% (55)Unmarried:
0.0% (0)
Women who did not give birth in the past 12 months Now married:
25.7% (779)Unmarried:
74.3% (2,249)
Marital status - Native Hawaiian / Pacific Islander population 15 years and over
Males 55.3% Never married44.7% Now married0.0% Separated0.0% Widowed0.0% DivorcedFemales 57.1% Never married42.9% Now married0.0% Separated0.0% Widowed0.0% DivorcedWomen who did not give birth in the past 12 months Now married:
42.9% (6)Unmarried:
57.1% (8)
Marital status - Other race population 15 years and over
Males 55.7% Never married36.5% Now married0.0% Separated0.0% Widowed7.8% DivorcedFemales 37.1% Never married35.7% Now married1.4% Separated0.0% Widowed25.9% DivorcedWomen who gave birth in the past 12 months Now married:
100.0% (40)Unmarried:
0.0% (0)
Women who did not give birth in the past 12 months Now married:
30.9% (302)Unmarried:
69.1% (676)
Marital status - Two or more races population 15 years and over
Males 55.9% Never married40.6% Now married0.0% Separated0.0% Widowed3.4% DivorcedFemales 49.3% Never married40.9% Now married1.0% Separated7.1% Widowed1.7% DivorcedWomen who gave birth in the past 12 months Now married:
79.7% (81)Unmarried:
20.3% (20)
Women who did not give birth in the past 12 months Now married:
36.9% (731)Unmarried:
63.1% (1,251)
Marital status - White alone, not Hispanic / Latino population 15 years and over
Males 47.9% Never married42.0% Now married1.2% Separated2.9% Widowed6.0% DivorcedFemales 42.5% Never married36.4% Now married1.1% Separated10.6% Widowed9.5% DivorcedWomen who gave birth in the past 12 months Now married:
86.8% (253)Unmarried:
13.2% (38)
Women who did not give birth in the past 12 months Now married:
29.6% (2,768)Unmarried:
70.4% (6,592)
Marital status - Hispanic or Latino population 15 years and over
Males 55.6% Never married34.8% Now married2.5% Separated0.3% Widowed6.8% DivorcedFemales 44.4% Never married38.5% Now married1.0% Separated5.0% Widowed11.1% DivorcedWomen who gave birth in the past 12 months Now married:
88.6% (120)Unmarried:
11.4% (15)
Women who did not give birth in the past 12 months Now married:
33.1% (882)Unmarried:
66.9% (1,786)
Ancestries in Waltham
3,242 10.1% Irish2,946 9.2% Italian1,339 4.2% Armenian1,181 3.7% English859 2.7% American845 2.6% French Canadian682 2.1% Haitian519 1.6% Ugandan486 1.5% Polish459 1.4% European456 1.4% German387 1.2% Iranian355 1.1% Jamaican280 0.9% Ukrainian259 0.8% Canadian240 0.7% African214 0.7% French208 0.6% Russian195 0.6% Eastern European182 0.6% Scottish175 0.5% Greek118 0.4% Bulgarian103 0.3% Brazilian101 0.3% Lithuanian97 0.3% Northern European95 0.3% Swedish86 0.3% Albanian84 0.3% Turkish82 0.3% Palestinian80 0.2% Nigerian80 0.2% Portuguese79 0.2% Moroccan56 0.2% British53 0.2% Finnish48 0.1% Kenyan46 0.1% Slavic40 0.1% Norwegian38 0.1% Swiss29 0.09% Scotch-Irish26 0.08% Dutch25 0.08% Hungarian23 0.07% Celtic23 0.07% Egyptian22 0.07% Romanian21 0.07% Czechoslovakian20 0.06% Cape Verdean15 0.05% German Russian14 0.04% Israeli14 0.04% Zimbabwean12 0.04% Cypriot11 0.03% Lebanese9 0.03% Iraqi9 0.03% Yugoslavian8 0.02% Czech7 0.02% Trinidadian and Tobagonian5 0.02% Welsh5 0.02% British West Indian5 0.02% Icelander3 0.01% Somali3 0.01% Ghanaian3 0.01% South African2 0.01% Barbadian
Geographical mobility in Waltham Same house 1 year ago 33,829 85.0% White (Caucasian)3,684 83.4% Black or African American368 80.0% American Indian / Alaska Native6,096 70.0% Asian57 87.8% Native Hawaiian / Pacific Islander3,807 83.3% Other race4,917 75.3% Two or more races32,262 84.7% White alone, not Hispanic / Latino8,128 79.7% Hispanic or LatinoMoved within same county 2,496 6.3% White / Caucasian197 4.5% Black or African American37 8.1% American Indian / Alaska Native1,088 12.5% Asian313 6.9% Other race755 11.6% Two or more races2,459 6.5% White alone, not Hispanic / Latino786 7.7% Hispanic or LatinoMoved within same state 1,591 4.0% White / Caucasian242 5.5% Black or African American285 3.3% Asian193 4.2% Other race145 2.2% Two or more races1,561 4.1% White alone, not Hispanic / Latino303 3.0% Hispanic or LatinoMoved from different state 1,489 3.7% White / Caucasian273 6.2% Black or African American6 1.3% American Indian / Alaska Native539 6.2% Asian8 13.0% Native Hawaiian / Pacific Islander123 2.7% Other race316 4.8% Two or more races1,399 3.7% White alone, not Hispanic / Latino455 4.5% Hispanic or LatinoMoved from abroad 433 1.1% White100 2.3% Black or African American40 8.6% American Indian / Alaska Native685 7.9% Asian66 1.4% Other race468 7.2% Two or more races380 1.0% White alone, not Hispanic / Latino604 5.9% Hispanic or Latino
Children Nativity (place of birth) in Waltham
Children under 6 years - Living with two parents Both parents native 1,384 100.0% NativeBoth parents foreign-born 552 84.3% Native102 15.7% Foreign-bornOne native, one foreign-born parent 702 100.0% NativeChildren under 6 years - Living with one parent Native parent 479 100.0% NativeForeign-born parent 177 77.3% Native52 22.7% Foreign-bornChildren 6 to 17 years - Living with two parents Both parents native 1,662 100.0% NativeBoth parents foreign-born 582 70.4% Native245 29.6% Foreign-bornOne native, one foreign-born parent 675 100.0% NativeChildren 6 to 17 years - Living with one parent Native parent 733 100.0% NativeForeign-born parent 592 59.8% Native397 40.2% Foreign-born
Place of birth for residents in Waltham 7,649 Asia6,237 Americas5,529 Latin America3,163 Eastern Asia2,975 Central America2,910 China2,767 South Central Asia1,889 Europe1,401 Caribbean1,316 Africa1,153 South America1,126 Eastern Africa1,082 Western Asia833 Eastern Europe707 Northern America619 South Eastern Asia483 Southern Europe406 Northern Europe150 Western Europe120 Western Africa69 Northern Africa18 Oceania18 Australia and New Zealand Subregion2,460 Guatemala2,373 China1,819 India900 Uganda707 Canada649 Haiti442 Taiwan408 Dominican Republic376 Italy372 Iran371 Lebanon351 Pakistan348 El Salvador312 Russia306 Brazil301 Vietnam295 Peru254 Colombia240 Armenia212 Jamaica202 Korea185 Turkey184 Ukraine154 Mexico138 Ireland137 Zimbabwe112 England94 Syria94 Hong Kong85 Jordan84 Kenya82 United Kingdom81 Venezuela71 Trinidad and Tobago71 Laos70 Germany68 Thailand67 Chile66 Kazakhstan64 Belarus62 Bolivia62 Nigeria61 Bangladesh58 Philippines57 France53 Morocco51 Greece50 Japan50 Cuba48 Poland45 Nepal45 Spain44 Ecuador43 Bulgaria43 Indonesia42 Albania41 Argentina40 Sri Lanka35 Israel33 Moldova32 Romania31 Senegal31 Cambodia29 Hungary26 Burma (Myanmar)22 Switzerland21 Azerbaijan20 Lithuania20 Iraq18 Australia17 Saudi Arabia15 Egypt13 Sweden12 Nicaragua11 Singapore10 Portugal9 St. Lucia6 Malaysia5 Norway5 Ghana3 Somalia
Grandparents responsible for own grandchildren in Waltham
Grandparents (30 to 59 years) White / Caucasian 38 64.4% Responsible for grandchildren21 35.6% Not responsible for grandchildrenAsian 20 100.0% Not responsible for grandchildrenOther race 23 28.5% Responsible for grandchildren57 71.5% Not responsible for grandchildrenTwo or more races 35 100.0% Responsible for grandchildrenWhite alone, not Hispanic / Latino 34 59.6% Responsible for grandchildren23 40.4% Not responsible for grandchildrenHispanic or Latino 128 88.7% Responsible for grandchildren16 11.3% Not responsible for grandchildrenGrandparents (60 years and over) White / Caucasian 106 27.1% Responsible for grandchildren285 72.9% Not responsible for grandchildrenAsian 82 100.0% Not responsible for grandchildrenTwo or more races 26 100.0% Not responsible for grandchildrenWhite alone, not Hispanic / Latino 106 27.3% Responsible for grandchildren283 72.7% Not responsible for grandchildrenHispanic or Latino 46 100.0% Not responsible for grandchildren