Estimated zip code population in 2022: 15,342 Zip code population in 2010: 13,606 Zip code population in 2000: 13,435
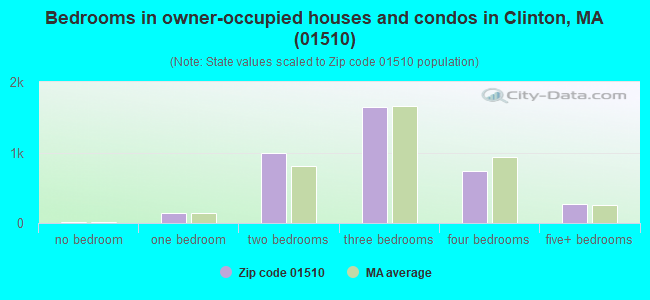
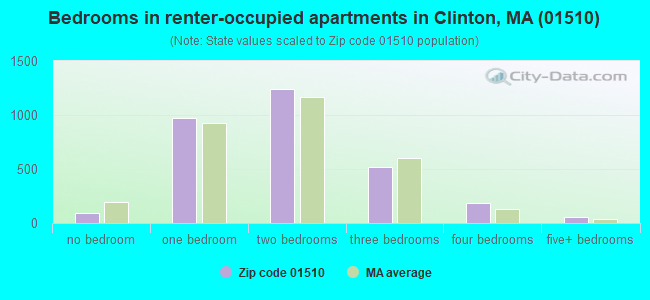
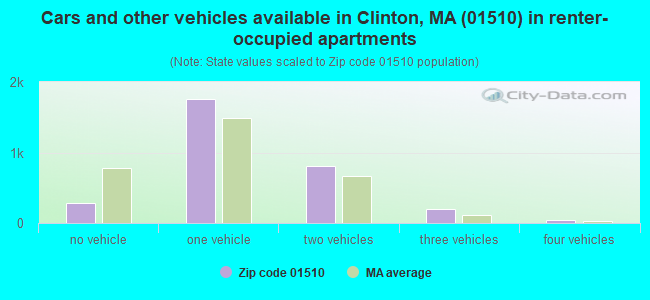
Houses and condos: 7,188 Renter-occupied apartments: 3,066
% of renters here:
45%
State:
38%
March 2022 cost of living index in zip code 01510: 125.6 (high, U.S. average is 100)
Land area: 5.7 sq. mi. Water area: 1.6 sq. mi.
Population density: 2,713 people per square mile
(average).
OSM Map
Google Map
MSN Map
OSM Map
General Map
Google Map
MSN Map
OSM Map
Google Map
MSN Map
OSM Map
Google Map
MSN Map
Please wait while loading the map...
Real estate property taxes paid for housing units in 2022:
This zip code:
1.2% ($4,420)
Massachusetts:
1.0% ($5,536)
Median real estate property taxes paid for housing units with mortgages in 2022: $4,354 (1.2%) Median real estate property taxes paid for housing units with no mortgage in 2022: $4,546 (1.4%)
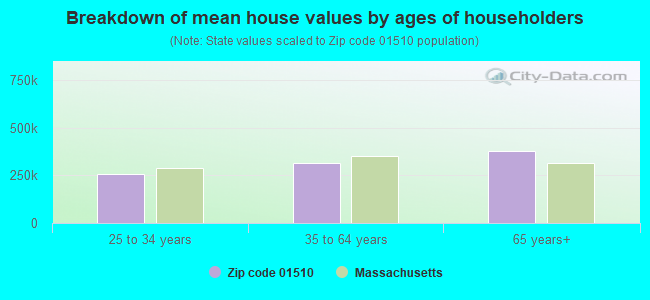
Estimated median house/condo value in 2022: $363,870
01510:
$363,870
Massachusetts:
$534,700
According to our research of Massachusetts and other state lists, there were 9 registered sex offenders living in 01510 zip code as of June 02, 2024. The ratio of all residents to sex offenders in zip code 01510 is 1,551 to 1. The ratio of registered sex offenders to all residents in this zip code is near the state average.
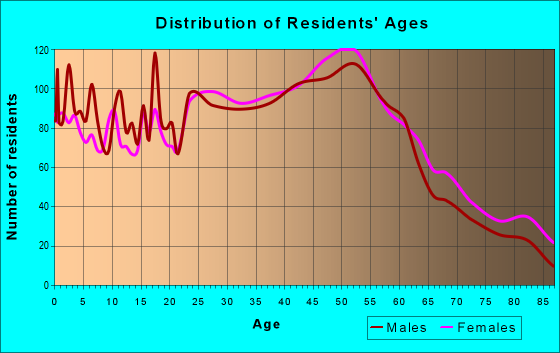
Median resident age:
This zip code:
38.5 years
Massachusetts median age:
40.3 years
Average household size:
This zip code:
2.2 people
Massachusetts:
2.4 people
Averages for the 2020 tax year for zip code 01510, filed in 2021:
Average Adjusted Gross Income (AGI) in 2020: $63,569 (Individual Income Tax Returns)
Here:
$63,569
State:
$105,130
Salary/wage: $57,964 (reported on 84.4% of returns)
Here:
$57,964
State:
$82,951
(% of AGI for various income ranges: 1204.6% for AGIs below $25k, 3716.3% for AGIs $25k-50k, 6637.7% for AGIs $50k-75k, 10095.6% for AGIs $75k-100k, 19531.1% for AGIs $100k-200k, 63426.7% for AGIs over 200k)
Taxable interest for individuals: $688 (reported on 37.3% of returns)
This zip code:
$688
Massachusetts:
$2,361
(% of AGI for various income ranges: 21.9% for AGIs below $25k, 14.2% for AGIs $25k-50k, 28.0% for AGIs $50k-75k, 49.2% for AGIs $75k-100k, 89.6% for AGIs $100k-200k, 401.1% for AGIs over 200k)
Ordinary dividends: $3,271 (reported on 15.2% of returns)
Here:
$3,271
State:
$10,365
(% of AGI for various income ranges: 21.6% for AGIs below $25k, 19.0% for AGIs $25k-50k, 43.4% for AGIs $50k-75k, 54.2% for AGIs $75k-100k, 188.9% for AGIs $100k-200k, 1528.9% for AGIs over 200k)
Net capital gain/loss in AGI: +$10,281 (reported on 13.0% of returns)
Here:
+$10,281
State:
+$48,178
(% of AGI for various income ranges: 11.4% for AGIs below $25k, 11.0% for AGIs $25k-50k, 57.8% for AGIs $50k-75k, 150.3% for AGIs $75k-100k, 368.3% for AGIs $100k-200k, 7391.1% for AGIs over 200k)
Profit/loss from business: +$12,570 (reported on 12.9% of returns)
Here:
+$12,570
State:
+$20,792
(% of AGI for various income ranges: 138.8% for AGIs below $25k, 125.5% for AGIs $25k-50k, 168.3% for AGIs $50k-75k, 287.6% for AGIs $75k-100k, 373.7% for AGIs $100k-200k, 3556.7% for AGIs over 200k)
Taxable individual retirement arrangement distribution: $15,613 (reported on 8.1% of returns)
01510:
$15,613
Massachusetts:
$22,790
(% of AGI for various income ranges: 79.6% for AGIs below $25k, 88.0% for AGIs $25k-50k, 160.7% for AGIs $50k-75k, 257.3% for AGIs $75k-100k, 503.7% for AGIs $100k-200k, 1156.7% for AGIs over 200k)
Total itemized deductions: $23,258 (reported on 8.8% of returns)
Here:
$23,258
State:
$36,722
(% of AGI for various income ranges: 72.3% for AGIs below $25k, 91.2% for AGIs $25k-50k, 312.0% for AGIs $50k-75k, 554.4% for AGIs $75k-100k, 770.8% for AGIs $100k-200k, 2660.0% for AGIs over 200k)
Charity contributions: $3,998 (reported on 6.1% of returns)
Here:
$3,998
State:
$12,529
(% of AGI for various income ranges: 2.4% for AGIs below $25k, 6.7% for AGIs $25k-50k, 28.6% for AGIs $50k-75k, 44.9% for AGIs $75k-100k, 113.2% for AGIs $100k-200k, 582.2% for AGIs over 200k)
Taxes paid: $7,955 (reported on 8.8% of returns)
01510:
$7,955
State:
$8,782
(% of AGI for various income ranges: 14.6% for AGIs below $25k, 25.5% for AGIs $25k-50k, 106.7% for AGIs $50k-75k, 202.7% for AGIs $75k-100k, 300.8% for AGIs $100k-200k, 801.1% for AGIs over 200k)
Earned income credit: $1,903 (reported on 10.3% of returns)
Here:
$1,903
State:
$1,909
(% of AGI for various income ranges: 65.6% for AGIs below $25k, 40.6% for AGIs $25k-50k)
Percentage of individuals using paid preparers for their 2020 taxes: 92.4%
Here:
92%
State:
92%
(% for various income ranges: 90.0% for AGIs below $25k, 92.5% for AGIs $25k-50k, 93.7% for AGIs $50k-75k, 93.2% for AGIs $75k-100k, 93.6% for AGIs $100k-200k, 96.3% for AGIs over 200k)
Averages for the 2012 tax year for zip code 01510, filed in 2013:
Average Adjusted Gross Income (AGI) in 2012: $51,538 (Individual Income Tax Returns)
Here:
$51,538
State:
$81,425
Salary/wage: $48,601 (reported on 87.5% of returns)
Here:
$48,601
State:
$64,752
(% of AGI for various income ranges: 75.0% for AGIs below $25k, 83.2% for AGIs $25k-50k, 81.2% for AGIs $50k-75k, 85.4% for AGIs $75k-100k, 86.7% for AGIs $100k-200k, 71.9% for AGIs over 200k)
Taxable interest for individuals: $647 (reported on 37.8% of returns)
This zip code:
$647
Massachusetts:
$2,136
(% of AGI for various income ranges: 0.8% for AGIs below $25k, 0.4% for AGIs $25k-50k, 0.6% for AGIs $50k-75k, 0.4% for AGIs $75k-100k, 0.4% for AGIs $100k-200k, 0.7% for AGIs over 200k)
Ordinary dividends: $2,642 (reported on 15.1% of returns)
Here:
$2,642
State:
$9,473
(% of AGI for various income ranges: 0.8% for AGIs below $25k, 0.4% for AGIs $25k-50k, 0.8% for AGIs $50k-75k, 0.3% for AGIs $75k-100k, 0.8% for AGIs $100k-200k, 2.3% for AGIs over 200k)
Net capital gain/loss in AGI: +$4,698 (reported on 11.0% of returns)
Here:
+$4,698
State:
+$31,437
(% of AGI for various income ranges: 0.4% for AGIs $50k-75k, 0.1% for AGIs $75k-100k, 0.8% for AGIs $100k-200k, 7.8% for AGIs over 200k)
Profit/loss from business: +$11,881 (reported on 11.3% of returns)
Here:
+$11,881
State:
+$20,662
(% of AGI for various income ranges: 6.4% for AGIs below $25k, 3.0% for AGIs $25k-50k, 2.0% for AGIs $50k-75k, 1.7% for AGIs $75k-100k, 2.3% for AGIs $100k-200k, 2.0% for AGIs over 200k)
Taxable individual retirement arrangement distribution: $11,038 (reported on 8.7% of returns)
01510:
$11,038
Massachusetts:
$18,892
(% of AGI for various income ranges: 2.9% for AGIs below $25k, 1.9% for AGIs $25k-50k, 2.5% for AGIs $50k-75k, 1.5% for AGIs $75k-100k, 1.9% for AGIs $100k-200k)
Self-employment retirement plans: $12,400 (reported on 0.3% of returns)
01510:
$12,400
Massachusetts:
$20,669
Total itemized deductions: $19,162 (21% of AGI, reported on 32.3% of returns)
Here:
$19,162
State:
$28,907
Here:
20.7% of AGI
State:
18.2% of AGI
(% of AGI for various income ranges: 8.0% for AGIs below $25k, 7.3% for AGIs $25k-50k, 11.2% for AGIs $50k-75k, 13.3% for AGIs $75k-100k, 15.6% for AGIs $100k-200k, 13.0% for AGIs over 200k)
Charity contributions: $1,956 (reported on 26.1% of returns)
Here:
$1,956
State:
$4,208
(% of AGI for various income ranges: 0.5% for AGIs below $25k, 0.6% for AGIs $25k-50k, 1.0% for AGIs $50k-75k, 1.0% for AGIs $75k-100k, 1.3% for AGIs $100k-200k, 1.2% for AGIs over 200k)
Taxes paid: $8,018 (reported on 32.3% of returns)
01510:
$8,018
State:
$13,303
(% of AGI for various income ranges: 1.8% for AGIs below $25k, 2.4% for AGIs $25k-50k, 4.3% for AGIs $50k-75k, 5.6% for AGIs $75k-100k, 7.2% for AGIs $100k-200k, 6.8% for AGIs over 200k)
Earned income credit: $2,011 (reported on 14.5% of returns)
Here:
$2,011
State:
$1,971
(% of AGI for various income ranges: 4.8% for AGIs below $25k, 0.8% for AGIs $25k-50k)
Percentage of individuals using paid preparers for their 2012 taxes: 57.1%
Here:
57%
State:
56%
(% for various income ranges: 54.2% for AGIs below $25k, 57.7% for AGIs $25k-50k, 58.4% for AGIs $50k-75k, 60.0% for AGIs $75k-100k, 58.8% for AGIs $100k-200k, 66.7% for AGIs over 200k)
Averages for the 2004 tax year for zip code 01510, filed in 2005:
Average Adjusted Gross Income (AGI) in 2004: $43,304 (Individual Income Tax Returns)
Here:
$43,304
State:
$62,877
Salary/wage: $41,072 (reported on 88.3% of returns)
Here:
$41,072
State:
$52,969
(% of AGI for various income ranges: 85.0% for AGIs below $10k, 77.3% for AGIs $10k-25k, 85.8% for AGIs $25k-50k, 84.0% for AGIs $50k-75k, 88.8% for AGIs $75k-100k, 79.9% for AGIs over 100k)
Taxable interest for individuals: $940 (reported on 49.6% of returns)
This zip code:
$940
Massachusetts:
$1,945
(% of AGI for various income ranges: 3.5% for AGIs below $10k, 1.7% for AGIs $10k-25k, 1.1% for AGIs $25k-50k, 1.0% for AGIs $50k-75k, 0.8% for AGIs $75k-100k, 0.9% for AGIs over 100k)
Taxable dividends: $1,416 (reported on 18.6% of returns)
Here:
$1,416
State:
$5,323
(% of AGI for various income ranges: 1.9% for AGIs below $10k, 0.7% for AGIs $10k-25k, 0.5% for AGIs $25k-50k, 0.4% for AGIs $50k-75k, 0.5% for AGIs $75k-100k, 0.9% for AGIs over 100k)
Net capital gain/loss: +$5,744 (reported on 14.4% of returns)
Here:
+$5,744
State:
+$20,377
(% of AGI for various income ranges: -1.3% for AGIs below $10k, -0.0% for AGIs $10k-25k, 0.3% for AGIs $25k-50k, 0.8% for AGIs $50k-75k, 0.5% for AGIs $75k-100k, 6.4% for AGIs over 100k)
Profit/loss from business: +$10,473 (reported on 11.0% of returns)
Here:
+$10,473
State:
+$17,837
(% of AGI for various income ranges: 7.1% for AGIs below $10k, 4.8% for AGIs $10k-25k, 2.6% for AGIs $25k-50k, 2.6% for AGIs $50k-75k, 2.0% for AGIs $75k-100k, 2.2% for AGIs over 100k)
IRA payment deduction: $2,580 (reported on 2.1% of returns)
01510:
$2,580
Massachusetts:
$3,100
(% of AGI for various income ranges: 0.2% for AGIs $10k-25k, 0.2% for AGIs $25k-50k, 0.1% for AGIs $50k-75k, 0.1% for AGIs $75k-100k, 0.1% for AGIs over 100k)
Self-employed pension: $7,387 (reported on 0.5% of returns)
Here:
$7,387
Massachusetts:
$14,516
Total itemized deductions: $16,413 (22% of AGI, reported on 35.0% of returns)
Here:
$16,413
State:
$22,573
Here:
22.3% of AGI
State:
19.5% of AGI
(% of AGI for various income ranges: 13.4% for AGIs below $10k, 8.8% for AGIs $10k-25k, 9.4% for AGIs $25k-50k, 14.7% for AGIs $50k-75k, 16.7% for AGIs $75k-100k, 14.9% for AGIs over 100k)
Charity contributions deductions: $1,675 (2% of AGI, reported on 31.5% of returns)
Here:
$1,675
State:
$3,295
Here:
2.2% of AGI
State:
2.7% of AGI
(% of AGI for various income ranges: 0.8% for AGIs below $10k, 0.9% for AGIs $10k-25k, 0.9% for AGIs $25k-50k, 1.3% for AGIs $50k-75k, 1.5% for AGIs $75k-100k, 1.4% for AGIs over 100k)
Total tax: $5,509 (reported on 80.7% of returns)
01510:
$5,509
State:
$11,494
(% of AGI for various income ranges: 2.4% for AGIs below $10k, 4.4% for AGIs $10k-25k, 8.2% for AGIs $25k-50k, 9.6% for AGIs $50k-75k, 10.4% for AGIs $75k-100k, 15.4% for AGIs over 100k)
Earned income credit: $1,450 (reported on 11.7% of returns)
Here:
$1,450
State:
$1,518
Percentage of individuals using paid preparers for their 2004 taxes: 56.6%
Here:
57%
State:
58%
(% for various income ranges: 48.2% for AGIs below $10k, 55.6% for AGIs $10k-25k, 56.0% for AGIs $25k-50k, 61.4% for AGIs $50k-75k, 63.1% for AGIs $75k-100k, 62.3% for AGIs over 100k)
Likely homosexual households (counted as self-reported same-sex unmarried-partner households)
Lesbian couples: 0.3% of all households
Gay men: 0.1% of all households
Household received Food Stamps/SNAP in the past 12 months: 796 Household did not receive Food Stamps/SNAP in the past 12 months: 6,025
Women who had a birth in the past 12 months: 246 (246 now married, 10 unmarried) Women who did not have a birth in the past 12 months: 3,719 (1,333 now married, 2,387 unmarried)
Housing units in zip code 01510 with a mortgage: 2,455 (243 second mortgage, 21 home equity loan, 197 both second mortgage and home equity loan) Houses without a mortgage: 80
Median monthly owner costs for units with a mortgage: $1,984 Median monthly owner costs for units without a mortgage: $774
Residents with income below the poverty level in 2022:
This zip code:
6.2%
Whole state:
10.4%
Residents with income below 50% of the poverty level in 2022:
This zip code:
3.4%
Whole state:
5.1%
Median number of rooms in houses and condos:
Here:
6.4
State:
6.5
Median number of rooms in apartments:
Here:
4.0
State:
4.0
Notable locations in this zip code not listed on our city pages
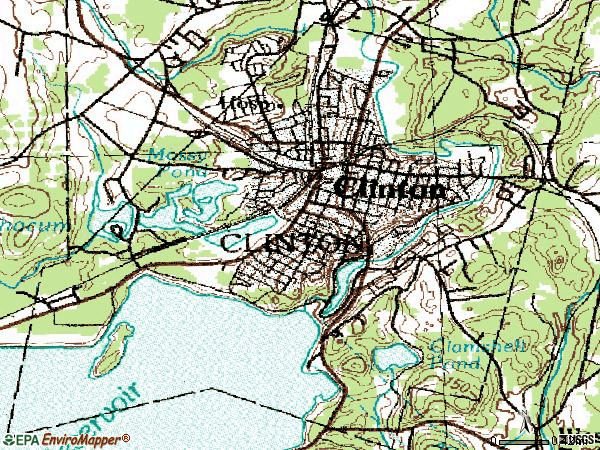
Notable locations in zip code 01510: Woodruff Plaza (A), Clinton Fire Department (B), Clinton District Courthouse (C), Clinton Town Hall (D), Clinton Historical Society Building (E), Clinton Area Chamber of Commerce (F), Bigelow Free Public Library (G). Display/hide their locations on the map
Churches in zip code 01510 include: Trinity Church (A), United Church (B), Saint Nicholas Greek Orthodox Church (C), Saint Johns Church (D), Presbyterian Church USA (E), First Church of Christ Scientist (F), First Baptist Church of Clinton (G), Faith Bible Baptist Church (H), Congregation Shaarei Zedech (I). Display/hide their locations on the map
Parks in zip code 01510 include: Carlisle Park (1), Downtown Clinton Historic District (2), Central Park (3), Fuller Field (4). Display/hide their locations on the map
1,769 married couples with children.
525 single-parent households (40 men, 485 women).
78.0% of residents of 01510 zip code speak English at home.
11.2% of residents speak Spanish at home (51% very well, 21% well, 25% not well, 3% not at all).
7.8% of residents speak other Indo-European language at home (74% very well, 15% well, 9% not well, 1% not at all).
1.6% of residents speak Asian or Pacific Island language at home (50% very well, 27% well, 23% not well).
0.9% of residents speak other language at home (73% very well, 27% well).
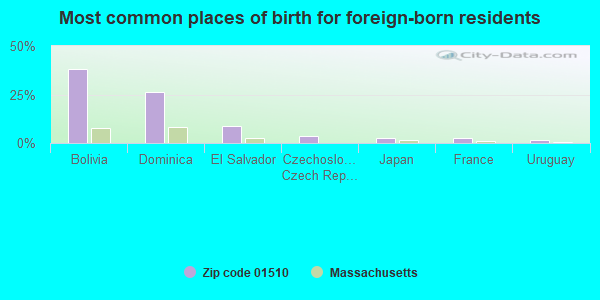
Foreign born population: 2,343 (15.3%) (40.6% of them are naturalized citizens)
This zip code:
15.3%
Whole state:
18.0%
38%Bolivia
26%Dominica
9%El Salvador
4%Czechoslovakia (includes Czech Republic and Slovakia)
3%Japan
2%France
2%Uruguay
15%Irish
11%Italian
9%Portuguese
7%Brazilian
6%European
4%American
3%English
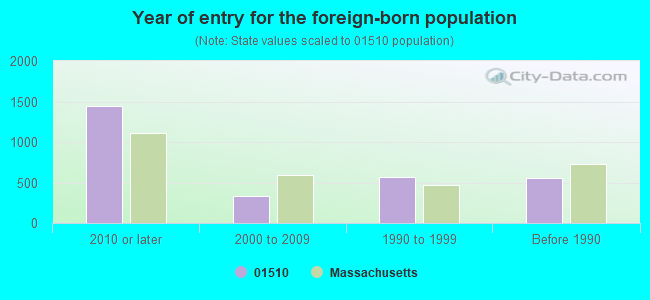
Year of entry for the foreign-born population
1,4462010 or later
3322000 to 2009
5621990 to 1999
553Before 1990
Major facilities with environmental interests located in this zip code:
MWRA CLINTON SEWAGE TREATMENT PLANT (677 HIGH STREET in CLINTON, MA)
AIR MINOR (AIRS/AFS) (Integrated Compliance Information System) - ICIS-01-2002-0192, FORMAL ENFORCEMENT ACTION CRITERIA AND HAZARDOUS AIR POLLUTANT INVENTORY (Inventory of air pollution sources) National Pollutant Discharge Elimination System MAJOR (Tracking pollutant discharge elimination systems) - permit - ICIS-, ENFORCEMENT/COMPLIANCE ACTIVITY (Resource Conservation and Recovery Act (tracking hazardous waste)) - ICIS-01-2002-0192, FORMAL ENFORCEMENT ACTION Business SIC classification: SEWERAGE SYSTEMS Organizations: MWRA-CLINTON FACILITY (CONTACT/OPERATOR)
, METROPOLITAN DISTRICT COMMISSION WAT DIV (CONTACT/OWNER)
Alternative names: CLINTON SEWAGE TREATMENT PLT, MWRA-CLINTON FACILITY, MWRA - CLINTON S T P, MWRA-CLINTON WWTP
MWRA COSGROVE INTAKE FACILITY (301 BOYLSTON ST in CLINTON, MA)
STATE MASTER (MA-EPICS) - RCRAINFO-MAV000012894, HAZARDOUS WASTE PROGRAM National Pollutant Discharge Elimination System NON-MAJOR (Tracking pollutant discharge elimination systems) - permit Business SIC classification: WATER SUPPLY Organizations: MASSACHUSERTTS WATER RESOUCES (CONTACT/OPERATOR)
Alternative names: COSGROVE DISINFECTION FACILITY, MASSACHUSETTS WATER RESOURCES
NYPRO INC (101 UNION STREET in CLINTON, MA)
AIR MINOR (AIRS/AFS) CRITERIA AND HAZARDOUS AIR POLLUTANT INVENTORY (Inventory of air pollution sources) HAZARDOUS WASTE BIENNIAL REPORTER (Resource Conservation and Recovery Act (tracking hazardous waste)) Small Quantity Generators, between 100 kg and 1000 kg of hazardous waste/month (Resource Conservation and Recovery Act (tracking hazardous waste)) - notification (Resource Conservation and Recovery Act (tracking hazardous waste)) TRI REPORTER (Tracking of toxic chemicals releasing facilities) Business SIC classification: PLASTICS PRODUCTS Alternative names: NYPRO INC NYPROMAS
NATIONAL PERFORATING CORP (89 PARKER ST. in CLINTON, MA)
AIR MINOR (AIRS/AFS) SUPERFUND (Superfund database) CRITERIA AND HAZARDOUS AIR POLLUTANT INVENTORY (Inventory of air pollution sources) Conditionally Exempt Small Quantity Generators, less than 100 kg/month of hazardous waste (Resource Conservation and Recovery Act (tracking hazardous waste)) - notification HAZARDOUS WASTE BIENNIAL REPORTER (Resource Conservation and Recovery Act (tracking hazardous waste)) TRI REPORTER (Tracking of toxic chemicals releasing facilities) Business SIC classification: METAL STAMPINGS Business NAICS classification: METAL STAMPING. Organizations: FITCHBURG SCREEN PLATE CO (CONTACT/OWNER)
CLINTON MIDDLE SCHOOL (100 WEST BOYLSTON STREET in CLINTON, MA)
(Geographic Names Information System) (National Center for Education Statistics) - STATE ID-064305
CLINTON ELEM (100 CHURCH STREET in CLINTON, MA)
(National Center for Education Statistics) - STATE ID-064050
CLINTON HIGH SCHOOL (200 WEST BOYLSTON ST in CLINTON, MA)
(National Center for Education Statistics) - STATE ID-064505 Alternative names: CLINTON HIGH SCHOOL NEW, CLINTON SENIOR HIGH
PARKHURST (632 HIGH STREET in CLINTON, MA)
(National Center for Education Statistics) - STATE ID-064035 Organizations: CLINTON (SCHOOL DISTRICT)
NYLCO CORP (530 MAIN ST in CLINTON, MA)
AIR SYNTHETIC MINOR (AIRS/AFS) CRITERIA AND HAZARDOUS AIR POLLUTANT INVENTORY (Inventory of air pollution sources) Small Quantity Generators, between 100 kg and 1000 kg of hazardous waste/month (Resource Conservation and Recovery Act (tracking hazardous waste)) - notification TRI REPORTER (Tracking of toxic chemicals releasing facilities) Business SIC classification: COATED FABRICS, NOT RUBBERIZED Business NAICS classification: COATED AND LAMINATED PAPER MANUFACTURING. Organizations: ROBERT F WORTHEN (CONTACT/OWNER)
Alternative names: NYLCO DIVISION, WORTHEN INDS. INC. NYLCO DIV.
ER BUCK CHAIR COMPANY (450-470R MAIN ST in CLINTON, MA)
AIR SYNTHETIC MINOR (AIRS/AFS) CRITERIA AND HAZARDOUS AIR POLLUTANT INVENTORY (Inventory of air pollution sources) (Resource Conservation and Recovery Act (tracking hazardous waste)) Business SIC classification: WOOD HOUSEHOLD FURNITURE, EXCEPT UPHOLSTERED Business NAICS classification: NONUPHOLSTERED WOOD HOUSEHOLD FURNITURE MANUFACTURING. Organizations: E R BUCK CHAIR CO (CONTACT/OWNER)
Alternative names: BUCK E R CHAIR CO
KELLY COMPANY THE (144 FLAGG STREET in CLINTON, MA)
AIR MINOR (AIRS/AFS) (Resource Conservation and Recovery Act (tracking hazardous waste)) Alternative names: KELLY CO THE LACQUER DIV
CLINTON HOSPITAL (201 HIGHLAND ST in CLINTON, MA)
AIR MINOR (AIRS/AFS) CRITERIA AND HAZARDOUS AIR POLLUTANT INVENTORY (Inventory of air pollution sources) Business SIC classification: GENERAL MEDICAL AND SURGICAL HOSPITALS
CLINTON W T F (BOYLSTON ROAD in CLINTON, MA)
National Pollutant Discharge Elimination System NON-MAJOR (Tracking pollutant discharge elimination systems) - permit Business SIC classification: WATER SUPPLY Organizations: CLINTON DEPT. OF PUBLIC WORKS (CONTACT/OPERATOR)
, CLINTON BOARD OF SELECTMEN (CONTACT/OWNER)
Alternative names: CLINTON W T P
Housing units lacking complete plumbing facilities: 0.9% Housing units lacking complete kitchen facilities: 1.4%
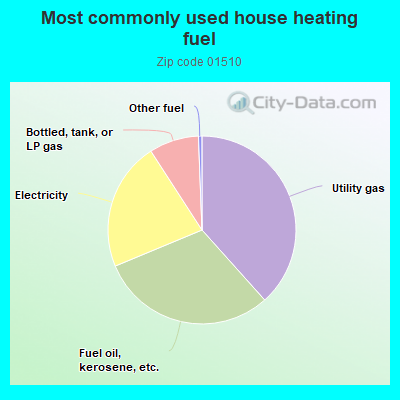
38.2%Utility gas
30.2%Fuel oil, kerosene, etc.
22.0%Electricity
8.5%Bottled, tank, or LP gas
0.6%Other fuel
Population in 1990: 13,269. Population change in the 1990s: +166 (+1.3%).
Place of birth for U.S.-born residents:
This state: 9,804
Northeast: 1,581
Midwest: 332
South: 322
West: 438
58% of the 01510 zip code residents lived in the same house 5 years ago. Out of people who lived in different houses, 65% lived in this county. Out of people who lived in different counties, 50% lived in Massachusetts.
89% of the 01510 zip code residents lived in the same house 1 year ago. Out of people who lived in different houses, 50% moved from this county. Out of people who lived in different houses, 36% moved from different county within same state. Out of people who lived in different houses, 11% moved from different state. Out of people who lived in different houses, 1% moved from abroad.
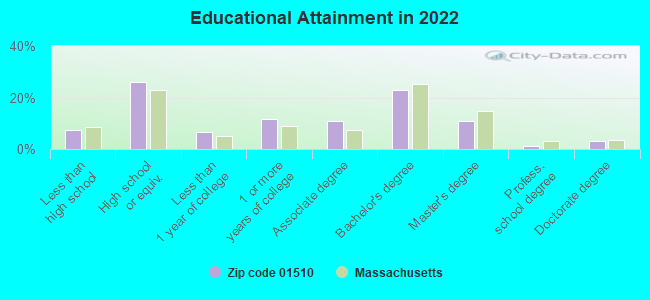
Private vs. public school enrollment:
Students in private schools in grades 1 to 8 (elementary and middle school): 16
Here:
1.9%
Massachusetts:
10.3%
Students in private schools in grades 9 to 12 (high school): 55
Here:
6.4%
Massachusetts:
12.3%
Students in private undergraduate colleges: 278
Here:
32.8%
Massachusetts:
51.2%
Occupation by median earnings in the past 12 months ($)
116,777Computer and mathematical occupations
97,350Business and financial operations occupations
94,034Law enforcement workers including supervisors
85,534Architecture and engineering occupations
82,553Life, physical, and social science occupations
82,274Health diagnosing and treating practitioners and other technical occupations
Companies with federal contracts located in this zip code (CLINTON, MA):
ROCKBESTOS-SURPRENANTCABLE COR (172 STERLING STREET) : $1,179,150 in 7 contractsfrom 2002 to 2004
Contracts for Cable, Cord, and Wire Assemblies: Communications Equipment, Wire and Cable, Electrical by Bureau of Prisoners/Federal Prison System, NASA, Army Signed by year:2000: $0; 2001: $0; 2002: $224,000; 2003: $495,150; 2004: $460,000; 2005: $0; 2006: $0.
Biggest contracts:
$485,000 with Bureau of Prisoners/Federal Prison System for Cable, Cord, and Wire Assemblies: Communications Equipment. Signed on 2003-11-21. Completion date: 2008-11-21.
$226,000, same as above.Signed on 2004-02-06. Completion date: 2008-11-06.
$220,000, same as above.Signed on 2004-05-28. Completion date: 2008-11-28.
$217,000 with NASA for Cable, Cord, and Wire Assemblies: Communications Equipment. Signed on 2002-02-15. Completion date: 2002-05-15.
R BATES & SONS, INC (57 LAWRENCE STREET; small business) : $227,374 in 3 contractsfrom 2000 to 2001
$199,975 with U.S. Army Corps of Engineers - civil program financing only for Maintenance, Repair or Alteration of Real Property -- Other Conservation and Development Facilities. Signed on 2000-01-06. Completion date: 2000-09-30.
$22,719, same as above.Signed on 2001-05-08. Completion date: 2000-10-31.
$4,680, same as above.Signed on 2000-11-14. Completion date: 2000-10-31.
KAHLE, MARTHA (202A RIDGEFIELD CIR; small business)
$24,990 with Army for Other Professional Services. Signed on 2005-08-29. Completion date: 2006-09-11.
HAMMER MAGIC CO (19 MOUNT VIEW DR; small business) : $8,665 in 2 contractsin 2005
$4,705 with Army for Technical Assistance. Signed on 2005-12-01. Completion date: 2005-12-30.
$3,960, same as above.Signed on 2005-08-16. Completion date: 2005-08-31.
T & T WEBER HYDRAULIC REPAIR S (118 ALLEN ST; small business)
$7,299 with Army for Miscellaneous Power Transmission Equipment. Signed on 2005-02-05. Completion date: 2005-03-05.
Top industries in this zip code by the number of employees in 2005:
Health Care and Social Assistance: General Medical and Surgical Hospitals (250-499 employees: 1 establishment)
Administrative and Support and Waste Management and Remediation Services: Temporary Help Services (100-249: 1, 50-99: 1)
Management of Companies and Enterprises: Corporate, Subsidiary, and Regional Managing Offices (100-249: 1, 20-49: 1)
Health Care and Social Assistance: Nursing Care Facilities (100-249: 1)
People in group quarters in 2010:
48 people in other noninstitutional facilities
8 people in group homes intended for adults
8 people in residential treatment centers for adults
People in group quarters in 2000:
106 people in nursing homes
7 people in other noninstitutional group quarters
6 people in residential treatment centers for emotionally disturbed children
6 people in homes for the mentally retarded
4 people in religious group quarters
Fatal accident statistics in 2013:
Fatal accident count: 1
Vehicles involved in fatal accidents: 3
Fatal accidents caused by drunken drivers: 0
Fatalities: 2
Persons involved in fatal accidents: 2
Pedestrians involved in fatal accidents: 0
Home Mortgage Disclosure Act Aggregated Statistics For Year 2009 (Based on 3 full and 2 partial tracts)
A) FHA, FSA/RHS & VA Home Purchase Loans
B) Conventional Home Purchase Loans
C) Refinancings
D) Home Improvement Loans
E) Loans on Dwellings For 5+ Families
F) Non-occupant Loans on < 5 Family Dwellings (A B C & D)
G) Loans On Manufactured Home Dwelling (A B C & D)
Number
Average Value
Number
Average Value
Number
Average Value
Number
Average Value
Number
Average Value
Number
Average Value
Number
Average Value
LOANS ORIGINATED
83
$213,107
117
$170,312
385
$195,558
50
$74,324
5
$270,864
14
$136,326
2
$44,875
APPLICATIONS APPROVED, NOT ACCEPTED
0
$0
11
$182,103
25
$196,153
3
$58,180
0
$0
6
$155,955
0
$0
APPLICATIONS DENIED
7
$167,269
24
$162,920
123
$204,450
8
$45,681
0
$0
5
$140,504
0
$0
APPLICATIONS WITHDRAWN
9
$161,902
16
$142,225
85
$216,112
3
$69,093
1
$2,248,800
3
$168,400
0
$0
FILES CLOSED FOR INCOMPLETENESS
0
$0
6
$121,988
41
$219,785
2
$84,760
0
$0
1
$62,970
0
$0
Aggregated Statistics For Year 2008 (Based on 3 full and 2 partial tracts)
A) FHA, FSA/RHS & VA Home Purchase Loans
B) Conventional Home Purchase Loans
C) Refinancings
D) Home Improvement Loans
E) Loans on Dwellings For 5+ Families
F) Non-occupant Loans on < 5 Family Dwellings (A B C & D)
G) Loans On Manufactured Home Dwelling (A B C & D)
Number
Average Value
Number
Average Value
Number
Average Value
Number
Average Value
Number
Average Value
Number
Average Value
Number
Average Value
LOANS ORIGINATED
45
$213,020
177
$184,553
208
$198,462
49
$95,224
8
$2,961,622
42
$191,422
6
$74,960
APPLICATIONS APPROVED, NOT ACCEPTED
1
$247,370
12
$182,152
15
$187,306
6
$55,220
1
$696,000
3
$116,437
0
$0
APPLICATIONS DENIED
5
$243,942
27
$135,074
149
$210,570
22
$83,711
0
$0
13
$192,848
0
$0
APPLICATIONS WITHDRAWN
3
$148,520
28
$197,051
59
$229,170
4
$121,348
0
$0
4
$214,918
0
$0
FILES CLOSED FOR INCOMPLETENESS
0
$0
9
$199,060
18
$189,019
1
$292,340
0
$0
1
$272,850
0
$0
Aggregated Statistics For Year 2007 (Based on 3 full and 2 partial tracts)
A) FHA, FSA/RHS & VA Home Purchase Loans
B) Conventional Home Purchase Loans
C) Refinancings
D) Home Improvement Loans
E) Loans on Dwellings For 5+ Families
F) Non-occupant Loans on < 5 Family Dwellings (A B C & D)
G) Loans On Manufactured Home Dwelling (A B C & D)
Number
Average Value
Number
Average Value
Number
Average Value
Number
Average Value
Number
Average Value
Number
Average Value
Number
Average Value
LOANS ORIGINATED
8
$277,805
246
$185,940
325
$182,163
95
$77,914
5
$248,636
47
$176,339
3
$104,443
APPLICATIONS APPROVED, NOT ACCEPTED
0
$0
26
$173,052
67
$183,397
9
$70,826
0
$0
7
$123,239
0
$0
APPLICATIONS DENIED
0
$0
54
$174,743
279
$214,613
57
$82,335
0
$0
15
$181,409
0
$0
APPLICATIONS WITHDRAWN
0
$0
14
$175,775
117
$210,330
13
$79,572
1
$375,000
3
$309,320
0
$0
FILES CLOSED FOR INCOMPLETENESS
0
$0
7
$168,357
21
$230,080
3
$146,920
0
$0
2
$139,610
0
$0
Aggregated Statistics For Year 2006 (Based on 3 full and 2 partial tracts)
A) FHA, FSA/RHS & VA Home Purchase Loans
B) Conventional Home Purchase Loans
C) Refinancings
D) Home Improvement Loans
E) Loans on Dwellings For 5+ Families
F) Non-occupant Loans on < 5 Family Dwellings (A B C & D)
G) Loans On Manufactured Home Dwelling (A B C & D)
Number
Average Value
Number
Average Value
Number
Average Value
Number
Average Value
Number
Average Value
Number
Average Value
Number
Average Value
LOANS ORIGINATED
6
$274,353
388
$166,468
473
$174,381
117
$79,524
10
$571,288
60
$173,262
0
$0
APPLICATIONS APPROVED, NOT ACCEPTED
1
$281,000
35
$187,729
54
$168,365
9
$51,380
0
$0
1
$139,430
1
$25,490
APPLICATIONS DENIED
0
$0
67
$169,292
283
$192,421
46
$101,100
3
$322,767
15
$202,681
0
$0
APPLICATIONS WITHDRAWN
1
$197,000
50
$162,597
208
$187,167
12
$53,442
0
$0
12
$208,060
0
$0
FILES CLOSED FOR INCOMPLETENESS
0
$0
17
$180,351
73
$221,725
1
$37,480
0
$0
5
$183,560
0
$0
Aggregated Statistics For Year 2005 (Based on 3 full and 2 partial tracts)
A) FHA, FSA/RHS & VA Home Purchase Loans
B) Conventional Home Purchase Loans
C) Refinancings
D) Home Improvement Loans
E) Loans on Dwellings For 5+ Families
F) Non-occupant Loans on < 5 Family Dwellings (A B C & D)
G) Loans On Manufactured Home Dwelling (A B C & D)
Number
Average Value
Number
Average Value
Number
Average Value
Number
Average Value
Number
Average Value
Number
Average Value
Number
Average Value
LOANS ORIGINATED
5
$265,990
511
$180,775
557
$185,904
96
$124,447
9
$556,928
76
$185,417
3
$50,603
APPLICATIONS APPROVED, NOT ACCEPTED
0
$0
50
$155,141
83
$172,440
3
$61,660
0
$0
13
$170,743
0
$0
APPLICATIONS DENIED
0
$0
113
$141,625
286
$214,868
53
$108,178
0
$0
25
$229,845
3
$63,517
APPLICATIONS WITHDRAWN
2
$192,460
84
$187,592
210
$206,192
29
$157,247
1
$750,000
13
$191,911
2
$83,765
FILES CLOSED FOR INCOMPLETENESS
0
$0
36
$153,262
141
$222,724
1
$150,000
0
$0
8
$157,419
0
$0
Aggregated Statistics For Year 2004 (Based on 3 full and 2 partial tracts)
A) FHA, FSA/RHS & VA Home Purchase Loans
B) Conventional Home Purchase Loans
C) Refinancings
D) Home Improvement Loans
E) Loans on Dwellings For 5+ Families
F) Non-occupant Loans on < 5 Family Dwellings (A B C & D)
G) Loans On Manufactured Home Dwelling (A B C & D)
Number
Average Value
Number
Average Value
Number
Average Value
Number
Average Value
Number
Average Value
Number
Average Value
Number
Average Value
LOANS ORIGINATED
20
$216,311
442
$190,162
565
$166,430
95
$113,469
7
$158,397
73
$199,806
7
$74,103
APPLICATIONS APPROVED, NOT ACCEPTED
2
$261,265
41
$187,207
48
$168,367
19
$46,501
0
$0
4
$166,072
0
$0
APPLICATIONS DENIED
3
$207,000
49
$172,716
200
$171,794
31
$48,800
0
$0
13
$223,196
2
$134,620
APPLICATIONS WITHDRAWN
3
$270,390
57
$181,392
162
$169,819
13
$123,642
0
$0
10
$203,592
1
$134,930
FILES CLOSED FOR INCOMPLETENESS
0
$0
4
$207,818
134
$179,965
9
$81,021
0
$0
6
$195,727
0
$0
Aggregated Statistics For Year 2003 (Based on 3 full and 2 partial tracts)
A) FHA, FSA/RHS & VA Home Purchase Loans
B) Conventional Home Purchase Loans
C) Refinancings
D) Home Improvement Loans
E) Loans on Dwellings For 5+ Families
F) Non-occupant Loans on < 5 Family Dwellings (A B C & D)
Number
Average Value
Number
Average Value
Number
Average Value
Number
Average Value
Number
Average Value
Number
Average Value
LOANS ORIGINATED
43
$180,613
335
$174,895
1,328
$149,188
35
$33,170
13
$340,445
85
$153,809
APPLICATIONS APPROVED, NOT ACCEPTED
4
$227,362
39
$169,520
102
$149,154
13
$57,158
0
$0
6
$145,757
APPLICATIONS DENIED
5
$212,600
43
$169,303
243
$152,861
34
$32,520
0
$0
18
$148,198
APPLICATIONS WITHDRAWN
0
$0
30
$178,163
203
$142,481
12
$64,272
0
$0
6
$95,578
FILES CLOSED FOR INCOMPLETENESS
2
$245,310
7
$214,323
25
$141,531
0
$0
0
$0
1
$277,350
Aggregated Statistics For Year 2002 (Based on 3 full and 2 partial tracts)
A) FHA, FSA/RHS & VA Home Purchase Loans
B) Conventional Home Purchase Loans
C) Refinancings
D) Home Improvement Loans
E) Loans on Dwellings For 5+ Families
F) Non-occupant Loans on < 5 Family Dwellings (A B C & D)
Number
Average Value
Number
Average Value
Number
Average Value
Number
Average Value
Number
Average Value
Number
Average Value
LOANS ORIGINATED
31
$192,265
276
$151,024
850
$144,437
40
$37,148
7
$130,231
68
$143,139
APPLICATIONS APPROVED, NOT ACCEPTED
1
$88,450
18
$139,927
92
$128,685
10
$37,012
0
$0
3
$99,153
APPLICATIONS DENIED
4
$192,918
43
$113,096
168
$135,991
22
$32,028
1
$74,960
19
$120,845
APPLICATIONS WITHDRAWN
4
$212,730
13
$136,116
176
$140,878
18
$42,673
1
$290,000
7
$198,130
FILES CLOSED FOR INCOMPLETENESS
0
$0
3
$88,990
22
$137,094
0
$0
0
$0
3
$99,840
Aggregated Statistics For Year 2001 (Based on 3 full and 2 partial tracts)
A) FHA, FSA/RHS & VA Home Purchase Loans
B) Conventional Home Purchase Loans
C) Refinancings
D) Home Improvement Loans
E) Loans on Dwellings For 5+ Families
F) Non-occupant Loans on < 5 Family Dwellings (A B C & D)
Number
Average Value
Number
Average Value
Number
Average Value
Number
Average Value
Number
Average Value
Number
Average Value
LOANS ORIGINATED
46
$164,394
247
$140,625
689
$130,150
38
$27,790
2
$343,375
47
$138,341
APPLICATIONS APPROVED, NOT ACCEPTED
5
$180,706
16
$132,156
83
$110,313
16
$27,204
0
$0
5
$117,162
APPLICATIONS DENIED
8
$171,082
20
$123,772
143
$94,478
28
$23,154
0
$0
9
$108,508
APPLICATIONS WITHDRAWN
2
$186,500
19
$98,511
137
$122,302
9
$24,902
0
$0
7
$110,856
FILES CLOSED FOR INCOMPLETENESS
2
$89,750
1
$100,000
16
$127,799
0
$0
0
$0
0
$0
Aggregated Statistics For Year 2000 (Based on 3 full and 2 partial tracts)
A) FHA, FSA/RHS & VA Home Purchase Loans
B) Conventional Home Purchase Loans
C) Refinancings
D) Home Improvement Loans
E) Loans on Dwellings For 5+ Families
F) Non-occupant Loans on < 5 Family Dwellings (A B C & D)
Number
Average Value
Number
Average Value
Number
Average Value
Number
Average Value
Number
Average Value
Number
Average Value
LOANS ORIGINATED
63
$140,295
227
$124,936
180
$99,082
53
$25,388
1
$176,910
23
$114,370
APPLICATIONS APPROVED, NOT ACCEPTED
9
$106,380
11
$153,570
32
$94,540
9
$20,929
0
$0
0
$0
APPLICATIONS DENIED
7
$104,193
27
$107,191
77
$98,672
15
$29,678
0
$0
1
$84,000
APPLICATIONS WITHDRAWN
2
$177,500
11
$72,360
65
$90,940
3
$22,487
1
$176,910
5
$69,082
FILES CLOSED FOR INCOMPLETENESS
2
$118,500
1
$264,000
18
$123,098
0
$0
0
$0
4
$164,162
Aggregated Statistics For Year 1999 (Based on 2 full and 1 partial tracts)
A) FHA, FSA/RHS & VA Home Purchase Loans
B) Conventional Home Purchase Loans
C) Refinancings
D) Home Improvement Loans
E) Loans on Dwellings For 5+ Families
F) Non-occupant Loans on < 5 Family Dwellings (A B C & D)
2003 - 2018 National Fire Incident Reporting System (NFIRS) incidents
Based on the data from the years 2003 - 2018 the average number of fires per year is 102. The highest number of reported fires - 188 took place in 2007, and the least - 1 in 2014. The data has a rising trend.
When looking into fire subcategories, the most reports belonged to: Structure Fires (54.2%), and Outside Fires (22.2%).
Fire incident types reported to NFIRS in Zip Code 01510


 Nearest zip codes: 01561, 01503, 01505, 01523, 01740, 01564.


 Based on the data from the years 2003 - 2018 the average number of fires per year is 102. The highest number of reported fires - 188 took place in 2007, and the least - 1 in 2014. The data has a rising trend.
 When looking into fire subcategories, the most reports belonged to: Structure Fires (54.2%), and Outside Fires (22.2%).