Hawkins, Texas
Submit your own pictures of this city and show them to the world
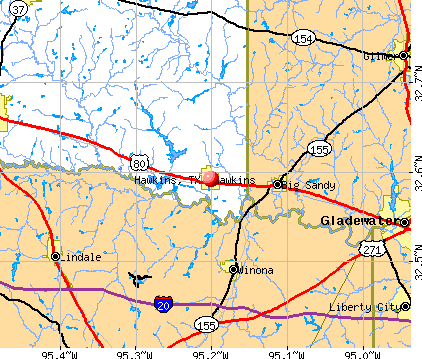
- OSM Map
- General Map
- Google Map
- MSN Map
Population change since 2000: +1.5%
 |
| Males: 670 | |
| Females: 681 |
| Median resident age: | 36.9 years |
| Texas median age: | 35.6 years |
Zip codes: 75765.
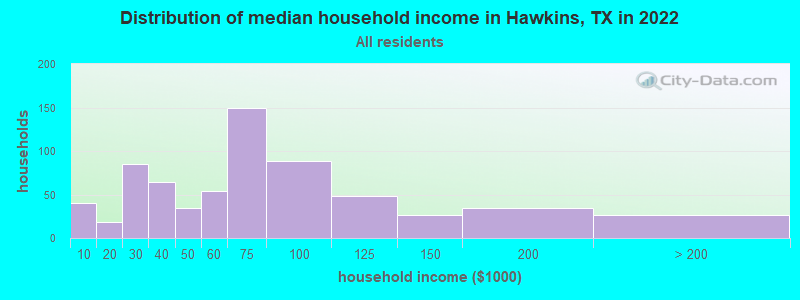
| Hawkins: | $65,628 |
| TX: | $72,284 |
Estimated per capita income in 2022: $28,747 (it was $14,833 in 2000)
Hawkins city income, earnings, and wages data
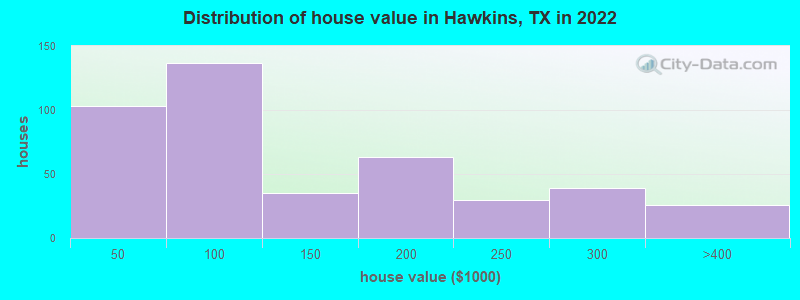
Estimated median house or condo value in 2022: $106,804 (it was $48,200 in 2000)
| Hawkins: | $106,804 |
| TX: | $275,400 |
Mean prices in 2022: all housing units: $133,491; detached houses: $151,132; mobile homes: $16,004
Median gross rent in 2022: $954.
(9.9% for White Non-Hispanic residents, 19.7% for Black residents, 27.4% for Hispanic or Latino residents)
Detailed information about poverty and poor residents in Hawkins, TX
Compare current foreclosures near Hawkins, TX:
| Photo | Address | Area | Beds / Baths | Price | Details |
|---|---|---|---|---|---|

|
#1
Scenic Loop
Hawkins, TX 75765
|
1,951 sq. feet
|
- baths - beds |
show details | |

|
#2
White Cedar Rd
Big Sandy, TX 75755
|
999 sq. feet
|
1 baths 2 beds |
$174,900
|
show details |

|
#3
Trl
Hawkins, TX 75765
|
- sq. feet
|
- baths - beds |
show details | |

|
#4
W Groves St
Big Sandy, TX 75755
|
- sq. feet
|
1 baths 3 beds |
show details | |

|
#5
W Harold St
Gladewater, TX 75647
|
2,297 sq. feet
|
2 baths 3 beds |
show details | |

|
#6
Sweet Gum Rd
Big Sandy, TX 75755
|
2,432 sq. feet
|
2 baths - beds |
show details | |

|
#7
N Confederate Ave
Tyler, TX 75702
|
1,716 sq. feet
|
2 baths - beds |
show details | |

|
#8
Allison St
Gladewater, TX 75647
|
1,770 sq. feet
|
2 baths - beds |
show details | |

|
#9
Fm 2015
Tyler, TX 75708
|
1,052 sq. feet
|
1 baths - beds |
show details | |

|
#10
Apricot Rd
Gilmer, TX 75644
|
1,843 sq. feet
|
2 baths - beds |
show details |
| Photo | Address | Area | Beds / Baths | Price | Details |
|---|---|---|---|---|---|

|
#11
Private Road 3430
Gilmer, TX 75645
|
1,064 sq. feet
|
1 baths - beds |
show details | |

|
#12
Black Gum Rd
Gilmer, TX 75644
|
2,467 sq. feet
|
2 baths - beds |
show details | |

|
#13
Fm 852
Gilmer, TX 75644
|
2,584 sq. feet
|
4 baths - beds |
show details | |

|
#14
Berryhill Dr
Tyler, TX 75702
|
1,475 sq. feet
|
1 baths - beds |
show details | |

|
#15
Roosevelt Dr
Tyler, TX 75705
|
1,370 sq. feet
|
1 baths - beds |
show details | |

|
#16
Wood Springs Rd
Lindale, TX 75771
|
2,215 sq. feet
|
3 baths - beds |
show details | |

|
#17
Lonetree Cir
Tyler, TX 75706
|
2,011 sq. feet
|
2 baths - beds |
show details | |

|
#18
Lakeland Dr
Tyler, TX 75708
|
1,720 sq. feet
|
2 baths - beds |
show details | |

|
#19
Rustic Rd
Lindale, TX 75771
|
1,766 sq. feet
|
2 baths - beds |
show details | |

|
#20
Lakewood Dr
Tyler, TX 75702
|
2,031 sq. feet
|
2 baths - beds |
show details |
| Photo | Address | Area | Beds / Baths | Price | Details |
|---|---|---|---|---|---|

|
#21
Elm Rd
Gilmer, TX 75645
|
912 sq. feet
|
2 baths - beds |
show details | |

|
#22
County Road 452
Lindale, TX 75771
|
2,460 sq. feet
|
2 baths - beds |
show details | |

|
#23
Jane Ln
Winona, TX 75792
|
1,710 sq. feet
|
2 baths - beds |
show details | |

|
#24
N Parkdale Dr
Tyler, TX 75702
|
1,500 sq. feet
|
2 baths - beds |
show details | |

|
#25
Dallas St
Winona, TX 75792
|
1,388 sq. feet
|
1 baths - beds |
show details | |

|
#26
County Road 3104
Gladewater, TX 75647
|
2,580 sq. feet
|
- baths - beds |
show details | |

|
#27
Almond Rd
Big Sandy, TX 75755
|
1,248 sq. feet
|
3 baths - beds |
show details | |

|
#28
N Hill Ave
Tyler, TX 75702
|
1,400 sq. feet
|
1 baths - beds |
show details | |

|
#29
County Road 4104
Lindale, TX 75771
|
1,400 sq. feet
|
2 baths - beds |
show details | |

|
#30
County Road 358
Winona, TX 75792
|
1,152 sq. feet
|
2 baths - beds |
show details |
| Photo | Address | Area | Beds / Baths | Price | Details |
|---|---|---|---|---|---|

|
#31
Private Road 1017
Gladewater, TX 75647
|
1,232 sq. feet
|
- baths - beds |
show details | |

|
#32
County Road 3152
Tyler, TX 75708
|
- sq. feet
|
- baths - beds |
show details | |

|
#33
County Road 486
Tyler, TX 75706
|
- sq. feet
|
- baths - beds |
show details | |

|
#34
Eldorado Dr
Tyler, TX 75705
|
- sq. feet
|
- baths - beds |
show details | |

|
#35
Silk Tree Rd
Gilmer, TX 75645
|
- sq. feet
|
- baths - beds |
show details | |

|
#36
Dobbs Ter
Tyler, TX 75706
|
1,292 sq. feet
|
- baths - beds |
show details | |

|
#37
W Mims St
Tyler, TX 75702
|
- sq. feet
|
- baths - beds |
show details | |

|
#38
W Northwest L 323
Tyler, TX 75702
|
- sq. feet
|
- baths - beds |
show details | |

|
#39
Story Dr
Tyler, TX 75702
|
- sq. feet
|
- baths - beds |
show details | |

|
#40
W Harmony St
Tyler, TX 75702
|
- sq. feet
|
- baths - beds |
show details |
| Photo | Address | Area | Beds / Baths | Price | Details |
|---|---|---|---|---|---|

|
#41
County Road 2501
Mineola, TX 75773
|
- sq. feet
|
- baths - beds |
show details | |

|
#42
W Northwest Loop 323, Apt 513
Tyler, TX 75702
|
- sq. feet
|
- baths - beds |
show details | |

|
#43
N Grand Ave
Tyler, TX 75702
|
- sq. feet
|
- baths - beds |
show details | |

|
#44
Loring Ln
Lindale, TX 75771
|
- sq. feet
|
- baths - beds |
show details | |

|
#45
Brenlind Ln
Mineola, TX 75773
|
- sq. feet
|
- baths - beds |
show details | |

|
#46
Dobbs Ter
Tyler, TX 75706
|
- sq. feet
|
- baths - beds |
show details | |

|
#47
S Montgomery St
Gilmer, TX 75644
|
- sq. feet
|
- baths - beds |
show details | |

|
#48
Cedar Bnd
Gladewater, TX 75647
|
- sq. feet
|
- baths - beds |
show details | |

|
#49
County Road 396
Tyler, TX 75708
|
1,216 sq. feet
|
- baths - beds |
show details | |

|
Check over 1 million property listings on Foreclosure.com!
|
browse all offers | |||


- 1,11062.0%White alone
- 55631.1%Black alone
- 643.6%Hispanic
- 150.8%Two or more races
- 30.2%American Indian alone
- 30.2%Asian alone
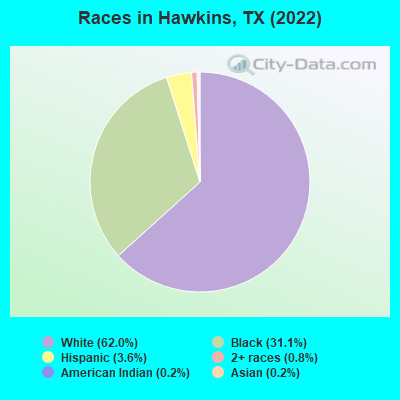
Races in Hawkins detailed stats: ancestries, foreign born residents, place of birth
According to our research of Texas and other state lists, there were 37 registered sex offenders living in Hawkins, Texas as of June 10, 2024.
The ratio of all residents to sex offenders in Hawkins is 35 to 1.
Type |
2009 |
2010 |
2011 |
2012 |
2013 |
2014 |
2015 |
2016 |
2017 |
2018 |
2019 |
2020 |
2021 |
2022 |
|---|---|---|---|---|---|---|---|---|---|---|---|---|---|---|
| Murders (per 100,000) | 0 (0.0) | 0 (0.0) | 0 (0.0) | 0 (0.0) | 0 (0.0) | 2 (149.9) | 0 (0.0) | 0 (0.0) | 0 (0.0) | 0 (0.0) | 0 (0.0) | 0 (0.0) | 0 (0.0) | 1 (73.9) |
| Rapes (per 100,000) | 0 (0.0) | 0 (0.0) | 0 (0.0) | 0 (0.0) | 0 (0.0) | 0 (0.0) | 0 (0.0) | 0 (0.0) | 0 (0.0) | 0 (0.0) | 0 (0.0) | 0 (0.0) | 0 (0.0) | 0 (0.0) |
| Robberies (per 100,000) | 0 (0.0) | 0 (0.0) | 0 (0.0) | 0 (0.0) | 0 (0.0) | 0 (0.0) | 0 (0.0) | 0 (0.0) | 2 (153.3) | 0 (0.0) | 0 (0.0) | 0 (0.0) | 0 (0.0) | 0 (0.0) |
| Assaults (per 100,000) | 6 (387.8) | 4 (313.0) | 0 (0.0) | 5 (383.7) | 0 (0.0) | 2 (149.9) | 0 (0.0) | 0 (0.0) | 3 (229.9) | 3 (228.8) | 4 (300.5) | 0 (0.0) | 2 (147.8) | 2 (147.8) |
| Burglaries (per 100,000) | 14 (905.0) | 9 (704.2) | 5 (383.1) | 14 (1,074) | 16 (1,248) | 7 (524.7) | 8 (620.2) | 4 (308.6) | 4 (306.5) | 1 (76.3) | 0 (0.0) | 2 (150.6) | 1 (73.9) | 5 (369.5) |
| Thefts (per 100,000) | 21 (1,357) | 35 (2,739) | 33 (2,529) | 32 (2,456) | 27 (2,106) | 22 (1,649) | 16 (1,240) | 5 (385.8) | 11 (842.9) | 3 (228.8) | 2 (150.3) | 0 (0.0) | 1 (73.9) | 4 (295.6) |
| Auto thefts (per 100,000) | 2 (129.3) | 5 (391.2) | 2 (153.3) | 2 (153.5) | 4 (312.0) | 3 (224.9) | 2 (155.0) | 0 (0.0) | 0 (0.0) | 3 (228.8) | 1 (75.1) | 0 (0.0) | 0 (0.0) | 0 (0.0) |
| Arson (per 100,000) | 0 (0.0) | 2 (156.5) | 0 (0.0) | 0 (0.0) | 0 (0.0) | 0 (0.0) | 0 (0.0) | 0 (0.0) | 0 (0.0) | 0 (0.0) | 0 (0.0) | 0 (0.0) | 0 (0.0) | 0 (0.0) |
| City-Data.com crime index | 205.6 | 252.7 | 140.2 | 262.5 | 196.6 | 450.5 | 105.4 | 37.0 | 147.1 | 78.6 | 72.1 | 10.5 | 37.7 | 215.1 |
The City-Data.com crime index weighs serious crimes and violent crimes more heavily. Higher means more crime, U.S. average is 246.1. It adjusts for the number of visitors and daily workers commuting into cities.
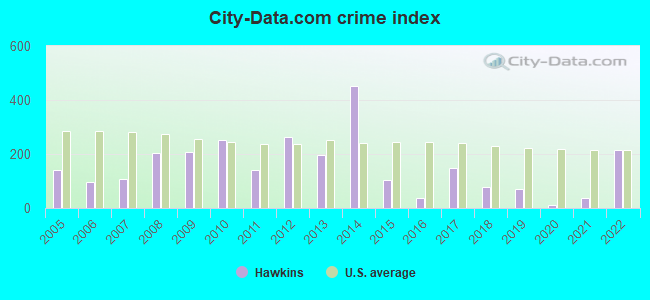
Crime rate in Hawkins detailed stats: murders, rapes, robberies, assaults, burglaries, thefts, arson
Full-time law enforcement employees in 2021, including police officers: 4 (3 officers - 3 male; 0 female).
| Officers per 1,000 residents here: | 2.22 |
| Texas average: | 2.07 |
 Recent articles from our blog. Our writers, many of them Ph.D. graduates or candidates, create easy-to-read articles on a wide variety of topics.

 | Would these dip below $800k? (19 replies) |
| Bring Back Metro Matt and Mark Senior Development News & Analysis (1297 replies) |
| Anyone know anything about Fruitvale, Texas? (26 replies) |
| Gone but not forgotten- Old Corpus Christi (571 replies) |
| Townhouse in Plano (17 replies) |
| Highland park vs Frisco (53 replies) |
Latest news from Hawkins, TX collected exclusively by city-data.com from local newspapers, TV, and radio stations
Ancestries: English (14.9%), American (12.9%), European (3.3%), German (3.0%), Polish (1.9%), British (1.4%).
Current Local Time: CST time zone
Land area: 2.24 square miles.
Population density: 602 people per square mile (low).
12 residents are foreign born
| This city: | 0.7% |
| Texas: | 17.1% |
Median real estate property taxes paid for housing units with mortgages in 2022: $2,380 (1.7%)
Median real estate property taxes paid for housing units with no mortgage in 2022: $1,088 (1.1%)
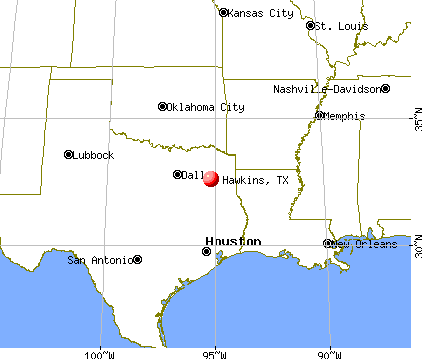
Nearest city with pop. 50,000+: Tyler, TX  (18.7 miles , pop. 83,650).
Nearest city with pop. 200,000+: Shreveport, LA (83.8 miles , pop. 200,145).
Nearest city with pop. 1,000,000+: Dallas, TX (93.4 miles , pop. 1,188,580).
Nearest cities:
), ), ), Latitude: 32.59 N, Longitude: 95.20 W
Area code: 903

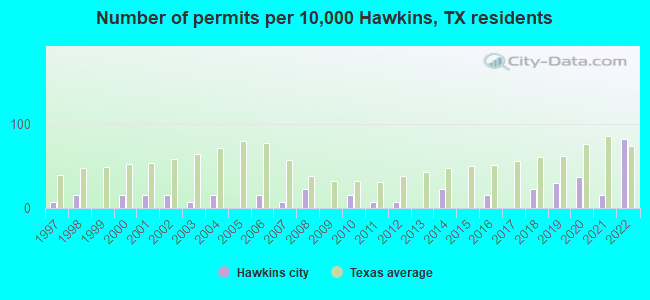
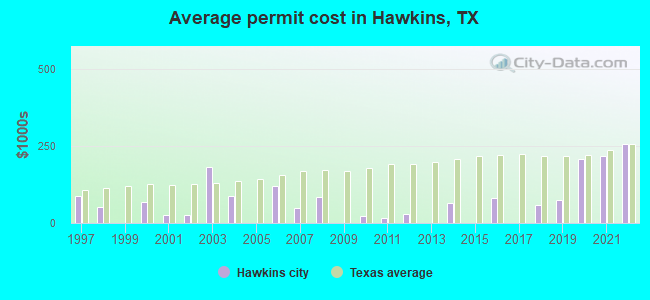
Single-family new house construction building permits:
- 2022: 11 buildings, average cost: $256,200
- 2021: 2 buildings, average cost: $217,500
- 2020: 5 buildings, average cost: $209,100
- 2019: 4 buildings, average cost: $75,000
- 2018: 3 buildings, average cost: $58,000
- 2016: 2 buildings, average cost: $80,000
- 2014: 3 buildings, average cost: $63,500
- 2012: 1 building, cost: $30,000
- 2011: 1 building, cost: $15,000
- 2010: 2 buildings, average cost: $22,500
- 2008: 3 buildings, average cost: $84,700
- 2007: 1 building, cost: $50,000
- 2006: 2 buildings, average cost: $119,000
- 2004: 2 buildings, average cost: $87,500
- 2003: 1 building, cost: $182,500
- 2002: 2 buildings, average cost: $25,000
- 2001: 2 buildings, average cost: $25,000
- 2000: 2 buildings, average cost: $69,000
- 1998: 2 buildings, average cost: $52,500
- 1997: 1 building, cost: $87,000
| Here: | 3.8% |
| Texas: | 3.5% |
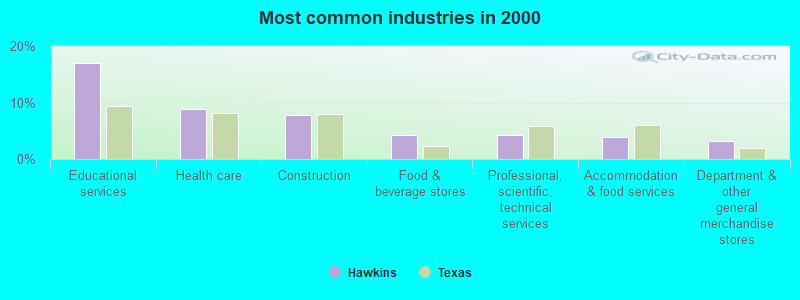
- Educational services (16.9%)
- Health care (8.9%)
- Construction (7.8%)
- Food & beverage stores (4.3%)
- Professional, scientific, technical services (4.3%)
- Accommodation & food services (3.9%)
- Department & other general merchandise stores (3.2%)
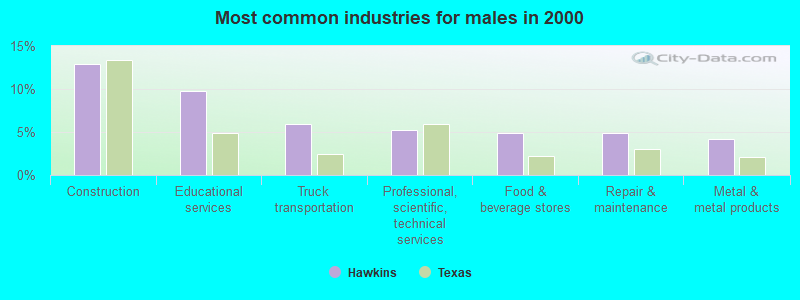
- Construction (12.9%)
- Educational services (9.8%)
- Truck transportation (5.9%)
- Professional, scientific, technical services (5.2%)
- Food & beverage stores (4.9%)
- Repair & maintenance (4.9%)
- Metal & metal products (4.2%)

- Educational services (24.3%)
- Health care (14.9%)
- Public administration (5.1%)
- Accommodation & food services (5.1%)
- Department & other general merchandise stores (4.0%)
- Food & beverage stores (3.6%)
- Professional, scientific, technical services (3.3%)
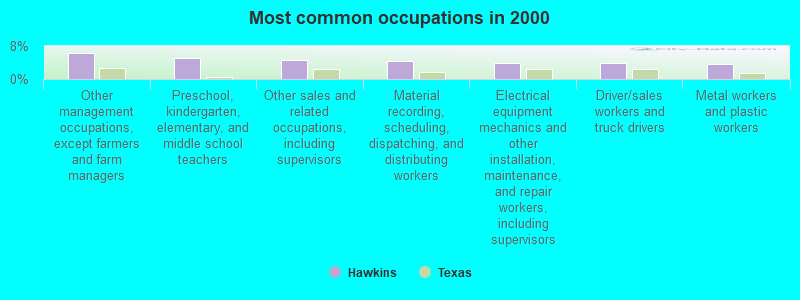
- Other management occupations, except farmers and farm managers (6.4%)
- Preschool, kindergarten, elementary, and middle school teachers (5.0%)
- Other sales and related occupations, including supervisors (4.6%)
- Material recording, scheduling, dispatching, and distributing workers (4.4%)
- Electrical equipment mechanics and other installation, maintenance, and repair workers, including supervisors (3.9%)
- Driver/sales workers and truck drivers (3.9%)
- Metal workers and plastic workers (3.6%)
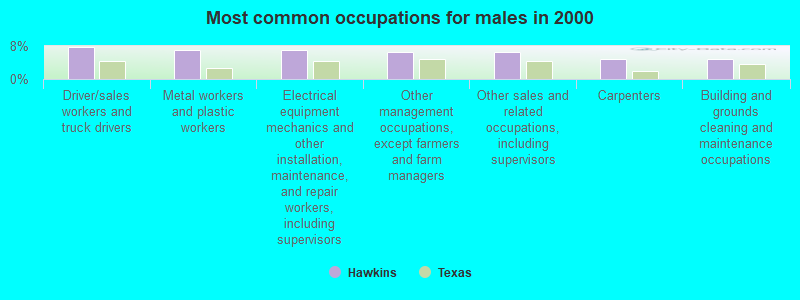
- Driver/sales workers and truck drivers (7.7%)
- Metal workers and plastic workers (7.0%)
- Electrical equipment mechanics and other installation, maintenance, and repair workers, including supervisors (7.0%)
- Other management occupations, except farmers and farm managers (6.6%)
- Other sales and related occupations, including supervisors (6.6%)
- Carpenters (4.9%)
- Building and grounds cleaning and maintenance occupations (4.9%)
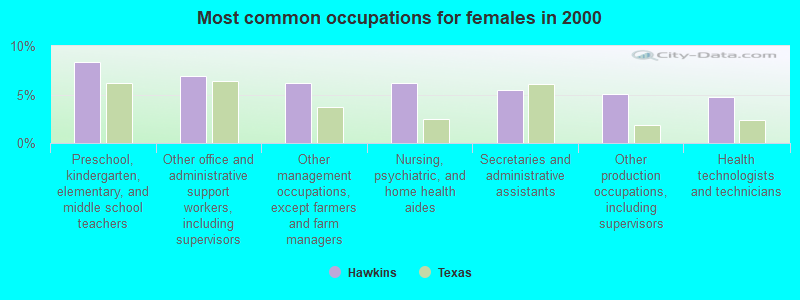
- Preschool, kindergarten, elementary, and middle school teachers (8.3%)
- Other office and administrative support workers, including supervisors (6.9%)
- Other management occupations, except farmers and farm managers (6.2%)
- Nursing, psychiatric, and home health aides (6.2%)
- Secretaries and administrative assistants (5.4%)
- Other production occupations, including supervisors (5.1%)
- Health technologists and technicians (4.7%)
Average climate in Hawkins, Texas
Based on data reported by over 4,000 weather stations


|
|


(lower is better)
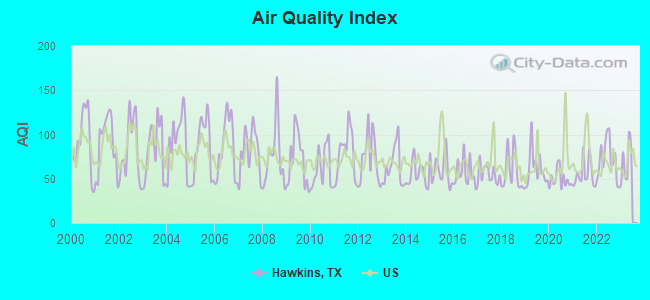
Air Quality Index (AQI) level in 2022 was 71.4. This is about average.
| City: | 71.4 |
| U.S.: | 72.6 |
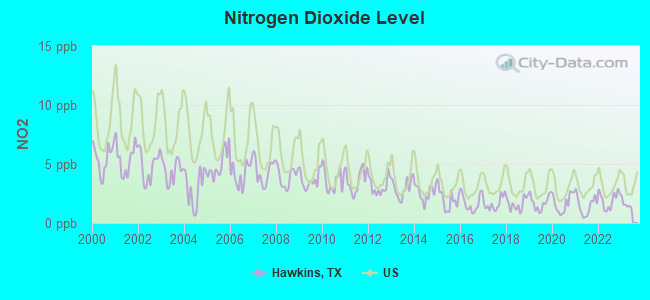
Nitrogen Dioxide (NO2) [ppb] level in 2022 was 1.96. This is significantly better than average. Closest monitor was 17.5 miles away from the city center.
| City: | 1.96 |
| U.S.: | 5.11 |
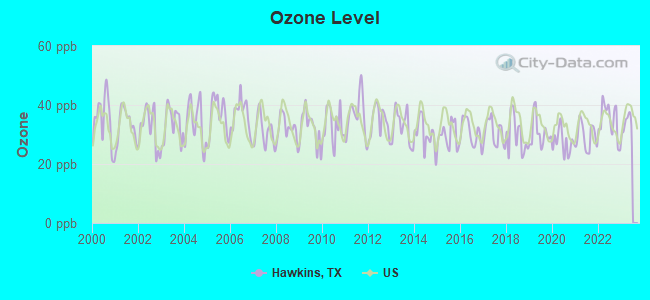
Ozone [ppb] level in 2022 was 34.7. This is about average. Closest monitor was 20.2 miles away from the city center.
| City: | 34.7 |
| U.S.: | 33.3 |
Tornado activity:
Hawkins-area historical tornado activity is above Texas state average. It is 122% greater than the overall U.S. average.
On 4/1/1988, a category F3 (max. wind speeds 158-206 mph) tornado 16.6 miles away from the Hawkins city center injured 9 people and caused between $500,000 and $5,000,000 in damages.
On 5/3/1958, a category F3 tornado 16.8 miles away from the city center caused between $50,000 and $500,000 in damages.
Earthquake activity:
Hawkins-area historical earthquake activity is significantly above Texas state average. It is 408% greater than the overall U.S. average.On 11/6/2011 at 03:53:10, a magnitude 5.7 (5.7 MW, Depth: 3.2 mi, Class: Moderate, Intensity: VI - VII) earthquake occurred 222.2 miles away from the city center
On 5/17/2012 at 08:12:00, a magnitude 4.8 (4.8 MW, Depth: 3.1 mi, Class: Light, Intensity: IV - V) earthquake occurred 67.0 miles away from the city center
On 9/3/2016 at 12:02:44, a magnitude 5.8 (5.8 MW, Depth: 3.5 mi) earthquake occurred 282.8 miles away from Hawkins center
On 9/2/2013 at 23:51:15, a magnitude 4.3 (4.3 MW, Depth: 2.9 mi) earthquake occurred 65.4 miles away from the city center
On 9/2/2013 at 21:52:38, a magnitude 4.2 (4.2 MW, Depth: 3.0 mi) earthquake occurred 58.6 miles away from the city center
On 1/25/2013 at 07:01:19, a magnitude 4.1 (4.1 MB, Depth: 3.1 mi) earthquake occurred 73.9 miles away from the city center
Magnitude types: body-wave magnitude (MB), moment magnitude (MW)
Natural disasters:
The number of natural disasters in Wood County (11) is smaller than the US average (15).Major Disasters (Presidential) Declared: 3
Emergencies Declared: 6
Causes of natural disasters: Hurricanes: 4, Fires: 3, Flood: 1, Storm: 1, Winter Storm: 1, Other: 2 (Note: some incidents may be assigned to more than one category).

Hospitals and medical centers in Hawkins:
Other hospitals and medical centers near Hawkins:
- COLONIAL NURSING CENTER (Nursing Home, about 14 miles away; LINDALE, TX)
- LINDALE HEALTHCARE CENTER (Nursing Home, about 14 miles away; LINDALE, TX)
- LINDALE NURSING CENTER (Nursing Home, about 14 miles away; LINDALE, TX)
- CHAMPAGNE HOUSE (Hospital, about 14 miles away; LINDALE, TX)
- JEFFRIES HOUSE (Hospital, about 14 miles away; LINDALE, TX)
- WOODBINE COMMUNITY HOME (Hospital, about 14 miles away; GLADEWATER, TX)
- MEDICAL CENTER-GLADEWATER (Hospital, about 15 miles away; GLADEWATER, TX)
Airports located in Hawkins:
- Hawk Ranch Airport (1TX9) (Runways: 1)
- Holly Lake Ranch Airport (16TE) (Runways: 1)
College/University in Hawkins:
Colleges/universities with over 2000 students nearest to Hawkins:
- Tyler Junior College (about 19 miles; Tyler, TX; Full-time enrollment: 8,104)
- The University of Texas at Tyler (about 20 miles; Tyler, TX; FT enrollment: 5,774)
- Kilgore College (about 25 miles; Kilgore, TX; FT enrollment: 3,127)
- LeTourneau University (about 29 miles; Longview, TX; FT enrollment: 2,357)
- Northeast Texas Community College (about 41 miles; Mount Pleasant, TX; FT enrollment: 2,320)
- Trinity Valley Community College (about 48 miles; Athens, TX; FT enrollment: 5,333)
- Texas A & M University-Commerce (about 61 miles; Commerce, TX; FT enrollment: 8,890)
Public high school in Hawkins:
- HAWKINS H S (Students: 374, Location: 231 HAWK DR, Grades: 9-12)
Public elementary/middle schools in Hawkins:
- HAWKINS EL (Students: 192, Location: 231 HAWK DR, Grades: PK-5)
- HAWKINS MIDDLE (Students: 171, Location: 231 HAWK DR, Grades: 6-8)
Points of interest:
Notable location: Hawkins Volunteer Fire Department (A). Display/hide its location on the map
Park in Hawkins: Wells Park (1). Display/hide its location on the map
Hotel: Bluebonnet Inn Inc (119 Rock St).
Court: Wood County - Justice Of Peace No 3 Office (117 East Blackbourn Street).
Birthplace of: Ben Pemberton - College basketball player (Pacific Tigers).
| This city: | 2.6 people |
| Texas: | 2.8 people |
| This city: | 72.0% |
| Whole state: | 69.9% |
| This city: | 6.0% |
| Whole state: | 6.0% |
Likely homosexual households (counted as self-reported same-sex unmarried-partner households)
- Lesbian couples: 0.2% of all households
- Gay men: 0.0% of all households
42 people in other noninstitutional group quarters in 2000
30 people in nursing homes in 2000
Banks with branches in Hawkins (2011 data):
- The City National Bank of Sulphur Springs: City National Bank Holly Lake Branch at Highway 2869, branch established on 1995/03/31; City National Bank Hawkins Office at 205 Beulah, branch established on 1947/11/08. Info updated 2011/03/23: Bank assets: $417.9 mil, Deposits: $378.5 mil, headquarters in Sulphur Springs, TX, positive income, 8 total offices, Holding Company: Sulphur Springs Bancshares, Inc.
- Bank Texas, National Association: Holly Lake Ranch at 2365 South Fm 2869, branch established on 2000/06/22. Info updated 2006/11/03: Bank assets: $211.5 mil, Deposits: $181.1 mil, headquarters in Quitman, TX, positive income, Commercial Lending Specialization, 9 total offices, Holding Company: Bt Holdings, Inc.
- Southside Bank: Hawkins Branch at 1477 North Beaulah Street, branch established on 2007/11/01. Info updated 2008/10/01: Bank assets: $3,303.8 mil, Deposits: $2,331.5 mil, headquarters in Tyler, TX, positive income, Mortgage Lending Specialization, 40 total offices, Holding Company: Southside Bancshares, Incorporated
For population 15 years and over in Hawkins:
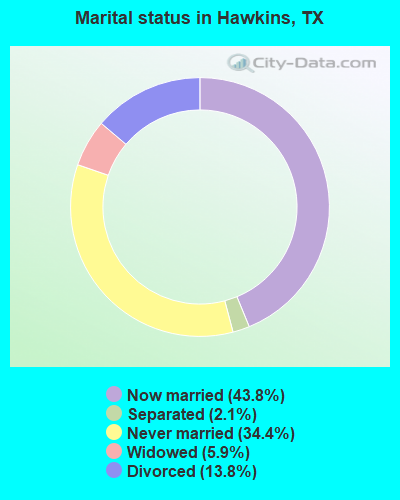
- Never married: 34.4%
- Now married: 43.8%
- Separated: 2.1%
- Widowed: 5.9%
- Divorced: 13.8%
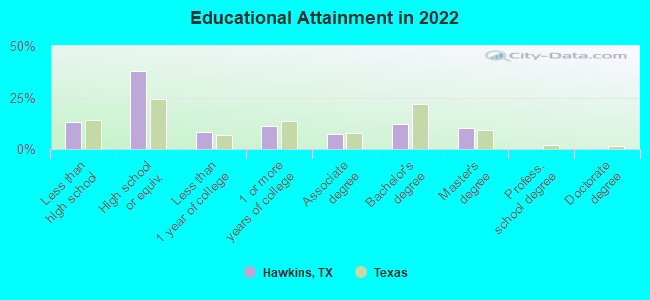
For population 25 years and over in Hawkins:
- High school or higher: 86.6%
- Bachelor's degree or higher: 21.3%
- Graduate or professional degree: 9.6%
- Unemployed: 15.7%
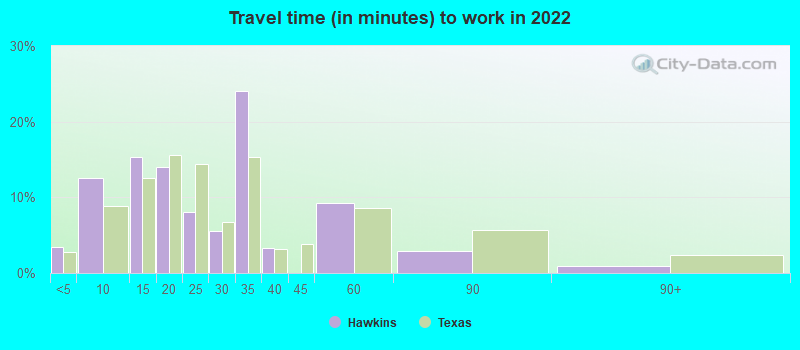
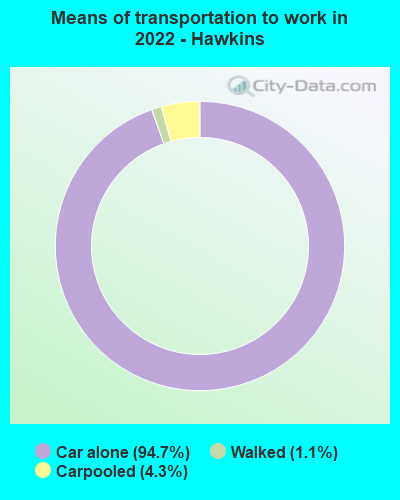
- Mean travel time to work (commute): 20.3 minutes
| Here: | 15.5 |
| Texas average: | 14.0 |
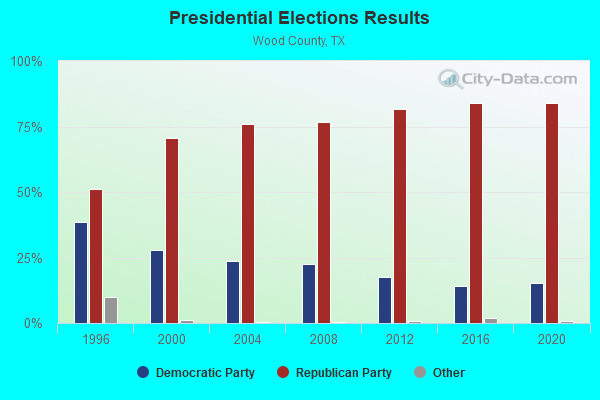
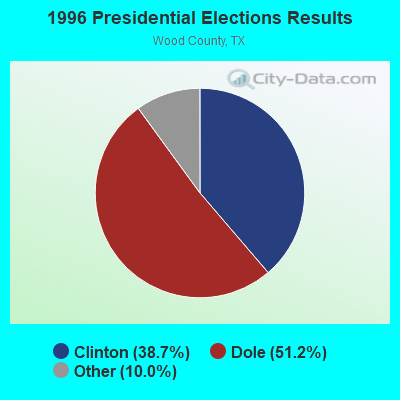
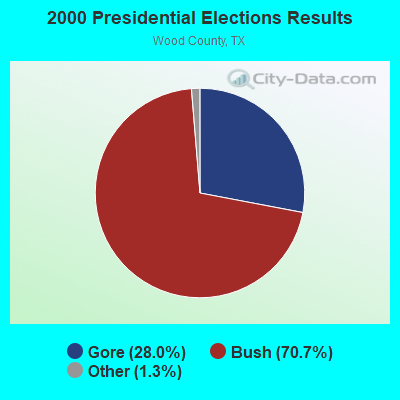
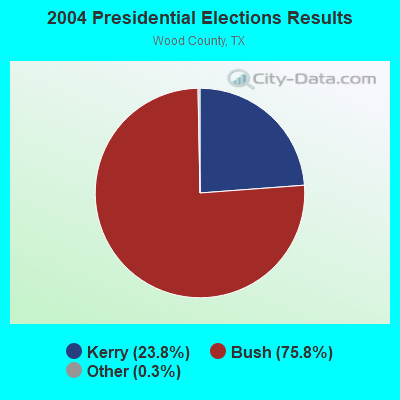
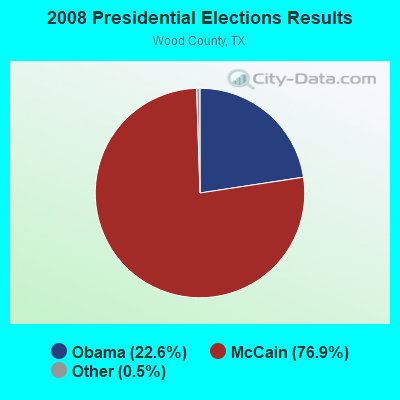
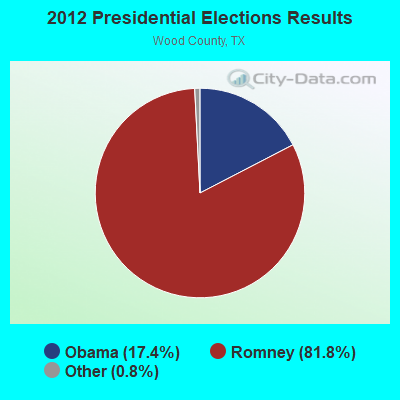
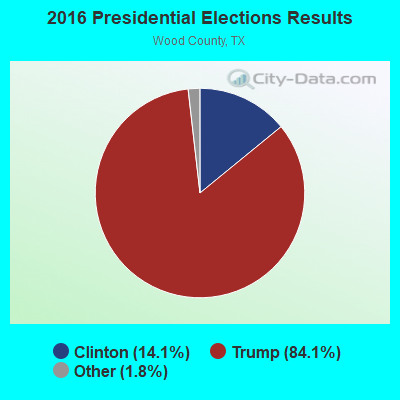

Graphs represent county-level data. Detailed 2008 Election Results
Religion statistics for Hawkins, TX (based on Wood County data)
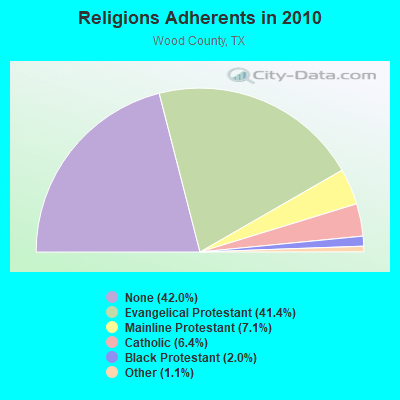
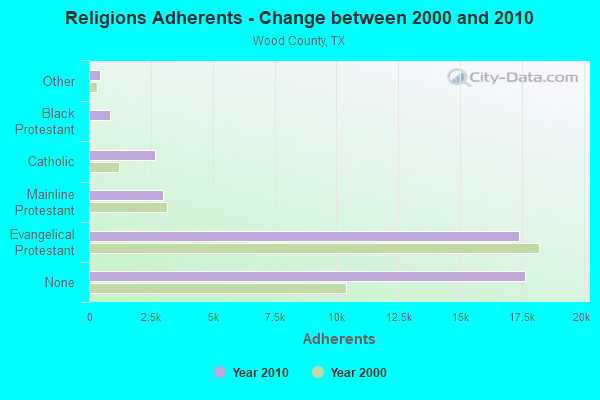
| Religion | Adherents | Congregations |
|---|---|---|
| Evangelical Protestant | 17,382 | 59 |
| Mainline Protestant | 2,996 | 20 |
| Catholic | 2,684 | 3 |
| Black Protestant | 829 | 5 |
| Other | 445 | 3 |
| None | 17,628 | - |
Food Environment Statistics:
| Here: | 1.20 / 10,000 pop. |
| Texas: | 1.47 / 10,000 pop. |
| Wood County: | 0.24 / 10,000 pop. |
| State: | 0.14 / 10,000 pop. |
| Wood County: | 0.24 / 10,000 pop. |
| Texas: | 1.11 / 10,000 pop. |
| Wood County: | 5.26 / 10,000 pop. |
| State: | 3.95 / 10,000 pop. |
| Wood County: | 5.98 / 10,000 pop. |
| Texas: | 6.13 / 10,000 pop. |
| Wood County: | 11.3% |
| Texas: | 8.9% |
| This county: | 27.5% |
| Texas: | 26.6% |
| Here: | 11.7% |
| Texas: | 15.7% |
Health and Nutrition:
| Hawkins: | 47.2% |
| State: | 48.6% |
| Hawkins: | 42.4% |
| Texas: | 47.4% |
| This city: | 29.2 |
| Texas: | 28.5 |
| This city: | 25.1% |
| Texas: | 20.6% |
| Hawkins: | 12.5% |
| State: | 10.3% |
| Here: | 6.8 |
| State: | 6.8 |
| Hawkins: | 33.7% |
| State: | 33.1% |
| Hawkins: | 52.8% |
| State: | 56.2% |
| Hawkins: | 76.0% |
| State: | 80.7% |
More about Health and Nutrition of Hawkins, TX Residents
| Local government employment and payroll (March 2022) | |||||
| Function | Full-time employees | Monthly full-time payroll | Average yearly full-time wage | Part-time employees | Monthly part-time payroll |
|---|---|---|---|---|---|
| Police Protection - Officers | 9 | $38,412 | $51,216 | 0 | $0 |
| Water Supply | 5 | $21,426 | $51,422 | 0 | $0 |
| Financial Administration | 5 | $20,434 | $49,042 | 0 | $0 |
| Sewerage | 3 | $7,293 | $29,172 | 0 | $0 |
| Streets and Highways | 3 | $8,974 | $35,896 | 0 | $0 |
| Local Libraries | 0 | $0 | 3 | $6,369 | |
| Totals for Government | 25 | $96,540 | $46,339 | 3 | $6,369 |
Hawkins government finances - Expenditure in 2017 (per resident):
- Current Operations - Police Protection: $159,000 ($117.69)
Sewerage: $101,000 ($74.76)
Water Utilities: $83,000 ($61.44)
Financial Administration: $62,000 ($45.89)
Regular Highways: $39,000 ($28.87)
Libraries: $34,000 ($25.17)
Central Staff Services: $15,000 ($11.10)
Local Fire Protection: $14,000 ($10.36)
Judicial and Legal Services: $6,000 ($4.44)
- Total Salaries and Wages: $513,000 ($379.72)
Hawkins government finances - Revenue in 2017 (per resident):
- Charges - Solid Waste Management: $163,000 ($120.65)
Sewerage: $162,000 ($119.91)
- Miscellaneous - Fines and Forfeits: $16,000 ($11.84)
Donations From Private Sources: $7,000 ($5.18)
Interest Earnings: $6,000 ($4.44)
Rents: $3,000 ($2.22)
- Revenue - Water Utilities: $398,000 ($294.60)
- State Intergovernmental - Sewerage: $87,000 ($64.40)
- Tax - Property: $650,000 ($481.13)
General Sales and Gross Receipts: $221,000 ($163.58)
Public Utilities Sales: $37,000 ($27.39)
Hawkins government finances - Debt in 2017 (per resident):
- Short Term Debt Outstanding - Beginning: $279,000 ($206.51)
End of Fiscal Year: $227,000 ($168.02)
Hawkins government finances - Cash and Securities in 2017 (per resident):
- Other Funds - Cash and Securities: $1,454,000 ($1076.24)
Businesses in Hawkins, TX
- FedEx: 1
- SONIC Drive-In: 1
- Subway: 1
Strongest AM radio stations in Hawkins:
- KOFY (1060 AM; daytime; 10 kW; GILMER, TX; Owner: JERRY RUSSELL D/B/A THE RUSSELL COMPANY)
- KTBB (600 AM; 5 kW; TYLER, TX; Owner: CITADEL BROADCASTING COMPANY)
- KEEL (710 AM; 50 kW; SHREVEPORT, LA; Owner: CITICASTERS LICENSES, L.P.)
- KEES (1430 AM; 5 kW; GLADEWATER, TX; Owner: CITADEL BROADCASTING COMPANY)
- KFXR (1190 AM; 50 kW; DALLAS, TX; Owner: CLEAR CHANNEL BROADCASTING LICENSES, INC.)
- KWKH (1130 AM; 50 kW; SHREVEPORT, LA; Owner: CITICASTERS LICENSES, L.P.)
- KRLD (1080 AM; 50 kW; DALLAS, TX; Owner: TEXAS INFINITY BROADCASTING L.P.)
- KZEY (690 AM; 1 kW; TYLER, TX; Owner: COMMUNITY BROADCAST GROUP, INC.)
- WBAP (820 AM; 50 kW; FORT WORTH, TX; Owner: WBAP-KSCS OPERATING, LTD.)
- KSKY (660 AM; 20 kW; BALCH SPRINGS, TX; Owner: BISON MEDIA, INC.)
- KGLD (1330 AM; 1 kW; TYLER, TX; Owner: CITADEL BROADCASTING COMPANY)
- KESS (1270 AM; 50 kW; FORT WORTH, TX; Owner: KESS-AM LICENSE CORP.)
- KZMP (1540 AM; 50 kW; UNIVERSITY PARK, TX; Owner: ENTRAVISION HOLDINGS, LLC)
Strongest FM radio stations in Hawkins:
- KVNE (89.5 FM; TYLER, TX; Owner: EDUC. RADIO FOUND. OF E. TEXAS, INC.)
- KYKX (105.7 FM; LONGVIEW, TX; Owner: WALLER MEDIA, LLC)
- KFRO-FM (95.3 FM; GILMER, TX; Owner: WALLER MEDIA, LLC)
- KBLZ (102.7 FM; WINONA, TX; Owner: S.O. 2,000, LC)
- KNUE (101.5 FM; TYLER, TX; Owner: CAPSTAR TX LIMITED PARTNERSHIP)
- KGLY (91.3 FM; TYLER, TX; Owner: EDUC. RADIO FOUND. OF E. TEXAS, INC.)
- KOOI (106.5 FM; JACKSONVILLE, TX; Owner: WALLER BROADCASTING, INC.)
- KTAA (90.7 FM; BIG SANDY, TX; Owner: INSTITUTE IN BASIC LIFE PRINCIPLES, INC.)
- KKUS (104.1 FM; TYLER, TX; Owner: WALLER MEDIA, LLC)
- KBJS (90.3 FM; JACKSONVILLE, TX; Owner: EAST TEXAS MEDIA ASSOCIATION, INC.)
- KKTX-FM (96.1 FM; KILGORE, TX; Owner: CAPSTAR TX LIMITED PARTNERSHIP)
- KTPB (88.7 FM; KILGORE, TX; Owner: KILGORE JUNIOR COLLEGE)
- KTYL-FM (93.1 FM; TYLER, TX; Owner: CAPSTAR TX LIMITED PARTNERSHIP)
- KPXI (100.7 FM; OVERTON, TX; Owner: INSPIRATION MEDIA OF TEXAS, LLC)
- KIXK (99.3 FM; WHITE OAK, TX; Owner: REYNOLDS RADIO, INC.)
- KISX (107.3 FM; WHITEHOUSE, TX; Owner: CAPSTAR TX LIMITED PARTNERSHIP)
- K243AE (96.5 FM; TYLER, TX; Owner: CAPSTAR TX LIMITED PARTNERSHIP)
- KDOK (92.1 FM; TYLER, TX; Owner: CITADEL BROADCASTING COMPANY)
- KWNS (104.7 FM; WINNSBORO, TX; Owner: RICHARD E. FOSTER)
- K259AQ (99.7 FM; TYLER, TX; Owner: NORTH TEXAS PUBLIC BROADCASTING, INC.)
TV broadcast stations around Hawkins:
- KLTV (Channel 7; TYLER, TX; Owner: CIVCO, INC.)
- KFXK (Channel 51; LONGVIEW, TX; Owner: WARWICK COMMUNICATIONS, INC.)
- KETK-TV (Channel 56; JACKSONVILLE, TX; Owner: KETK LICENSEE L.P.)
- KLPN-LP (Channel 58; LONGVIEW, TX; Owner: WARWICK COMMUNICATIONS, INC.)
- KTPN-LP (Channel 48; TYLER, TX; Owner: WARWICK COMMUNICATIONS, INC.)
- K20DL (Channel 20; TYLER, TX; Owner: PROGRESSIVE CABLE COMMUNICATIONS)
- KLSB-TV (Channel 19; NACOGDOCHES, TX; Owner: KLSB ACQUISITION CORP.)
- KLGV-LP (Channel 10; LONGVIEW, TX; Owner: INTERNATIONAL BROADCASTING NETWORK)
Hawkins fatal accident list:
Sep 10, 2000 12:44 AM, Sr-80, Vehicles: 2, Persons: 3, Fatalities: 1
Aug 24, 1991 04:33 PM, 80, Vehicles: 2, Persons: 8, Fatalities: 1
Feb 10, 1978 10:30 PM, Vehicles: 1, Persons: 2, Fatalities: 1
- National Bridge Inventory (NBI) Statistics
- 7Number of bridges
- 230ft / 70.2mTotal length
- $1,034,000Total costs
- 19,071Total average daily traffic
- 975Total average daily truck traffic
- 26,830Total future (year 2029) average daily traffic
FCC Registered Antenna Towers:
57 (See the full list of FCC Registered Antenna Towers in Hawkins)FCC Registered Commercial Land Mobile Towers:
1 (See the full list of FCC Registered Commercial Land Mobile Towers in Hawkins, TX)FCC Registered Broadcast Land Mobile Towers:
10 (See the full list of FCC Registered Broadcast Land Mobile Towers)FCC Registered Microwave Towers:
7- Crow Tap Substation, On Fm778, 1.54 Mi. North Of Us80 (Lat: 32.638444 Lon: -95.314750), Type: Pole, Structure height: 36.8 m, Call Sign: WQNN556,
Assigned Frequencies: 934.375 MHz, Grant Date: 06/24/2021, Expiration Date: 03/31/2031, Certifier: David L Huffman Mr., Registrant: Huffman Communications & Eng, 2829 W. 7th Ave., Corsicana, TX 75151-1753, Phone: (903) 872-8306, Fax: (903) 872-6032, Email:
- Pine Mills, Lat: 32.698889 Lon: -95.270278, Type: Gtower, Structure height: 121.9 m, Call Sign: WQPH984,
Assigned Frequencies: 3650.00 MHz, Grant Date: 05/24/2012, Expiration Date: 05/24/2022, Cancellation Date: 06/01/2022, Certifier: Steven Steele, Registrant: Herman & Whiteaker, LLC, 3204 Tower Oaks Blvd., Suite 180, Rockville, MD 20852, Phone: (202) 600-7273, Fax: (202) 706-6056, Email:
- Hawkins, Lat: 32.608889 Lon: -95.206111, Type: Ltower, Structure height: 56.7 m, Call Sign: WQPH984,
Assigned Frequencies: 3650.00 MHz, Grant Date: 05/24/2012, Expiration Date: 05/24/2022, Cancellation Date: 06/01/2022, Certifier: Steven Steele, Registrant: Herman & Whiteaker, LLC, 3204 Tower Oaks Blvd., Suite 180, Rockville, MD 20852, Phone: (202) 600-7273, Fax: (202) 706-6056, Email:
- Pine Mills 210, Lat: 32.698889 Lon: -95.270278, Type: Gtower, Structure height: 121.9 m, Call Sign: WQPH984,
Assigned Frequencies: 3650.00 MHz, Grant Date: 05/24/2012, Expiration Date: 05/24/2022, Cancellation Date: 06/01/2022, Certifier: Steven Steele, Registrant: Herman & Whiteaker, LLC, 3204 Tower Oaks Blvd., Suite 180, Rockville, MD 20852, Phone: (202) 600-7273, Fax: (202) 706-6056, Email:
- Pine Mills 330, Lat: 32.698889 Lon: -95.270278, Type: Gtower, Structure height: 121.9 m, Call Sign: WQPH984,
Assigned Frequencies: 3650.00 MHz, Grant Date: 05/24/2012, Expiration Date: 05/24/2022, Cancellation Date: 06/01/2022, Certifier: Steven Steele, Registrant: Herman & Whiteaker, LLC, 3204 Tower Oaks Blvd., Suite 180, Rockville, MD 20852, Phone: (202) 600-7273, Fax: (202) 706-6056, Email:
- CROW, 6970 Fm 778 (Lat: 32.619056 Lon: -95.314944), Type: Gtower, Structure height: 59 m, Call Sign: WQRM215,
Assigned Frequencies: 11075.0 MHz, 10895.0 MHz, 10895.0 MHz, 10895.0 MHz, 10895.0 MHz, 10895.0 MHz, 10895.0 MHz, 10895.0 MHz, 10895.0 MHz, 10895.0 MHz... (+5 more), Grant Date: 05/16/2023, Expiration Date: 06/17/2033, Certifier: Richard Blake, Registrant: Skynet Country Inc, 119 E. Pacific Ave, Gladewater, TX 75647, Phone: (903) 752-2799, Email:
- Bird Tower, Cr3811 (Lat: 32.648222 Lon: -95.255500), Type: Ltower, Structure height: 53 m, Overall height: 54 m, Call Sign: WRJC465,
Assigned Frequencies: 10835.0 MHz, 11325.0 MHz, 10835.0 MHz, 11325.0 MHz, 10835.0 MHz, 11325.0 MHz, 10835.0 MHz, 11325.0 MHz, 10835.0 MHz, 11325.0 MHz... (+10 more), Grant Date: 08/05/2020, Expiration Date: 08/05/2030, Certifier: Chad Wachter, Registrant: Lerman Senter Pllc, 2001 L Street Nw Suite 400, Washington, DC 20036, Phone: (202) 416-6744, Email:
FCC Registered Amateur Radio Licenses:
40 (See the full list of FCC Registered Amateur Radio Licenses in Hawkins)FAA Registered Aircraft Manufacturers and Dealers:
1 (See the full list of FAA Registered Manufacturers and Dealers in Hawkins)FAA Registered Aircraft:
11 (See the full list of FAA Registered Aircraft)2003 - 2018 National Fire Incident Reporting System (NFIRS) incidents
- Fire incident types reported to NFIRS in Hawkins, TX
- 38270.2%Outside Fires
- 13424.6%Structure Fires
- 173.1%Mobile Property/Vehicle Fires
- 112.0%Other
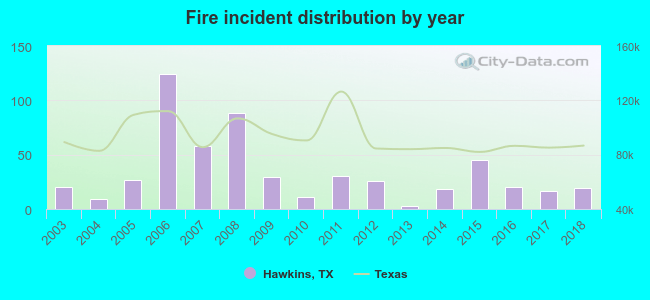 According to the data from the years 2003 - 2018 the average number of fire incidents per year is 34. The highest number of reported fire incidents - 124 took place in 2006, and the least - 3 in 2013. The data has a declining trend.
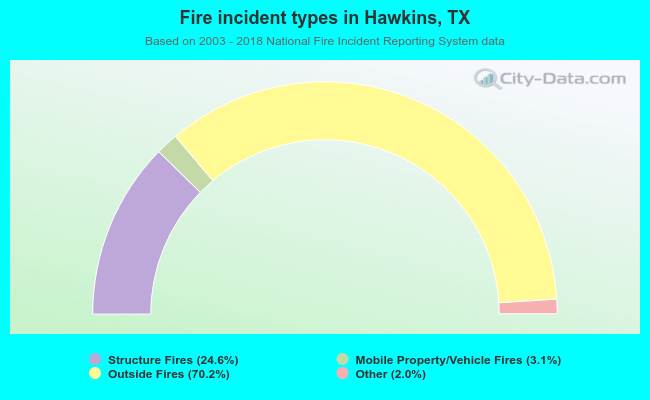 When looking into fire subcategories, the most reports belonged to: Outside Fires (70.2%), and Structure Fires (24.6%).
| Most common first names in Hawkins, TX among deceased individuals | ||
| Name | Count | Lived (average) |
|---|---|---|
| James | 39 | 71.0 years |
| Mary | 33 | 81.6 years |
| Robert | 33 | 76.4 years |
| John | 26 | 77.2 years |
| William | 17 | 79.0 years |
| George | 15 | 75.5 years |
| Charles | 14 | 65.7 years |
| Willie | 13 | 72.1 years |
| Billy | 12 | 61.1 years |
| Jessie | 10 | 77.7 years |
| Most common last names in Hawkins, TX among deceased individuals | ||
| Last name | Count | Lived (average) |
|---|---|---|
| Smith | 23 | 80.5 years |
| Hall | 21 | 75.7 years |
| Davis | 21 | 67.4 years |
| Brown | 16 | 70.1 years |
| Johnson | 15 | 74.4 years |
| Williams | 13 | 78.1 years |
| Wilson | 12 | 79.0 years |
| Turner | 12 | 80.9 years |
| Snider | 12 | 85.3 years |
| Taylor | 11 | 73.8 years |
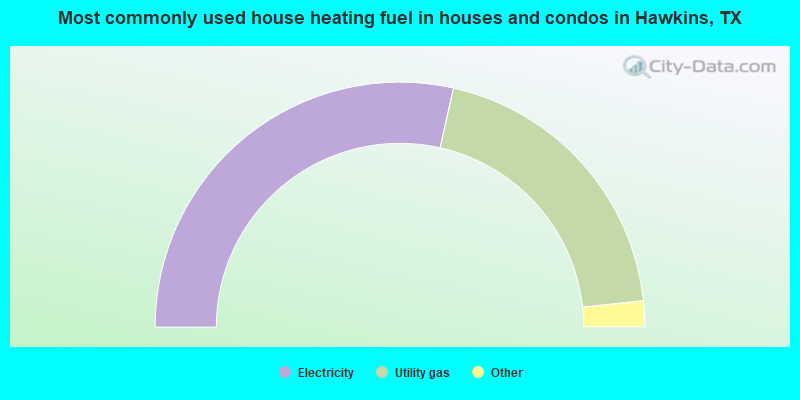
- 57.1%Electricity
- 39.6%Utility gas
- 1.8%Bottled, tank, or LP gas
- 1.5%Wood
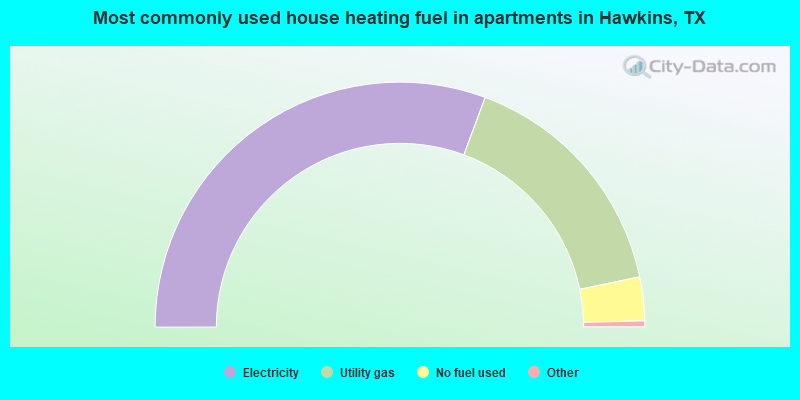
- 61.8%Electricity
- 32.4%Utility gas
- 5.8%No fuel used
Hawkins compared to Texas state average:
- Median house value significantly below state average.
- Black race population percentage significantly above state average.
- Hispanic race population percentage significantly below state average.
- Median age above state average.
- Foreign-born population percentage significantly below state average.
- Length of stay since moving in significantly above state average.
Hawkins on our top lists:
- #68 on the list of "Top 101 cities with the largest percentage of people in other noninstitutional group quarters (population 1,000+)"

|
Total of 1 patent application in 2008-2024.