Floyd County, Virginia (VA)
County owner-occupied free and clear houses and condos in 2010: 2,463
County owner-occupied houses and condos in 2000: 4,738
Renter-occupied apartments: 1,300 (it was 1,053 in 2000)
| % of renters here: | 18% |
| State: | 33% |
Land area: 381 sq. mi.
Water area: 0.0 sq. mi.
Population density: 41 people per square mile (average).
Industries providing employment: Educational, health and social services (25.4%), Manufacturing (20.7%).
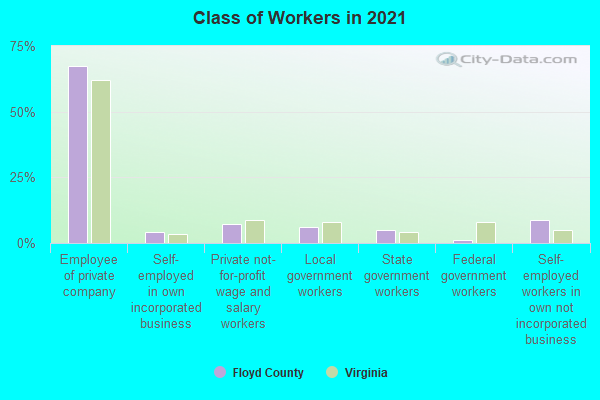
Type of workers:
- Private wage or salary: 82%
- Government: 11%
- Self-employed, not incorporated: 7%
- Unpaid family work: 0%
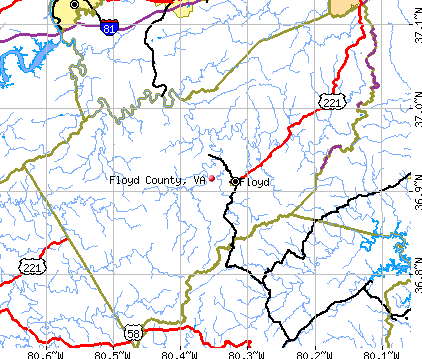
- OSM Map
- General Map
- Google Map
- MSN Map

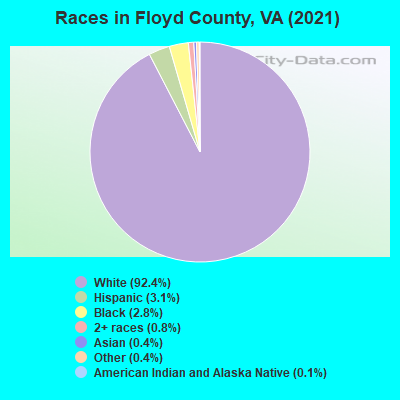
- 14,18592.3%White Non-Hispanic Alone
- 4773.1%Hispanic or Latino
- 4663.0%Black Non-Hispanic Alone
- 1190.8%Two or more races
- 600.4%Asian alone
- 460.3%Some other race alone
- 160.1%American Indian and Alaska Native alone
| Median resident age: | 48.8 years |
| Virginia median age: | 39.0 years |
| Males: 7,703 | |
| Females: 7,935 |

 | Most important city in Virginia? (31 replies) |
| Trip to VA - looking for home - Floyd + ? (16 replies) |
| Best county for alternative building (21 replies) |
| Realtor Recommendations for a few locations in VA (1 reply) |
| Romantic getaways in VA (9 replies) |
| Possible retirement to Elkton, Staunton, Monterey, or Floyd areas. (23 replies) |
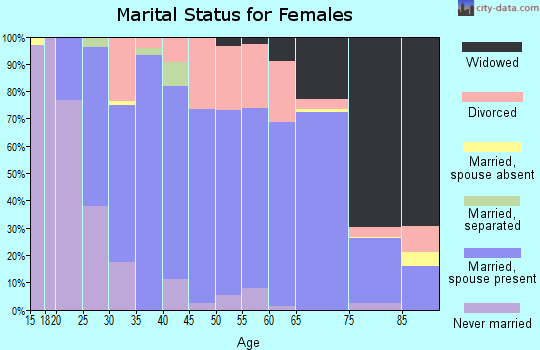
| Floyd County: | 2.0 people |
| Virginia: | 3 people |
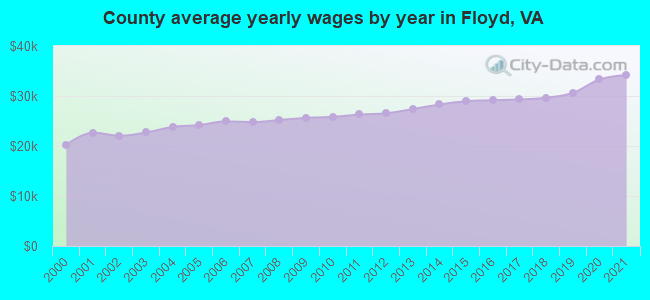
Estimated median household income in 2022: $56,244 ($31,585 in 1999)
| This county: | $56,244 |
| Virginia: | $85,873 |
Median contract rent in 2022 for apartments: $571 (lower quartile is $403, upper quartile is $725)
| This county: | $571 |
| State: | $1270 |
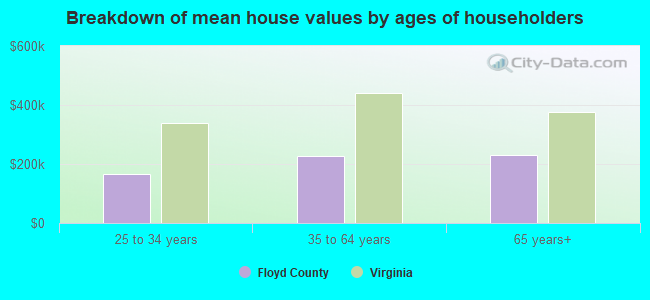
Estimated median house or condo value in 2022: $221,056 (it was $78,300 in 2000)
| Floyd: | $221,056 |
| Virginia: | $365,700 |
Median monthly housing costs for homes and condos with a mortgage: $1,254
Median monthly housing costs for units without a mortgage: $321
Institutionalized population: 85
Crime in 2021 (reported by the sheriff's office or county police, not the county total):
- Murders: 0
- Rapes: 6
- Robberies: 1
- Assaults: 4
- Burglaries: 10
- Thefts: 50
- Auto thefts: 4
Crime in 2020 (reported by the sheriff's office or county police, not the county total):
- Murders: 1
- Rapes: 8
- Robberies: 0
- Assaults: 9
- Burglaries: 13
- Thefts: 44
- Auto thefts: 4
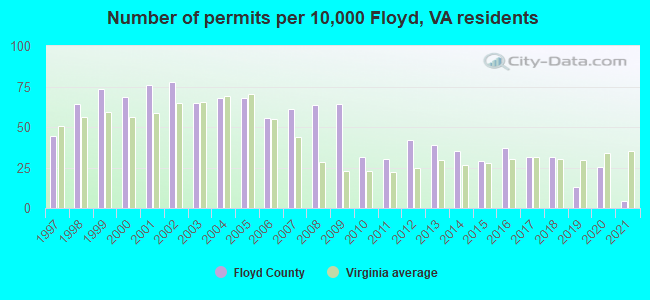
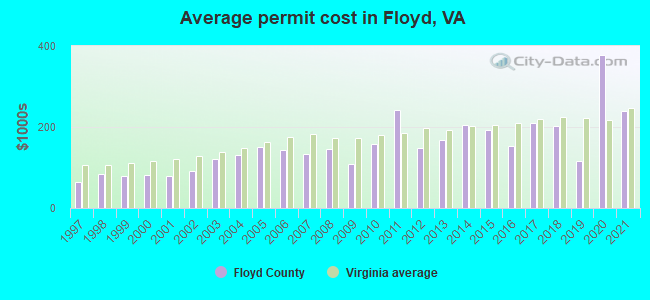
Single-family new house construction building permits:
- 2022: 44 buildings, average cost: $240,100
- 2021: 6 buildings, average cost: $240,100
- 2020: 35 buildings, average cost: $377,500
- 2019: 18 buildings, average cost: $115,200
- 2018: 44 buildings, average cost: $201,600
- 2017: 44 buildings, average cost: $211,200
- 2016: 51 buildings, average cost: $152,300
- 2015: 40 buildings, average cost: $191,500
- 2014: 49 buildings, average cost: $204,800
- 2013: 54 buildings, average cost: $167,800
- 2012: 58 buildings, average cost: $148,500
- 2011: 42 buildings, average cost: $242,700
- 2010: 44 buildings, average cost: $157,200
- 2009: 89 buildings, average cost: $107,500
- 2008: 88 buildings, average cost: $144,500
- 2007: 85 buildings, average cost: $134,000
- 2006: 77 buildings, average cost: $142,200
- 2005: 94 buildings, average cost: $150,600
- 2004: 94 buildings, average cost: $130,500
- 2003: 90 buildings, average cost: $120,100
- 2002: 108 buildings, average cost: $91,200
- 2001: 105 buildings, average cost: $79,800
- 2000: 95 buildings, average cost: $82,200
- 1999: 102 buildings, average cost: $80,100
- 1998: 89 buildings, average cost: $84,400
- 1997: 62 buildings, average cost: $64,100
Median real estate property taxes paid for housing units with mortgages in 2022: $1,172 (0.5%)
Median real estate property taxes paid for housing units with no mortgage in 2022: $1,113 (0.5%)
| Floyd County: | 10.0% |
| Virginia: | 10.6% |
Median age of residents in 2022: 48.8 years old
(Males: 46.7 years old, Females: 51.1 years old)
(Median age for: White residents: 48.2 years old, Black residents: 63.4 years old, Asian residents: 51.4 years old, Hispanic or Latino residents: 34.7 years old, Other race residents: 53.4 years old)
Fair market rent in 2006 for a 1-bedroom apartment in Floyd County is $482 a month.
Fair market rent for a 2-bedroom apartment is $534 a month.
Fair market rent for a 3-bedroom apartment is $743 a month.
Cities in this county include: Floyd.
Notable locations in this county outside city limits:
Notable locations in Floyd County: Aryins Store (A), Red Level (B), Kunath Store (C), Traffic (D), Crymes Store (E), Double Bridges (F), Robertson Store (G), Meherrin Volunteer Fire / Rescue (H), Palmer Springs Volunteer Fire Department (I). Display/hide their locations on the map
Churches in Floyd County include: Providence Church (A), Antioch Church (B), Reedy Church (C), Bethany Church (D), Bethel Church (E), Rosebud Church (F), Saint Marks Church (G), Saint Matthews Church (H), Salem Church (I). Display/hide their locations on the map
Cemeteries: Bailey Cemetery (1), Bell Cemetery (2), Bruce Cemetery (3), Gregory Cemetery (4), Hite Cemetery (5), Manson Cemetery (6), Marshall Cemetery (7). Display/hide their locations on the map
Reservoirs: Nottoway Falls Reservoir (A), Modest Creek Reservoir (B), Dixons Millpond (C), Sneads Pond (D), Dixon Millpond (E), Victoria Lake (F), Blakenship Mill Pond (G). Display/hide their locations on the map
Streams, rivers, and creeks: Turkey Egg Creek (A), Stony Creek (B), Stokes Creek (C), Still Branch (D), Spring Creek (E), Sewish Creek (F), Seay Creek (G), Saint Johns Creek (H), Reedy Creek (I). Display/hide their locations on the map
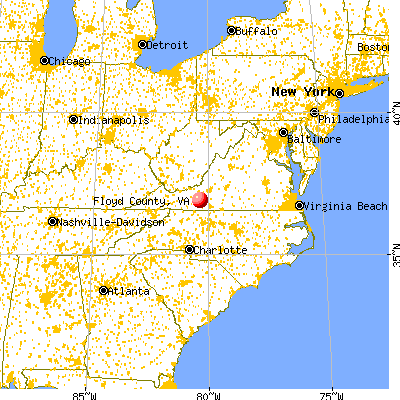
Neighboring counties: Conejos County, Colorado  , Lee County , Knox County, Kentucky , Scott County, Missouri , Colonial Heights city
  .
.
| Here: | 2.6% |
| Virginia: | 2.7% |

Current college students: 405
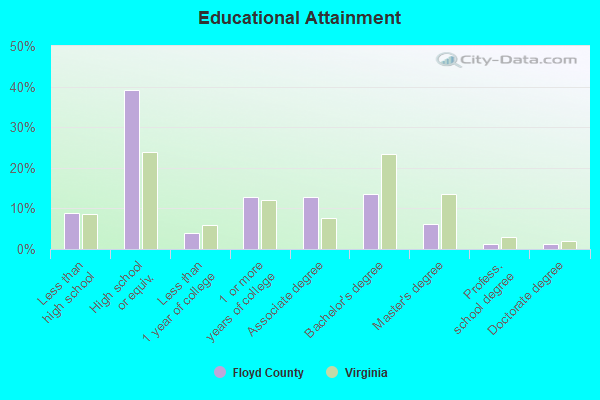
People 25 years of age or older with a high school degree or higher: 90.8%
People 25 years of age or older with a bachelor's degree or higher: 23.2%
Number of foreign born residents: 470 (58.0% naturalized citizens)
| Floyd County: | 3.0% |
| Whole state: | 12.7% |
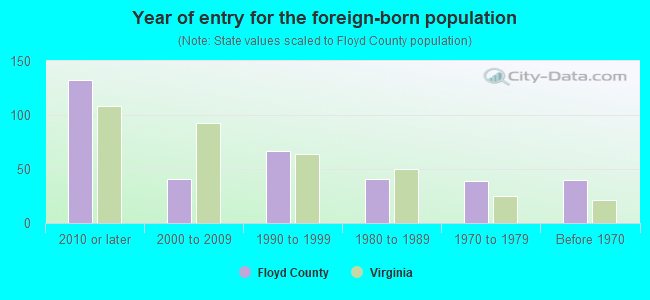
- Year of entry for the foreign-born population
- 1422010 or later
- 972000 to 2009
- 561990 to 1999
- 411980 to 1989
- 391970 to 1979
- 40Before 1970
Mean travel time to work (commute): minutes
Percentage of county residents living and working in this county: 100.7%
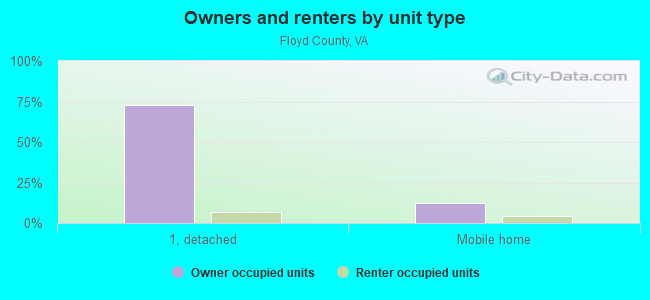
Housing units in structures:
- One, detached: 6,393
- One, attached: 29
- Two: 87
- 3 or 4: 6
- 5 to 9: 23
- 10 to 19: 6
- 20 or more: 63
- Mobile homes: 1,410
- Boats, RVs, vans, etc.: 5
Housing units in Floyd County with a mortgage: 2,610 (270 second mortgage, 0 home equity loan, 229 both second mortgage and home equity loan)
Houses without a mortgage: 180
| Here: | 1.1% with mortgage |
| State: | 97.2% with mortgage |
Religion statistics for Floyd County
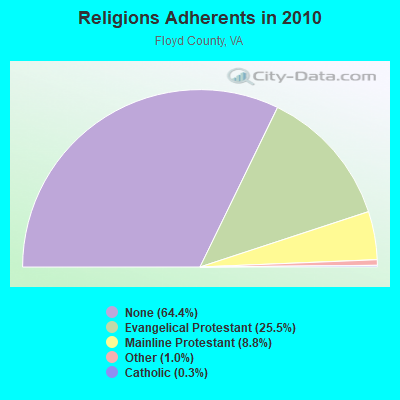
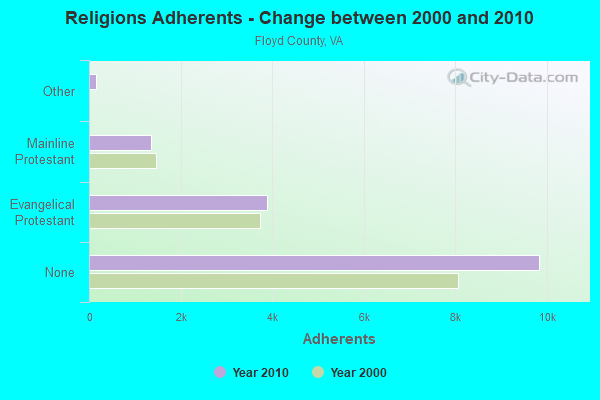
| Religion | Adherents | Congregations |
|---|---|---|
| Evangelical Protestant | 3,890 | 32 |
| Mainline Protestant | 1,345 | 17 |
| Other | 156 | 3 |
| Catholic | 53 | 1 |
| None | 9,835 | - |
Source: Clifford Grammich, Kirk Hadaway, Richard Houseal, Dale E.Jones, Alexei Krindatch, Richie Stanley and Richard H.Taylor. 2012. 2010 U.S.Religion Census: Religious Congregations & Membership Study. Association of Statisticians of American Religious Bodies. Jones, Dale E., et al. 2002. Congregations and Membership in the United States 2000. Nashville, TN: Glenmary Research Center.
Food Environment Statistics:
| Floyd County: | 1.37 / 10,000 pop. |
| State: | 2.03 / 10,000 pop. |
| This county: | 1.37 / 10,000 pop. |
| Virginia: | 1.43 / 10,000 pop. |
| Floyd County: | 4.11 / 10,000 pop. |
| Virginia: | 4.03 / 10,000 pop. |
| This county: | 6.85 / 10,000 pop. |
| State: | 7.65 / 10,000 pop. |
| Floyd County: | 9.4% |
| Virginia: | 9.3% |
| Floyd County: | 26.0% |
| State: | 26.7% |
| Here: | 15.3% |
| State: | 18.6% |
Agriculture in Floyd County:
Average size of farms: 163 acresAverage value of agricultural products sold per farm: $39,567
Average value of crops sold per acre for harvested cropland: $338.93
The value of nursery, greenhouse, floriculture, and sod as a percentage of the total market value of agricultural products sold: 22.19%
The value of livestock, poultry, and their products as a percentage of the total market value of agricultural products sold: 68.29%
Average total farm production expenses per farm: $33,402
Harvested cropland as a percentage of land in farms: 22.68%
Average market value of all machinery and equipment per farm: $32,136
The percentage of farms operated by a family or individual: 91.07%
Average age of principal farm operators: 58 years
Average number of cattle and calves per 100 acres of all land in farms: 25.42
Milk cows as a percentage of all cattle and calves: 3.21%
Corn for grain: 506 harvested acres
Vegetables: 140 harvested acres
Land in orchards: 119 acres
Tornado activity:
Floyd County historical area-adjusted tornado activity is significantly below Virginia state average. It is 12585254.2 times below overall U.S. average.Earthquake activity:
Floyd County-area historical earthquake activity is significantly above Virginia state average. It is 23% smaller than the overall U.S. average.On 8/23/2011 at 17:51:04, a magnitude 5.8 (5.8 MW, Depth: 3.7 mi, Class: Moderate, Intensity: VI - VII) earthquake occurred 149.6 miles away from Floyd County center
On 8/9/2020 at 12:07:37, a magnitude 5.1 (5.1 MW, Depth: 4.7 mi) earthquake occurred 51.0 miles away from the county center
On 7/27/1980 at 18:52:21, a magnitude 5.2 (5.1 MB, 4.7 MS, 5.0 UK, 5.2 UK) earthquake occurred 216.0 miles away from the county center
On 11/2/2006 at 17:53:02, a magnitude 4.3 (4.3 MB, Depth: 0.6 mi, Class: Light, Intensity: IV - V) earthquake occurred 88.6 miles away from the county center
On 11/23/2006 at 10:42:57, a magnitude 4.3 (4.3 MB) earthquake occurred 91.0 miles away from Floyd County center
On 12/9/2003 at 20:59:18, a magnitude 4.5 (4.5 ML, Depth: 6.2 mi) earthquake occurred 137.5 miles away from the county center
Magnitude types: body-wave magnitude (MB), local magnitude (ML), surface-wave magnitude (MS), moment magnitude (MW)
Most recent natural disasters:
- Virginia Covid-19 Pandemic, Incident Period: January 20, 2020, Major Disaster (Presidential) Declared DR-4512-VA: April 2, 2020, FEMA Id: 4512, Natural disaster type: Other
- Virginia Tropical Storm Michael, Incident Period: October 9, 2018 - October 16, 2018, FEMA Id: 4411, Natural disaster type: Tropical Storm
- Virginia Hurricane Florence, Incident Period: September 8, 2018 - September 21, 2018, FEMA Id: 4401, Natural disaster type: Hurricane
- Virginia Hurricane Sandy, Incident Period: October 26, 2012 to November 01, 2012, Emergency Declared EM-3359: October 29, 2012, FEMA Id: 3359, Natural disaster type: Hurricane
- Virginia Severe Storms and Straight-line Winds, Incident Period: June 29, 2012 to July 01, 2012, Major Disaster (Presidential) Declared DR-4072: July 27, 2012, FEMA Id: 4072, Natural disaster type: Storm, Wind
- Virginia Severe Storms, Tornadoes, and Flooding, Incident Period: June 23, 2006 to July 06, 2006, Major Disaster (Presidential) Declared DR-1655: July 13, 2006, FEMA Id: 1655, Natural disaster type: Storm, Tornado, Flood
- Virginia Hurricane Katrina Evacuation, Incident Period: August 29, 2005 to October 01, 2005, Emergency Declared EM-3240: September 12, 2005, FEMA Id: 3240, Natural disaster type: Hurricane
- Virginia Severe Storms and Flooding from the remnants of Hurricane Jeanne, Incident Period: September 27, 2004 to September 30, 2004, Major Disaster (Presidential) Declared DR-1570: October 18, 2004, FEMA Id: 1570, Natural disaster type: Storm, Hurricane, Flood
- Virginia Severe Winter Storm, Snowfall, Heavy Rain, Flooding, and Mudslides, Incident Period: February 15, 2003 to February 28, 2003, Major Disaster (Presidential) Declared DR-1458: March 27, 2003, FEMA Id: 1458, Natural disaster type: Winter Storm, Mudslide, Flood, Heavy Rain, Snowfall
- Virginia Winter Storm, Incident Period: January 25, 2000 to January 30, 2000, Major Disaster (Presidential) Declared DR-1318: February 28, 2000, FEMA Id: 1318, Natural disaster type: Winter Storm
- 6 other natural disasters have been reported since 1953.
The number of natural disasters in Floyd County (16) is near the US average (15).
Major Disasters (Presidential) Declared: 10
Emergencies Declared: 4
Causes of natural disasters: Floods: 5, Storms: 5, Hurricanes: 4, Winter Storms: 3, Tropical Storms: 2, Blizzard: 1, Drought: 1, Heavy Rain: 1, Ice Storm: 1, Mudslide: 1, Snowfall: 1, Tornado: 1, Wind: 1, Other: 1 (Note: some incidents may be assigned to more than one category).
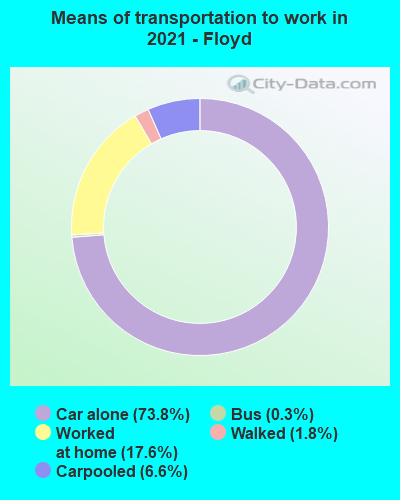
Means of transportation to work:
- Drove a car alone: 3,374 (71.1%)
- Carpooled: 296 (6.2%)
- Bus: 3 (0.1%)
- Walked: 111 (2.3%)
- Worked at home: 1,014 (21.4%)
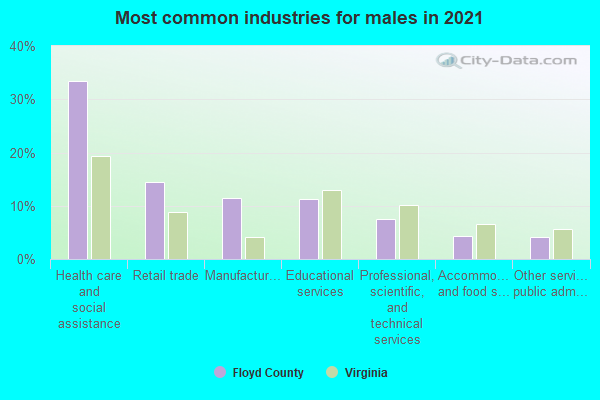
- Health care and social assistance (33%)
- Retail trade (14%)
- Educational services (10%)
- Manufacturing (10%)
- Professional, scientific, and technical services (8%)
- Accommodation and food services (5%)
- Finance and insurance (5%)
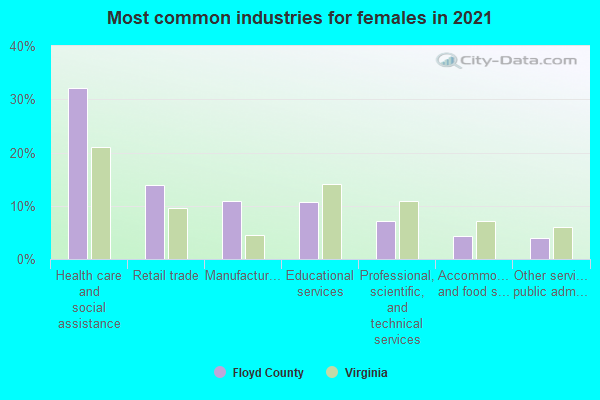
- Health care and social assistance (33%)
- Retail trade (13%)
- Educational services (10%)
- Manufacturing (10%)
- Professional, scientific, and technical services (8%)
- Accommodation and food services (5%)
- Finance and insurance (4%)
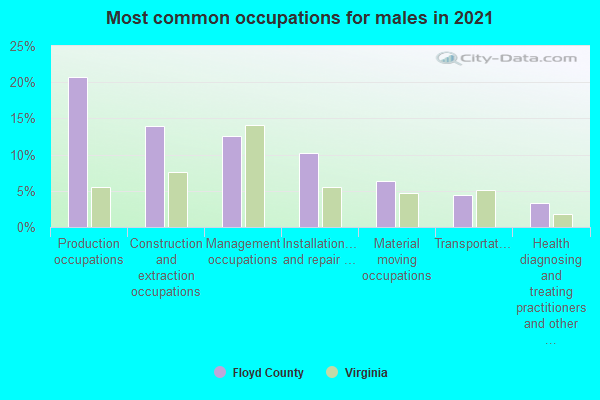
- Production occupations (20%)
- Construction and extraction occupations (13%)
- Management occupations (13%)
- Installation, maintenance, and repair occupations (9%)
- Material moving occupations (7%)
- Sales and related occupations (4%)
- Transportation occupations (4%)
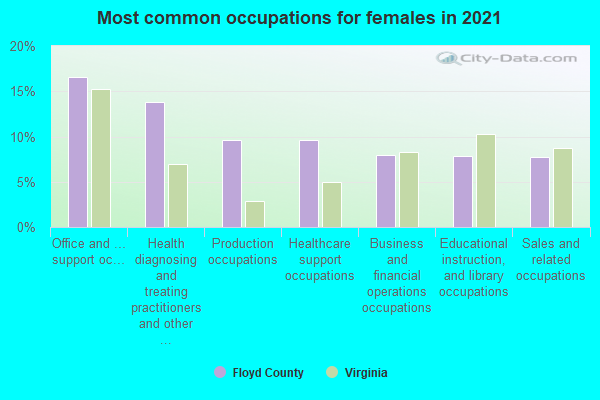
- Health diagnosing and treating practitioners and other technical occupations (15%)
- Office and administrative support occupations (15%)
- Healthcare support occupations (12%)
- Production occupations (8%)
- Educational instruction, and library occupations (8%)
- Sales and related occupations (7%)
- Business and financial operations occupations (7%)
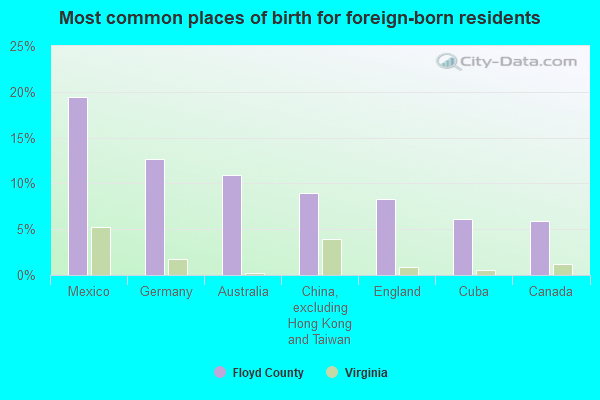
- Mexico (26%)
- Australia (18%)
- Cuba (17%)
- Germany (14%)
- China, excluding Hong Kong and Taiwan (9%)
- Canada (4%)
- United Kingdom, excluding England and Scotland (3%)
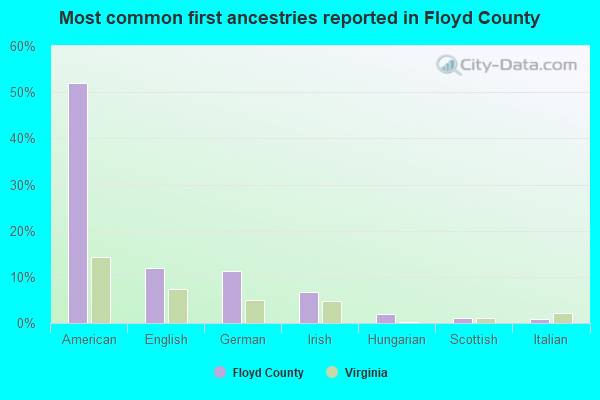
- American (49%)
- English (12%)
- German (11%)
- Irish (5%)
- Scottish (2%)
- Italian (1%)
- European (1%)
54 people in nursing homes
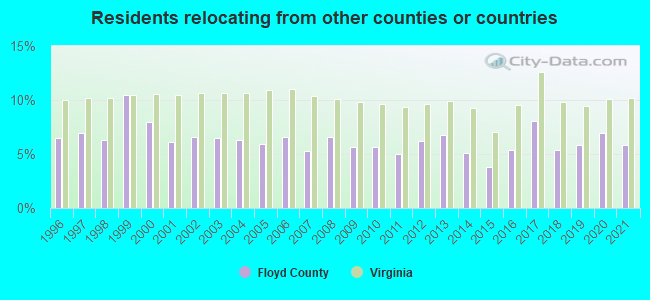
5.86% of this county's 2021 resident taxpayers lived in other counties in 2020 ($67,912 average adjusted gross income)
| Here: | 5.86% |
| Virginia average: | 10.16% |
10 or fewer of this county's residents moved from foreign countries.
4.21% relocated from other counties in Virginia ($36,150 average AGI)
1.65% relocated from other states ($31,762 average AGI)
Floyd County: 1.65% Virginia average: 3.91%
Top counties from which taxpayers relocated into this county between 2020 and 2021:
| from Montgomery County, VA | |
| from Roanoke County, VA | |
| from Roanoke city, VA |
4.80% of this county's 2020 resident taxpayers moved to other counties in 2021 ($40,330 average adjusted gross income)
| Here: | 4.80% |
| Virginia average: | 10.20% |
10 or fewer of this county's residents moved to foreign countries.
3.67% relocated to other counties in Virginia ($32,293 average AGI)
1.13% relocated to other states ($8,036 average AGI)
Floyd County: 1.13% Virginia average: 3.98%

Top counties to which taxpayers relocated from this county between 2020 and 2021:
| to Montgomery County, VA |
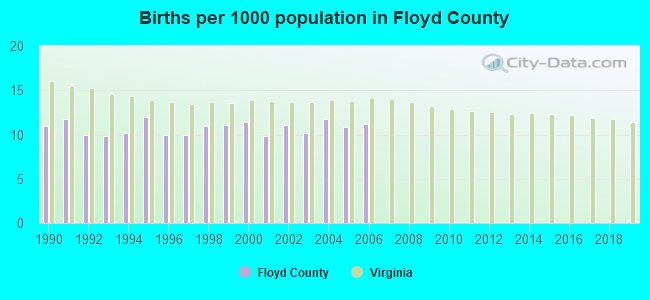
Births per 1000 population from 1990 to 1999: 10.6
Births per 1000 population from 2000 to 2006: 10.9
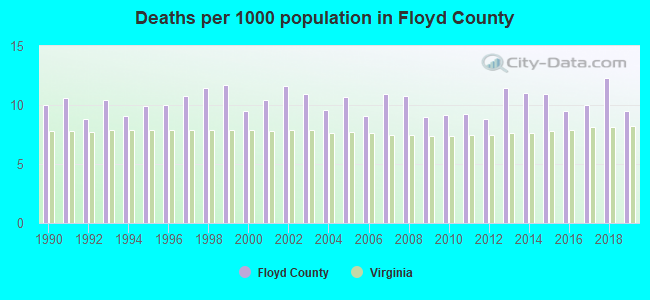
Deaths per 1000 population from 1990 to 1999: 10.3
Deaths per 1000 population from 2000 to 2009: 10.2
Deaths per 1000 population from 2010 to 2020: 10.6
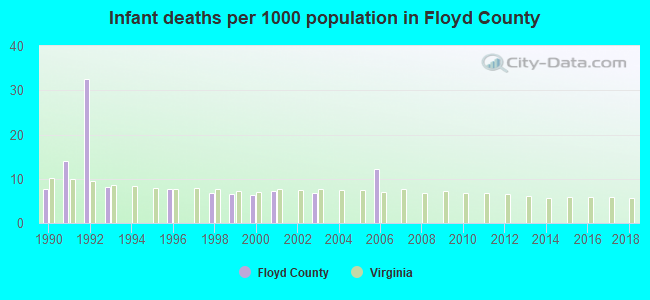
Infant deaths per 1000 live births from 1990 to 1999: 8.3
Infant deaths per 1000 live births from 2000 to 2006: 4.7
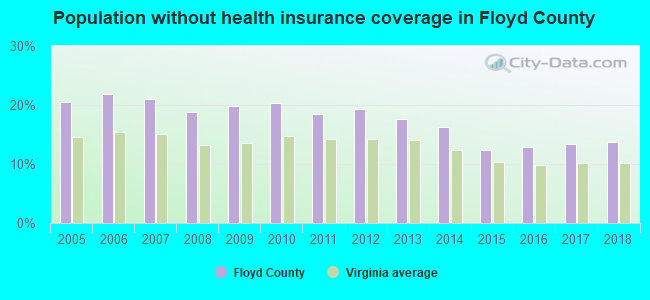
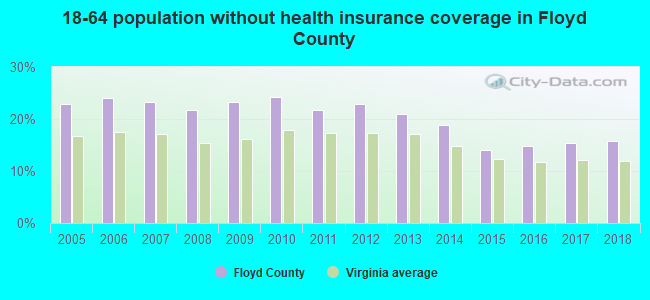
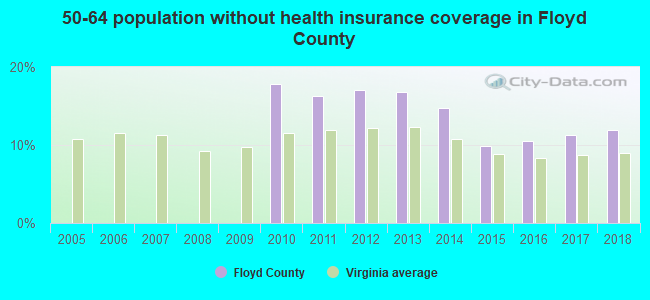
Persons under 19 years old without health insurance coverage in 2018: 7.5%


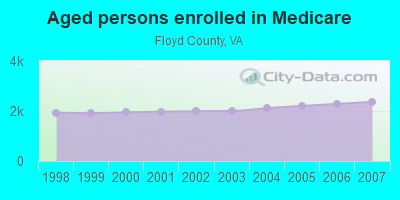
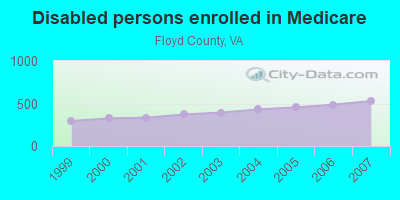
Persons enrolled in hospital insurance and/or supplemental medical insurance (Medicare) in July 1, 2007: 2,895 (2,366 aged, 529 disabled)
Children under 18 without health insurance coverage in 2007: 433 (14%)

Most common underlying causes of death in Floyd County, Virginia in 1999 - 2019:
- Acute myocardial infarction, unspecified (98)
- Unspecified dementia (81)
- Bronchus or lung, unspecified - Malignant neoplasms (65)
- Atherosclerotic heart disease (59)
- Chronic obstructive pulmonary disease, unspecified (24)
Population without health insurance coverage in 2000: 12%
Children under 18 without health insurance coverage in 2000: 9%
Medical specialist MDs per 100,000 population in 2005: 1,038
Dentists per 100,000 population in 1998: 7
Total births per 100,000 population, July 2005 - July 2006 : 23
Total deaths per 100,000 population, July 2005 - July 2006: 55
Limited-service eating places per 100,000 population in 2005 : 7
Household type by relationship:
Households: 15,638- Male householders: 3,601 (1,191 living alone), Female householders: 3,234 (913 living alone)
3,534 spouses (3,517 opposite-sex spouses), 349 unmarried partners, (321 opposite-sex unmarried partners), 3,992 children (3,742 natural, 98 adopted, 150 stepchildren), 171 grandchildren, 133 brothers or sisters, 74 parents, 0 foster children, 185 other relatives, 304 non-relatives
- In group quarters: 105
Size of family households: 2,397 2-persons, 1,005 3-persons, 668 4-persons, 224 5-persons, 50 6-persons, 8 7-or-more-persons.
Size of nonfamily households: 2,102 1-person, 299 2-persons, 28 3-persons, 39 4-persons, 10 5-persons.
1,994 married couples with children.
638 single-parent households (348 men, 290 women).
95.6% of residents of Floyd speak English at home.
3.0% of residents speak Spanish at home (70% speak English very well, 18% speak English well, 7% speak English not well, 6% don't speak English at all).
0.7% of residents speak other Indo-European language at home (100% speak English very well).
0.4% of residents speak Asian or Pacific Island language at home (45% speak English very well, 35% speak English well, 20% speak English not well).
0.2% of residents speak other language at home (72% speak English very well, 28% speak English well).
In fiscal year 2004:
Federal Government expenditure: $62,615,000 ($4,329 per capita)
Department of Defense expenditure: $1,405,000
Federal direct payments to individuals for retirement and disability: $35,715,000
Federal other direct payments to individuals: $14,198,000
Federal direct payments not to individuals: $172,000
Federal grants: $8,807,000
Federal procurement contracts: $1,026,000 ($0,000 Department of Defense)
Federal salaries and wages: $2,698,000 ($0,000 Department of Defense)
Federal Government direct loans: $4,000
Federal guaranteed/insured loans: $3,199,000
Federal Government insurance: $2,509,000
Population change from April 1, 2000 to July 1, 2005:
Births: 789| Here: | 54 per 1000 residents |
| State: | 70 per 1000 residents |
Deaths: 788
| Here: | 54 per 1000 residents |
| State: | 40 per 1000 residents |
Net international migration: +79
| Here: | +5 per 1000 residents |
| State: | +18 per 1000 residents |
Net internal migration: +712
| Here: | +49 per 1000 residents |
| State: | +14 per 1000 residents |
Total withdrawal of fresh water for public supply: 0.12 millions of gallons per day (all from ground)
| Here: | 5.8 |
| State: | 7.0 |
| Here: | 5.0 |
| State: | 4.3 |
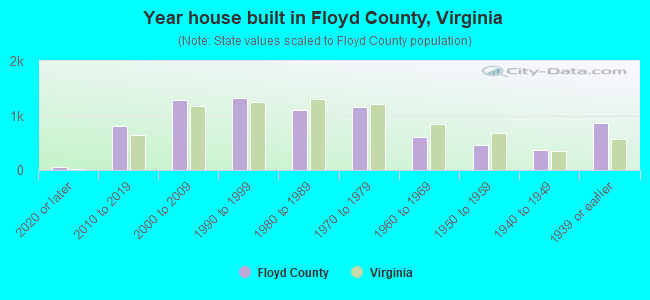
- Year house built in Floyd County, Virginia
- 452020 or later
- 8212010 to 2019
- 1,4382000 to 2009
- 1,4041990 to 1999
- 9681980 to 1989
- 1,0331970 to 1979
- 5071960 to 1969
- 5561950 to 1959
- 4071940 to 1949
- 8221939 or earlier
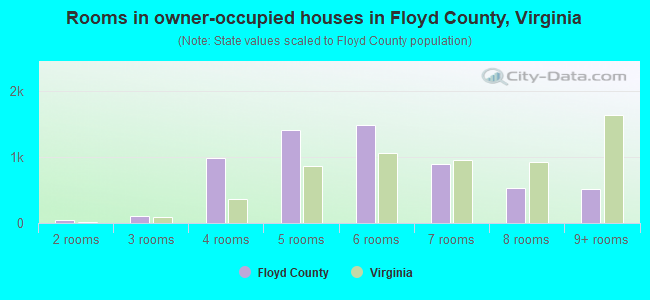
- Rooms in owner-occupied houses in Floyd County, Virginia
- 01 room
- 642 rooms
- 1243 rooms
- 1,0854 rooms
- 1,2575 rooms
- 1,5726 rooms
- 8547 rooms
- 4658 rooms
- 5559+ rooms

- Rooms in renter-occupied apartments in Floyd County, Virginia
- 711 room
- 402 rooms
- 753 rooms
- 1544 rooms
- 1995 rooms
- 1506 rooms
- 1587 rooms
- 278 rooms
- 459+ rooms

- Bedrooms in owner-occupied houses in Floyd County, Virginia
- 0no bedroom
- 2401 bedroom
- 1,1982 bedrooms
- 3,4343 bedrooms
- 9234 bedrooms
- 1235+ bedrooms
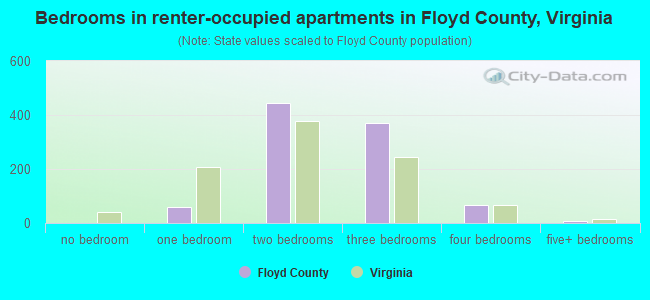
- Bedrooms in renter-occupied apartments in Floyd County, Virginia
- 72no bedroom
- 821 bedroom
- 2802 bedrooms
- 3853 bedrooms
- 754 bedrooms
- 295+ bedrooms
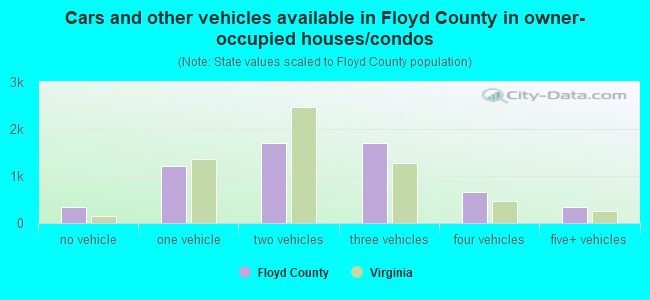
- Cars and other vehicles available in Floyd County in owner-occupied houses/condos
- 334no vehicle
- 1,2221 vehicle
- 1,8252 vehicles
- 1,6693 vehicles
- 6264 vehicles
- 2525+ vehicles
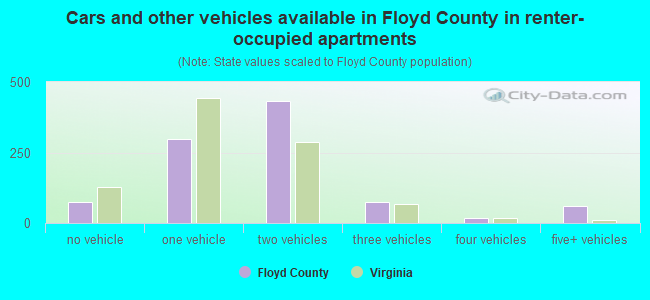
- Cars and other vehicles available in Floyd County in renter-occupied apartments
- 64no vehicle
- 3341 vehicle
- 3882 vehicles
- 553 vehicles
- 114 vehicles
- 715+ vehicles
91.6% of Floyd County residents lived in the same house 1 years ago.
Out of people who lived in different houses, 35% lived in this county.
Out of people who lived in different counties, 41% lived in Virginia.
| Floyd County: | 91.6% |
| State average: | 86.6% |
Place of birth for U.S.-born residents:
- This state: 11,267
- Other state: 3,745
- Northeast: 1,071
- Midwest: 413
- South: 1,851
- West: 408
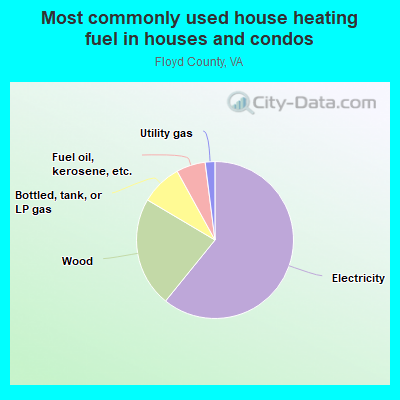
- 61.7%Electricity
- 21.0%Wood
- 9.7%Bottled, tank, or LP gas
- 6.5%Fuel oil, kerosene, etc.
- 1.0%Utility gas
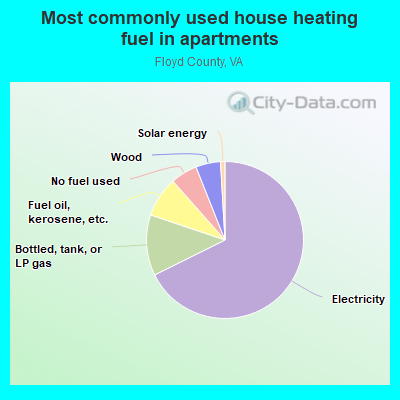
- 71.4%Electricity
- 9.2%Fuel oil, kerosene, etc.
- 7.1%Bottled, tank, or LP gas
- 6.8%No fuel used
- 4.5%Wood
- 1.0%Solar energy
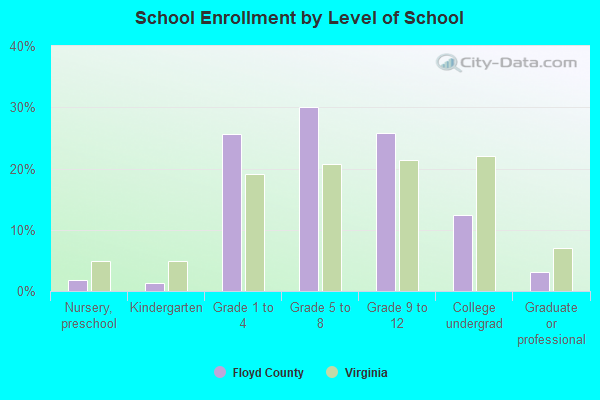
Private vs. public school enrollment:
| Here: | 10.6% |
| Virginia: | 13.2% |
| Here: | 12.5% |
| Virginia: | 10.2% |
| Here: | 30.8% |
| Virginia: | 18.7% |

Floyd County government finances - Expenditure in 2017:
- Assistance and Subsidies - Public Welfare, Federal Categorical Assistance Programs: $1,788,000
- Bond Funds - Cash and Securities: $10,336,000
- Charges - Other: $1,087,000
Elementary and Secondary Education School Lunch: $386,000
Elementary and Secondary Education School Lunch: $349,000
Solid Waste Management: $215,000
Solid Waste Management: $164,000
Parks and Recreation: $30,000
Elementary and Secondary Education School Tuition and Transportation: $13,000
Elementary and Secondary Education - Other: $11,000
Elementary and Secondary Education School Tuition and Transportation: $6,000
Elementary and Secondary Education - Other: $4,000
- Construction - General - Other: $3,619,000
General Public Buildings: $57,000
Elementary and Secondary Education: $55,000
Libraries: $24,000
- Current Operations - General - Other: $23,637,000
Elementary and Secondary Education: $22,632,000
Elementary and Secondary Education: $20,647,000
Police Protection: $1,877,000
Health - Other: $1,754,000
Solid Waste Management: $1,702,000
Police Protection: $1,689,000
Solid Waste Management: $1,410,000
Public Welfare - Other: $1,398,000
Financial Administration: $1,350,000
Public Welfare - Other: $1,100,000
Judicial and Legal Services: $1,006,000
Health - Other: $876,000
Judicial and Legal Services: $691,000
Housing and Community Development: $580,000
Correctional Institutions: $542,000
Financial Administration: $512,000
Central Staff Services: $356,000
Local Fire Protection: $324,000
General Public Buildings: $280,000
General Public Buildings: $276,000
Libraries: $255,000
Protective Inspection and Regulation - Other: $248,000
Libraries: $173,000
Local Fire Protection: $165,000
Protective Inspection and Regulation - Other: $142,000
Parks and Recreation: $123,000
Central Staff Services: $104,000
Natural Resources - Other: $94,000
Parks and Recreation: $65,000
Public Welfare, Vendor Payments for Medical Care: $34,000
Natural Resources - Other: $25,000
- Federal Intergovernmental - Other: $2,082,000
Public Welfare: $1,046,000
General Local Government Support: $160,000
Housing and Community Development: $30,000
General Local Government Support: $11,000
- General - Interest on Debt: $559,000
- Intergovernmental to Local - Other - Correctional Institutions: $527,000
Other - Health - Other: $132,000
Other - Elementary and Secondary Education: $119,000
Other - Libraries: $82,000
Other - Libraries: $76,000
Other - Parks and Recreation: $65,000
- Intergovernmental to State - Natural Resources - Other: $111,000
- Local Intergovernmental - Education: $129,000
Education: $113,000
- Long Term Debt - Outstanding Unspecified Public Purpose: $28,113,000
Beginning Outstanding - Unspecified Public Purpose: $21,194,000
Beginning Outstanding - Unspecified Public Purpose: $15,766,000
Outstanding Unspecified Public Purpose: $15,224,000
Issue, Unspecified Public Purpose: $10,652,000
Retired Unspecified Public Purpose: $5,520,000
Issue, Unspecified Public Purpose: $4,978,000
Retired Unspecified Public Purpose: $3,733,000
- Miscellaneous - General Revenue - Other: $410,000
Rents: $217,000
Fines and Forfeits: $183,000
Interest Earnings: $163,000
General Revenue - Other: $160,000
Rents: $43,000
Interest Earnings: $38,000
Fines and Forfeits: $6,000
Donations From Private Sources: $1,000
- Other Capital Outlay - Elementary and Secondary Education: $491,000
General Public Building: $323,000
Elementary and Secondary Education: $302,000
Police Protection: $100,000
Health - Other: $86,000
Solid Waste Management: $75,000
Libraries: $63,000
Local Fire Protection: $54,000
Financial Administration: $28,000
Central Staff Services: $15,000
Protective Inspection and Regulation - Other: $1,000
- Other Funds - Cash and Securities: $9,436,000
- Short Term Debt Outstanding - End of Fiscal Year: $986,000
Beginning: $972,000
- Sinking Funds - Cash and Securities: $8,406,000
- State Intergovernmental - Education: $14,896,000
Education: $13,696,000
Other: $12,992,000
General Local Government Support: $3,227,000
Public Welfare: $1,575,000
Public Welfare: $911,000
- Tax - Property: $13,385,000
Property: $10,671,000
General Sales and Gross Receipts: $1,108,000
General Sales and Gross Receipts: $895,000
Motor Vehicle License: $408,000
Motor Vehicle License: $403,000
Public Utilities Sales: $369,000
Public Utilities Sales: $329,000
Other Selective Sales: $321,000
Death and Gift: $127,000
Other License: $106,000
- Total Salaries and Wages: $19,079,000
: $12,925,000
- Water Utilities - Interest on Debt: $482,000
Floyd County government finances - Revenue in 2017:
- Assistance and Subsidies - Public Welfare, Federal Categorical Assistance Programs: $1,788,000
- Bond Funds - Cash and Securities: $10,336,000
- Charges - Other: $1,087,000
Elementary and Secondary Education School Lunch: $386,000
Elementary and Secondary Education School Lunch: $349,000
Solid Waste Management: $215,000
Solid Waste Management: $164,000
Parks and Recreation: $30,000
Elementary and Secondary Education School Tuition and Transportation: $13,000
Elementary and Secondary Education - Other: $11,000
Elementary and Secondary Education School Tuition and Transportation: $6,000
Elementary and Secondary Education - Other: $4,000
- Construction - General - Other: $3,619,000
General Public Buildings: $57,000
Elementary and Secondary Education: $55,000
Libraries: $24,000
- Current Operations - General - Other: $23,637,000
Elementary and Secondary Education: $22,632,000
Elementary and Secondary Education: $20,647,000
Police Protection: $1,877,000
Health - Other: $1,754,000
Solid Waste Management: $1,702,000
Police Protection: $1,689,000
Solid Waste Management: $1,410,000
Public Welfare - Other: $1,398,000
Financial Administration: $1,350,000
Public Welfare - Other: $1,100,000
Judicial and Legal Services: $1,006,000
Health - Other: $876,000
Judicial and Legal Services: $691,000
Housing and Community Development: $580,000
Correctional Institutions: $542,000
Financial Administration: $512,000
Central Staff Services: $356,000
Local Fire Protection: $324,000
General Public Buildings: $280,000
General Public Buildings: $276,000
Libraries: $255,000
Protective Inspection and Regulation - Other: $248,000
Libraries: $173,000
Local Fire Protection: $165,000
Protective Inspection and Regulation - Other: $142,000
Parks and Recreation: $123,000
Central Staff Services: $104,000
Natural Resources - Other: $94,000
Parks and Recreation: $65,000
Public Welfare, Vendor Payments for Medical Care: $34,000
Natural Resources - Other: $25,000
- Federal Intergovernmental - Other: $2,082,000
Public Welfare: $1,046,000
General Local Government Support: $160,000
Housing and Community Development: $30,000
General Local Government Support: $11,000
- General - Interest on Debt: $559,000
- Intergovernmental to Local - Other - Correctional Institutions: $527,000
Other - Health - Other: $132,000
Other - Elementary and Secondary Education: $119,000
Other - Libraries: $82,000
Other - Libraries: $76,000
Other - Parks and Recreation: $65,000
- Intergovernmental to State - Natural Resources - Other: $111,000
- Local Intergovernmental - Education: $129,000
Education: $113,000
- Long Term Debt - Outstanding Unspecified Public Purpose: $28,113,000
Beginning Outstanding - Unspecified Public Purpose: $21,194,000
Beginning Outstanding - Unspecified Public Purpose: $15,766,000
Outstanding Unspecified Public Purpose: $15,224,000
Issue, Unspecified Public Purpose: $10,652,000
Retired Unspecified Public Purpose: $5,520,000
Issue, Unspecified Public Purpose: $4,978,000
Retired Unspecified Public Purpose: $3,733,000
- Miscellaneous - General Revenue - Other: $410,000
Rents: $217,000
Fines and Forfeits: $183,000
Interest Earnings: $163,000
General Revenue - Other: $160,000
Rents: $43,000
Interest Earnings: $38,000
Fines and Forfeits: $6,000
Donations From Private Sources: $1,000
- Other Capital Outlay - Elementary and Secondary Education: $491,000
General Public Building: $323,000
Elementary and Secondary Education: $302,000
Police Protection: $100,000
Health - Other: $86,000
Solid Waste Management: $75,000
Libraries: $63,000
Local Fire Protection: $54,000
Financial Administration: $28,000
Central Staff Services: $15,000
Protective Inspection and Regulation - Other: $1,000
- Other Funds - Cash and Securities: $9,436,000
- Short Term Debt Outstanding - End of Fiscal Year: $986,000
Beginning: $972,000
- Sinking Funds - Cash and Securities: $8,406,000
- State Intergovernmental - Education: $14,896,000
Education: $13,696,000
Other: $12,992,000
General Local Government Support: $3,227,000
Public Welfare: $1,575,000
Public Welfare: $911,000
- Tax - Property: $13,385,000
Property: $10,671,000
General Sales and Gross Receipts: $1,108,000
General Sales and Gross Receipts: $895,000
Motor Vehicle License: $408,000
Motor Vehicle License: $403,000
Public Utilities Sales: $369,000
Public Utilities Sales: $329,000
Other Selective Sales: $321,000
Death and Gift: $127,000
Other License: $106,000
- Total Salaries and Wages: $19,079,000
: $12,925,000
- Water Utilities - Interest on Debt: $482,000
Floyd County government finances - Debt in 2017:
- Assistance and Subsidies - Public Welfare, Federal Categorical Assistance Programs: $1,788,000
- Bond Funds - Cash and Securities: $10,336,000
- Charges - Other: $1,087,000
Elementary and Secondary Education School Lunch: $386,000
Elementary and Secondary Education School Lunch: $349,000
Solid Waste Management: $215,000
Solid Waste Management: $164,000
Parks and Recreation: $30,000
Elementary and Secondary Education School Tuition and Transportation: $13,000
Elementary and Secondary Education - Other: $11,000
Elementary and Secondary Education School Tuition and Transportation: $6,000
Elementary and Secondary Education - Other: $4,000
- Construction - General - Other: $3,619,000
General Public Buildings: $57,000
Elementary and Secondary Education: $55,000
Libraries: $24,000
- Current Operations - General - Other: $23,637,000
Elementary and Secondary Education: $22,632,000
Elementary and Secondary Education: $20,647,000
Police Protection: $1,877,000
Health - Other: $1,754,000
Solid Waste Management: $1,702,000
Police Protection: $1,689,000
Solid Waste Management: $1,410,000
Public Welfare - Other: $1,398,000
Financial Administration: $1,350,000
Public Welfare - Other: $1,100,000
Judicial and Legal Services: $1,006,000
Health - Other: $876,000
Judicial and Legal Services: $691,000
Housing and Community Development: $580,000
Correctional Institutions: $542,000
Financial Administration: $512,000
Central Staff Services: $356,000
Local Fire Protection: $324,000
General Public Buildings: $280,000
General Public Buildings: $276,000
Libraries: $255,000
Protective Inspection and Regulation - Other: $248,000
Libraries: $173,000
Local Fire Protection: $165,000
Protective Inspection and Regulation - Other: $142,000
Parks and Recreation: $123,000
Central Staff Services: $104,000
Natural Resources - Other: $94,000
Parks and Recreation: $65,000
Public Welfare, Vendor Payments for Medical Care: $34,000
Natural Resources - Other: $25,000
- Federal Intergovernmental - Other: $2,082,000
Public Welfare: $1,046,000
General Local Government Support: $160,000
Housing and Community Development: $30,000
General Local Government Support: $11,000
- General - Interest on Debt: $559,000
- Intergovernmental to Local - Other - Correctional Institutions: $527,000
Other - Health - Other: $132,000
Other - Elementary and Secondary Education: $119,000
Other - Libraries: $82,000
Other - Libraries: $76,000
Other - Parks and Recreation: $65,000
- Intergovernmental to State - Natural Resources - Other: $111,000
- Local Intergovernmental - Education: $129,000
Education: $113,000
- Long Term Debt - Outstanding Unspecified Public Purpose: $28,113,000
Beginning Outstanding - Unspecified Public Purpose: $21,194,000
Beginning Outstanding - Unspecified Public Purpose: $15,766,000
Outstanding Unspecified Public Purpose: $15,224,000
Issue, Unspecified Public Purpose: $10,652,000
Retired Unspecified Public Purpose: $5,520,000
Issue, Unspecified Public Purpose: $4,978,000
Retired Unspecified Public Purpose: $3,733,000
- Miscellaneous - General Revenue - Other: $410,000
Rents: $217,000
Fines and Forfeits: $183,000
Interest Earnings: $163,000
General Revenue - Other: $160,000
Rents: $43,000
Interest Earnings: $38,000
Fines and Forfeits: $6,000
Donations From Private Sources: $1,000
- Other Capital Outlay - Elementary and Secondary Education: $491,000
General Public Building: $323,000
Elementary and Secondary Education: $302,000
Police Protection: $100,000
Health - Other: $86,000
Solid Waste Management: $75,000
Libraries: $63,000
Local Fire Protection: $54,000
Financial Administration: $28,000
Central Staff Services: $15,000
Protective Inspection and Regulation - Other: $1,000
- Other Funds - Cash and Securities: $9,436,000
- Short Term Debt Outstanding - End of Fiscal Year: $986,000
Beginning: $972,000
- Sinking Funds - Cash and Securities: $8,406,000
- State Intergovernmental - Education: $14,896,000
Education: $13,696,000
Other: $12,992,000
General Local Government Support: $3,227,000
Public Welfare: $1,575,000
Public Welfare: $911,000
- Tax - Property: $13,385,000
Property: $10,671,000
General Sales and Gross Receipts: $1,108,000
General Sales and Gross Receipts: $895,000
Motor Vehicle License: $408,000
Motor Vehicle License: $403,000
Public Utilities Sales: $369,000
Public Utilities Sales: $329,000
Other Selective Sales: $321,000
Death and Gift: $127,000
Other License: $106,000
- Total Salaries and Wages: $19,079,000
: $12,925,000
- Water Utilities - Interest on Debt: $482,000
Floyd County government finances - Cash and Securities in 2017:
- Assistance and Subsidies - Public Welfare, Federal Categorical Assistance Programs: $1,788,000
- Bond Funds - Cash and Securities: $10,336,000
- Charges - Other: $1,087,000
Elementary and Secondary Education School Lunch: $386,000
Elementary and Secondary Education School Lunch: $349,000
Solid Waste Management: $215,000
Solid Waste Management: $164,000
Parks and Recreation: $30,000
Elementary and Secondary Education School Tuition and Transportation: $13,000
Elementary and Secondary Education - Other: $11,000
Elementary and Secondary Education School Tuition and Transportation: $6,000
Elementary and Secondary Education - Other: $4,000
- Construction - General - Other: $3,619,000
General Public Buildings: $57,000
Elementary and Secondary Education: $55,000
Libraries: $24,000
- Current Operations - General - Other: $23,637,000
Elementary and Secondary Education: $22,632,000
Elementary and Secondary Education: $20,647,000
Police Protection: $1,877,000
Health - Other: $1,754,000
Solid Waste Management: $1,702,000
Police Protection: $1,689,000
Solid Waste Management: $1,410,000
Public Welfare - Other: $1,398,000
Financial Administration: $1,350,000
Public Welfare - Other: $1,100,000
Judicial and Legal Services: $1,006,000
Health - Other: $876,000
Judicial and Legal Services: $691,000
Housing and Community Development: $580,000
Correctional Institutions: $542,000
Financial Administration: $512,000
Central Staff Services: $356,000
Local Fire Protection: $324,000
General Public Buildings: $280,000
General Public Buildings: $276,000
Libraries: $255,000
Protective Inspection and Regulation - Other: $248,000
Libraries: $173,000
Local Fire Protection: $165,000
Protective Inspection and Regulation - Other: $142,000
Parks and Recreation: $123,000
Central Staff Services: $104,000
Natural Resources - Other: $94,000
Parks and Recreation: $65,000
Public Welfare, Vendor Payments for Medical Care: $34,000
Natural Resources - Other: $25,000
- Federal Intergovernmental - Other: $2,082,000
Public Welfare: $1,046,000
General Local Government Support: $160,000
Housing and Community Development: $30,000
General Local Government Support: $11,000
- General - Interest on Debt: $559,000
- Intergovernmental to Local - Other - Correctional Institutions: $527,000
Other - Health - Other: $132,000
Other - Elementary and Secondary Education: $119,000
Other - Libraries: $82,000
Other - Libraries: $76,000
Other - Parks and Recreation: $65,000
- Intergovernmental to State - Natural Resources - Other: $111,000
- Local Intergovernmental - Education: $129,000
Education: $113,000
- Long Term Debt - Outstanding Unspecified Public Purpose: $28,113,000
Beginning Outstanding - Unspecified Public Purpose: $21,194,000
Beginning Outstanding - Unspecified Public Purpose: $15,766,000
Outstanding Unspecified Public Purpose: $15,224,000
Issue, Unspecified Public Purpose: $10,652,000
Retired Unspecified Public Purpose: $5,520,000
Issue, Unspecified Public Purpose: $4,978,000
Retired Unspecified Public Purpose: $3,733,000
- Miscellaneous - General Revenue - Other: $410,000
Rents: $217,000
Fines and Forfeits: $183,000
Interest Earnings: $163,000
General Revenue - Other: $160,000
Rents: $43,000
Interest Earnings: $38,000
Fines and Forfeits: $6,000
Donations From Private Sources: $1,000
- Other Capital Outlay - Elementary and Secondary Education: $491,000
General Public Building: $323,000
Elementary and Secondary Education: $302,000
Police Protection: $100,000
Health - Other: $86,000
Solid Waste Management: $75,000
Libraries: $63,000
Local Fire Protection: $54,000
Financial Administration: $28,000
Central Staff Services: $15,000
Protective Inspection and Regulation - Other: $1,000
- Other Funds - Cash and Securities: $9,436,000
- Short Term Debt Outstanding - End of Fiscal Year: $986,000
Beginning: $972,000
- Sinking Funds - Cash and Securities: $8,406,000
- State Intergovernmental - Education: $14,896,000
Education: $13,696,000
Other: $12,992,000
General Local Government Support: $3,227,000
Public Welfare: $1,575,000
Public Welfare: $911,000
- Tax - Property: $13,385,000
Property: $10,671,000
General Sales and Gross Receipts: $1,108,000
General Sales and Gross Receipts: $895,000
Motor Vehicle License: $408,000
Motor Vehicle License: $403,000
Public Utilities Sales: $369,000
Public Utilities Sales: $329,000
Other Selective Sales: $321,000
Death and Gift: $127,000
Other License: $106,000
- Total Salaries and Wages: $19,079,000
: $12,925,000
- Water Utilities - Interest on Debt: $482,000
Supplemental Security Income (SSI) in 2006:
- Total number of recipients: 279
- Number of aged recipients: 39
- Number of blind and disabled recipients: 240
- Number of recipients under 18: 27
- Number of recipients between 18 and 64: 189
- Number of recipients older than 64: 63
- Number of recipients also receiving OASDI: 135
- Amount of payments (thousands of dollars): 113
| Most common first names in Floyd County, VA among deceased individuals | ||
| Name | Count | Lived (average) |
|---|---|---|
| James | 47 | 70.3 years |
| William | 40 | 76.2 years |
| John | 31 | 79.1 years |
| Mary | 30 | 79.0 years |
| George | 30 | 76.3 years |
| Robert | 24 | 74.8 years |
| Charles | 18 | 71.7 years |
| Henry | 17 | 71.9 years |
| Annie | 16 | 85.2 years |
| Joseph | 13 | 72.9 years |
| Most common last names in Floyd County, VA among deceased individuals | ||
| Last name | Count | Lived (average) |
|---|---|---|
| Akers | 39 | 76.6 years |
| Reed | 37 | 82.1 years |
| Thomas | 32 | 84.5 years |
| Hylton | 32 | 79.8 years |
| Harman | 31 | 84.1 years |
| Weeks | 28 | 77.1 years |
| Radford | 26 | 75.2 years |
| Weddle | 25 | 75.7 years |
| Smith | 25 | 82.0 years |
| Williams | 24 | 80.7 years |
| Businesses in Floyd County, VA | ||||
| Name | Count | Name | Count | |
|---|---|---|---|---|
| FedEx | 1 | Subway | 1 | |
| H&R Block | 1 | U-Haul | 1 | |
| Hardee's | 1 | UPS | 1 | |
Floyd County on our top lists:
- #94 on the list of "Top 101 counties with the lowest total withdrawal of fresh water for public supply"