Baytown: Fire Incidents, Texas (TX)
Where are fire incidents reported in Baytown, TX
Something went wrong! Please refresh the page.
| Fire incidents reported | |
|---|---|
| Sreet name | Count |
| GARTH RD | 544 |
| DECKER DR | 290 |
| BAKER RD | 250 |
| MAIN ST | 224 |
| ALEXANDER DR | 204 |
| IH 10 HY | 196 |
| INTERSTATE 10 | 170 |
| HIGHWAY 146 | 168 |
| NORTHWOOD DR | 138 |
| WARD RD | 126 |
| MASSEY TOMPKINS RD | 112 |
| ROLLINGBROOK DR | 112 |
| BAYWAY DR | 110 |
| SH 146 HY | 102 |
| TRI CITY BEACH RD | 72 |
| JAMES AVE | 68 |
| TEXAS AVE | 62 |
| WADE RD | 62 |
| MCKINNEY RD | 60 |
| JAMES BOWIE DR | 58 |
| CROSBY CEDAR BAYOU | 56 |
| CROSBY CEDAR BAYOU RD | 52 |
| MASSEY TOMPKINS | 52 |
| QUAIL HOLLOW DR | 50 |
| BOB SMITH RD | 48 |
| CEDAR BAYOU RD | 46 |
| VILLAGE LN | 46 |
| NOLAN RD | 42 |
| N SH 146 HY | 40 |
| BEAUMONT RD | 38 |
| Other | 1,200 |
2002 - 2018 National Fire Incident Reporting System (NFIRS) incidents
- Incident types reported to NFIRS in Baytown, TX
- 35,92566.8%Rescue & EMS
- 4,7988.9%Fire
- 4,5418.4%Hazardous Condition
- 3,0165.6%Service Call
- 3,0085.6%False Alarm
- 2,2424.2%Good Intent Call
- 1140.2%Overpressure Rupture
- 950.2%Special Incident
- Fire incident types reported to NFIRS in Baytown, TX
- 2,23246.5%Outside Fires
- 1,53231.9%Structure Fires
- 99320.7%Mobile Property/Vehicle Fires
- 410.9%Other
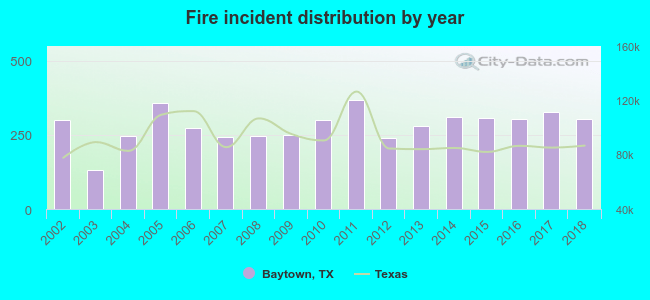 Based on the data from the years 2002 - 2018 the average number of fire incidents per year is 282. The highest number of fires - 367 took place in 2011, and the least - 132 in 2003. The data has an increasing trend.
The average number of yearly fire incidents per 10k residents in Baytown, TX compared to nearest cities:
(Note: Based on data for the last 3 years, including only cities with population 5,000 and above)
| Baytown: | 41.1 |
| La Porte: | 26.5 |
| Highlands: | 192.3 |
| Deer Park: | 13.1 |
| Channelview: | 55.4 |
| Seabrook: | 13.6 |
| Cloverleaf: | 0.6 |
| Pasadena: | 10.7 |
| Galena Park: | 17.9 |
 The median response time based on all reported fire incidents is 5 minutes. This is lower than the Texas median value.
The median response time in Baytown, TX compared to nearest cities:
(Note: Based on data for all years, including only cities with at least 500 fire incidents)
| Baytown: | 5 minutes |
| La Porte: | 3 minutes |
| Highlands: | 7 minutes |
| Deer Park: | 5 minutes |
| Channelview: | 7 minutes |
| Seabrook: | 8 minutes |
| Crosby: | 11 minutes |
| Pasadena: | 7 minutes |
| Webster: | 5 minutes |
 According to the data from the years 2002 - 2018 the average number of fire-related fatalities per year is 1. The highest number of deaths - 2 took place in 2010, and the lowest - 0 in 2002. The data has a growing trend.
The average number of fatalities per 1,000 fires is 2. This indicator was the highest - 7 in 2013, and the lowest 0 in 2002. The trend for deaths per 1,000 fires is growing. Compared to the state value the number of fatalities per 1,000 fire incidents is higher.
According to the data from the years 2002 - 2018 the average number of fire-related fatalities per year is 1. The highest number of deaths - 2 took place in 2010, and the lowest - 0 in 2002. The data has a growing trend.
The average number of fatalities per 1,000 fires is 2. This indicator was the highest - 7 in 2013, and the lowest 0 in 2002. The trend for deaths per 1,000 fires is growing. Compared to the state value the number of fatalities per 1,000 fire incidents is higher.Deaths per 1,000 incidents in Baytown, TX compared to nearest cities:
(Note: Based on data for all years, including only cities with at least 2,500 fire incidents)
| Baytown: | 2.5 |
| Channelview: | 3.8 |
| Crosby: | 2.0 |
| Pasadena: | 1.3 |
| Pearland: | 1.2 |
| Texas City: | 3.8 |
| Humble: | 2.0 |
| Houston: | 1.6 |
| Alvin: | 0.0 |
 Based on the reports from the years 2002 - 2018 the average number of fire-related casualties per year is 6. The highest number of injuries - 12 took place in 2014, and the lowest - 1 in 2008. The data has a decreasing trend.
The average number of injuries per 1,000 fires is 20. This indicator was the highest - 45 in 2003, and the lowest 4 in 2008. The trend for casualties per 1,000 fire incidents is decreasing. Compared to the Texas value the number of injuries per 1,000 fire incidents is much higher.
Based on the reports from the years 2002 - 2018 the average number of fire-related casualties per year is 6. The highest number of injuries - 12 took place in 2014, and the lowest - 1 in 2008. The data has a decreasing trend.
The average number of injuries per 1,000 fires is 20. This indicator was the highest - 45 in 2003, and the lowest 4 in 2008. The trend for casualties per 1,000 fire incidents is decreasing. Compared to the Texas value the number of injuries per 1,000 fire incidents is much higher.
 31.6% incidents where reported in the morning and 68.4% in the evening. The most fires (15.8%) took place on Sunday, and the least (13.0%) on Wednesday.
 According to the 4,798 reports from years 2002 - 2018 most fires (9.3%) took place during June, and the least (7.3%) in September.
 Out of all 53,752 cases reported during the years 2002 - 2018, the most belonged to the categories: Rescue & EMS (66.8%), Fire (8.9%), and Hazardous Condition (8.4%).
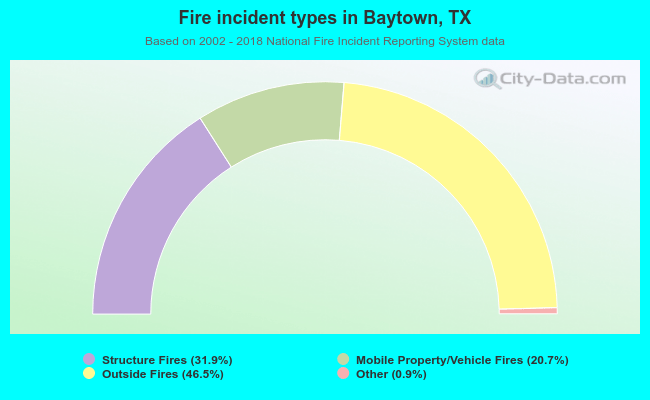 When looking into fire subcategories, the most reports belonged to: Outside Fires (46.5%), and Structure Fires (31.9%).