Corsicana: Fire Incidents, Texas (TX)
Where are fire incidents reported in Corsicana, TX
Something went wrong! Please refresh the page.
| Fire incidents reported | |
|---|---|
| Sreet name | Count |
| HWY 31 | 312 |
| 7TH AVE | 304 |
| 13TH AVE | 170 |
| 2ND AVE | 122 |
| 6TH AVE | 110 |
| BUS LOOP 45 | 106 |
| PARK ROW | 106 |
| HWY 287 | 102 |
| BEATON ST | 100 |
| I45 | 98 |
| 10TH AVE | 94 |
| 15TH ST | 94 |
| COLLIN AVE | 92 |
| 5TH AVE | 90 |
| 8TH AVE | 90 |
| I-45 | 74 |
| HWY 22 | 70 |
| 45TH ST | 68 |
| 4TH AVE | 66 |
| 1ST AVE | 64 |
| MLK BLVD | 62 |
| 11TH AVE | 58 |
| 12TH AVE | 50 |
| 42ND ST | 50 |
| 13TH ST | 48 |
| 7TH ST | 48 |
| 9TH AVE | 48 |
| PARK AVE | 48 |
| 37TH ST | 46 |
| 3RD AVE | 46 |
| Other | 470 |
2002 - 2018 National Fire Incident Reporting System (NFIRS) incidents
- Incident types reported to NFIRS in Corsicana, TX
- 7,38541.9%Rescue & EMS
- 3,30618.8%Fire
- 2,18212.4%Hazardous Condition
- 1,93511.0%Service Call
- 1,6619.4%Good Intent Call
- 1,1156.3%False Alarm
- 220.1%Overpressure Rupture
- Fire incident types reported to NFIRS in Corsicana, TX
- 1,60448.5%Outside Fires
- 1,05331.9%Structure Fires
- 52415.8%Mobile Property/Vehicle Fires
- 1253.8%Other
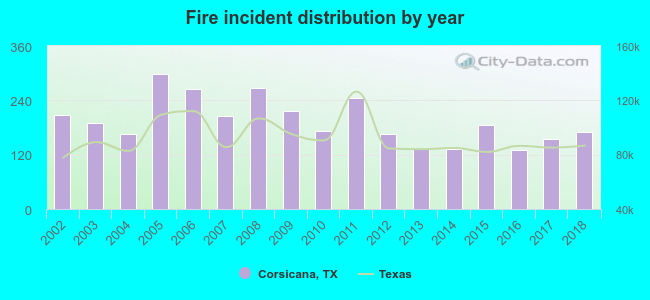 Based on the data from the years 2002 - 2018 the average number of fire incidents per year is 194. The highest number of reported fires - 299 took place in 2005, and the least - 130 in 2016. The data has a decreasing trend.
The average number of yearly fire incidents per 10k residents in Corsicana, TX compared to nearest cities:
(Note: Based on data for the last 3 years, including only cities with population 5,000 and above)
| Corsicana: | 63.1 |
| Ennis: | 63.0 |
| Gun Barrel City: | 119.2 |
| Mexia: | 23.1 |
| Waxahachie: | 49.2 |
| Kaufman: | 162.8 |
| Red Oak: | 70.4 |
| Athens: | 166.9 |
| Glenn Heights: | 40.3 |
 The median response time based on all reported fire incidents is 5 minutes. This is lower than the Texas median value.
The median response time in Corsicana, TX compared to nearest cities:
(Note: Based on data for all years, including only cities with at least 500 fire incidents)
| Corsicana: | 5 minutes |
| Kerens: | 13 minutes |
| Streetman: | 15 minutes |
| Ennis: | 5 minutes |
| Frost: | 10 minutes |
| Tool: | 9 minutes |
| Seven Points: | 10 minutes |
| Trinidad: | 5 minutes |
| Gun Barrel City: | 6 minutes |
 Based on the data from the years 2002 - 2018 the average number of fire-related fatalities per year is 1. The highest number of deaths - 2 took place in 2008, and the lowest - 0 in 2002. The data has a constant trend.
The average number of deaths per 1,000 fire incidents is 3. This indicator was the highest - 15 in 2013, and the lowest 0 in 2002. The trend for deaths per 1,000 fire incidents is constant. Compared to the Texas value the number of deaths per 1,000 fire incidents is higher.
Based on the data from the years 2002 - 2018 the average number of fire-related fatalities per year is 1. The highest number of deaths - 2 took place in 2008, and the lowest - 0 in 2002. The data has a constant trend.
The average number of deaths per 1,000 fire incidents is 3. This indicator was the highest - 15 in 2013, and the lowest 0 in 2002. The trend for deaths per 1,000 fire incidents is constant. Compared to the Texas value the number of deaths per 1,000 fire incidents is higher.Deaths per 1,000 incidents in Corsicana, TX compared to nearest cities:
(Note: Based on data for all years, including only cities with at least 2,500 fire incidents)
| Corsicana: | 3.0 |
| Ennis: | 1.1 |
| Waxahachie: | 1.3 |
| Athens: | 0.9 |
| Lancaster: | 1.9 |
 Based on the data from the years 2002 - 2018 the average number of fire-related casualties per year is 3. The highest number of injuries - 9 took place in 2011, and the lowest - 0 in 2016. The data has a decreasing trend.
The average number of injuries per 1,000 fires is 15. This indicator was the highest - 37 in 2011, and the lowest 0 in 2016. The trend for injuries per 1,000 fires is dropping. Compared to the Texas value the number of injuries per 1,000 incidents is much higher.
Based on the data from the years 2002 - 2018 the average number of fire-related casualties per year is 3. The highest number of injuries - 9 took place in 2011, and the lowest - 0 in 2016. The data has a decreasing trend.
The average number of injuries per 1,000 fires is 15. This indicator was the highest - 37 in 2011, and the lowest 0 in 2016. The trend for injuries per 1,000 fires is dropping. Compared to the Texas value the number of injuries per 1,000 incidents is much higher.Casualties per 1,000 incidents in Corsicana, TX compared to nearest cities:
(Note: Based on data for all years, including only cities with at least 500 fire incidents)
| Corsicana: | 15.7 |
| Kerens: | 2.9 |
| Streetman: | 0.0 |
| Ennis: | 7.5 |
| Frost: | 0.0 |
| Tool: | 0.0 |
| Seven Points: | 0.0 |
| Trinidad: | 0.0 |
| Gun Barrel City: | 2.9 |
 30.9% incidents where reported in the morning and 69.1% in the evening. The most fires (16.2%) took place on Saturday, and the least (13.0%) on Thursday.
 Based on the 3,306 fires from years 2002 - 2018 most fires (10.6%) took place during September, and the least (5.9%) in May.
 Out of all 17,619 cases reported during the years 2002 - 2018, the most belonged to the categories: Rescue & EMS (41.9%), Fire (18.8%), and Hazardous Condition (12.4%).
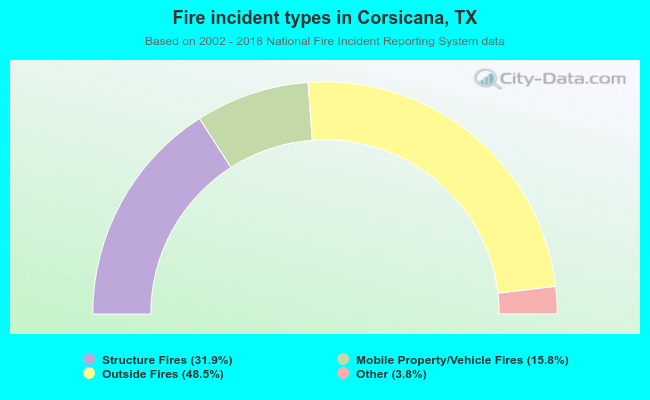 When looking into fire subcategories, the most incidents belonged to: Outside Fires (48.5%), and Structure Fires (31.9%).