Essex: Fire Incidents, Maryland (MD)
Where are fire incidents reported in Essex, MD
Something went wrong! Please refresh the page.
| Fire incidents reported | |
|---|---|
| Sreet name | Count |
| EASTERN BLVD | 328 |
| STEMMERS RUN RD | 100 |
| BACK RIVER NECK RD | 94 |
| MIDDLEBOROUGH RD | 78 |
| RT 702 | 76 |
| MARLYN AV | 70 |
| FOXWOOD LN | 66 |
| MARLYN AVE | 60 |
| OLD EASTERN AV | 54 |
| HOMBERG AV | 48 |
| RIVERSIDE RD | 44 |
| WOODWARD DR | 42 |
| BRUNSWICK RD | 40 |
| COUNTRY RIDGE LN | 40 |
| HOMBERG AVE | 40 |
| SOUTHEAST BLVD | 40 |
| BENNETT RD | 38 |
| MANSFIELD RD | 38 |
| RIVERSIDE DR | 38 |
| TACE DR | 38 |
| HADWICK DR | 34 |
| TURKEY POINT RD | 34 |
| HOLLY NECK RD | 32 |
| GLENWOOD RD | 28 |
| MARLYN | 28 |
| MIDDLESEX RD | 28 |
| PUNJAB DR | 28 |
| HOLGATE DR | 24 |
| OLD EASTERN AVE | 24 |
| ORVILLE RD | 24 |
| Other | 169 |
2004 - 2018 National Fire Incident Reporting System (NFIRS) incidents
- Incident types reported to NFIRS in Essex, MD
- 26,52576.2%Rescue & EMS
- 3,0258.7%Hazardous Condition
- 1,8255.2%Fire
- 1,1893.4%Service Call
- 1,1603.3%Good Intent Call
- 1,0423.0%False Alarm
- 390.1%Overpressure Rupture
- Fire incident types reported to NFIRS in Essex, MD
- 1,08959.7%Outside Fires
- 34719.0%Structure Fires
- 29616.2%Mobile Property/Vehicle Fires
- 935.1%Other
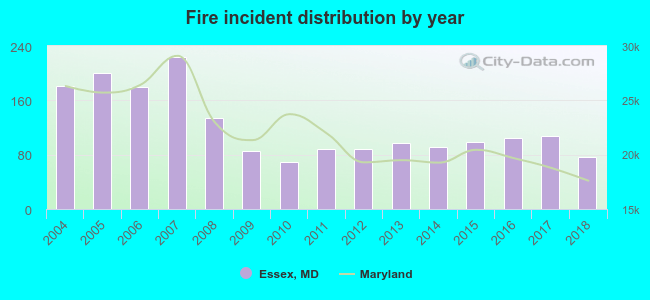 Based on the data from the years 2004 - 2018 the average number of fires per year is 122. The highest number of reported fires - 224 took place in 2007, and the least - 69 in 2010. The data has a declining trend.
The average number of yearly fire incidents per 10k residents in Essex, MD compared to nearest cities:
(Note: Based on data for the last 3 years, including only cities with population 5,000 and above)
| Essex: | 24.5 |
| Middle River: | 43.3 |
| Rosedale: | 19.7 |
| Dundalk: | 13.6 |
| White Marsh: | 31.9 |
| Edgemere: | 34.6 |
| Perry Hall: | 2.6 |
| Parkville: | 23.6 |
| Baltimore: | 47.1 |
 The median response time based on all reported fire incidents is 5 minutes. This is lower compared to the Maryland median value.
The median response time in Essex, MD compared to nearest cities:
(Note: Based on data for all years, including only cities with at least 500 fire incidents)
| Essex: | 5 minutes |
| Middle River: | 5 minutes |
| Dundalk: | 5 minutes |
| Edgemere: | 5 minutes |
| Parkville: | 5 minutes |
| Baltimore: | 6 minutes |
| Towson: | 5 minutes |
| Edgewood: | 6 minutes |
| Glen Burnie: | 6 minutes |
 According to the data from the years 2004 - 2018 the average number of fire-related casualties per year is 1. The highest number of casualties - 3 took place in 2013, and the lowest - 0 in 2006. The data has a declining trend.
The average number of injuries per 1,000 fires is 5. This indicator was the highest - 31 in 2013, and the lowest 0 in 2006. The trend for injuries per 1,000 incidents is declining. Compared to the state value the number of injuries per 1,000 fires is lower.
According to the data from the years 2004 - 2018 the average number of fire-related casualties per year is 1. The highest number of casualties - 3 took place in 2013, and the lowest - 0 in 2006. The data has a declining trend.
The average number of injuries per 1,000 fires is 5. This indicator was the highest - 31 in 2013, and the lowest 0 in 2006. The trend for injuries per 1,000 incidents is declining. Compared to the state value the number of injuries per 1,000 fires is lower.Casualties per 1,000 incidents in Essex, MD compared to nearest cities:
(Note: Based on data for all years, including only cities with at least 500 fire incidents)
| Essex: | 4.9 |
| Middle River: | 2.7 |
| Dundalk: | 6.0 |
| Edgemere: | 6.1 |
| Parkville: | 6.2 |
| Baltimore: | 11.4 |
| Towson: | 2.9 |
| Edgewood: | 5.8 |
| Glen Burnie: | 14.1 |
 28.2% incidents where reported in the morning and 71.8% in the evening. The most fires (17.7%) took place on Saturday, and the least (13.2%) on Friday.
 According to the 1,825 fire incident reports from years 2004 - 2018 most fires (11.7%) took place during April, and the least (5.8%) in February.
 Out of all 34,821 cases reported during the years 2004 - 2018, the most belonged to the categories: Rescue & EMS (76.2%), Hazardous Condition (8.7%), and Fire (5.2%).
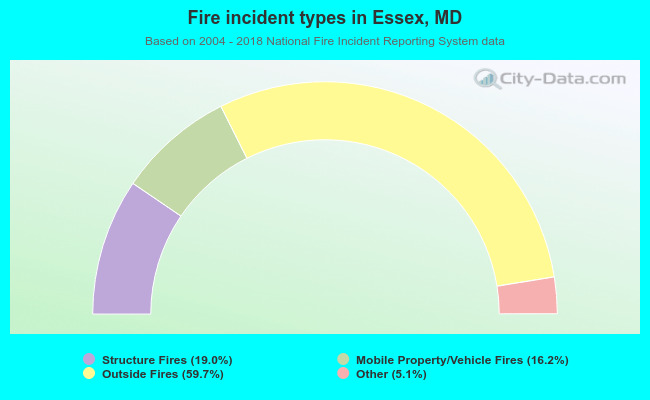 When looking into fire subcategories, the most reports belonged to: Outside Fires (59.7%), and Structure Fires (19.0%).