Parkville: Fire Incidents, Maryland (MD)
Where are fire incidents reported in Parkville, MD
Something went wrong! Please refresh the page.
| Fire incidents reported | |
|---|---|
| Sreet name | Count |
| HARFORD RD | 204 |
| JOPPA RD | 154 |
| PUTTY HILL AV | 80 |
| WALTHAM WOODS RD | 74 |
| OLD HARFORD RD | 62 |
| GLEN RD | 60 |
| PERRING PY | 42 |
| TAYLOR AV | 42 |
| LOCH RAVEN BLVD | 38 |
| OAKLEIGH RD | 36 |
| SOLAR CIR | 30 |
| HALSTEAD RD | 28 |
| PUTTY HILL AVE | 24 |
| COLLINSDALE RD | 22 |
| HILLENDALE RD | 22 |
| KINGS RIDGE RD | 22 |
| SATYR HILL RD | 22 |
| SPINDRIFT CIR | 22 |
| ARBOR STATION WAY | 20 |
| MC CLEAN BLVD | 20 |
| PERRING PKWY | 20 |
| HARFORD RD*PERRING | 18 |
| CLEANLEIGH DR | 16 |
| GREENWAY RD | 16 |
| LEEFIELD RD | 16 |
| TAYLOR | 16 |
| TAYLOR AVE | 16 |
| AVONDALE RD | 14 |
| COLD STREAM WAY | 14 |
| CUB HILL RD | 14 |
| Other | 266 |
2004 - 2018 National Fire Incident Reporting System (NFIRS) incidents
- Incident types reported to NFIRS in Parkville, MD
- 25,23373.5%Rescue & EMS
- 3,78311.0%Hazardous Condition
- 1,4504.2%Fire
- 1,4394.2%Service Call
- 1,2423.6%Good Intent Call
- 1,1383.3%False Alarm
- 580.2%Overpressure Rupture
- Fire incident types reported to NFIRS in Parkville, MD
- 72249.8%Outside Fires
- 37926.1%Structure Fires
- 28919.9%Mobile Property/Vehicle Fires
- 604.1%Other
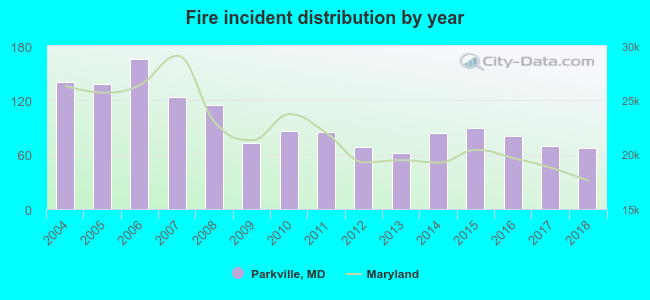 Based on the data from the years 2004 - 2018 the average number of fires per year is 97. The highest number of fire incidents - 166 took place in 2006, and the least - 62 in 2013. The data has a declining trend.
The average number of yearly fire incidents per 10k residents in Parkville, MD compared to nearest cities:
(Note: Based on data for the last 3 years, including only cities with population 5,000 and above)
| Parkville: | 23.6 |
| Towson: | 13.6 |
| Perry Hall: | 2.6 |
| Rosedale: | 19.7 |
| White Marsh: | 31.9 |
| Baltimore: | 47.1 |
| Middle River: | 43.3 |
| Essex: | 24.5 |
| Cockeysville: | 26.3 |
 The median response time based on all reported fire incidents is 5 minutes. This is lower than the state median value.
The median response time in Parkville, MD compared to nearest cities:
(Note: Based on data for all years, including only cities with at least 500 fire incidents)
| Parkville: | 5 minutes |
| Towson: | 5 minutes |
| Baltimore: | 6 minutes |
| Middle River: | 5 minutes |
| Essex: | 5 minutes |
| Cockeysville: | 5 minutes |
| Pikesville: | 5 minutes |
| Dundalk: | 5 minutes |
| Fallston: | 8 minutes |
 Based on the data from the years 2004 - 2018 the average number of fire-related yearly casualties is 1. The highest number of reported injuries - 4 took place in 2004, and the lowest - 0 in 2006. The data has a dropping trend.
The average number of injuries per 1,000 fire incidents is 6. This indicator was the highest - 29 in 2004, and the lowest 0 in 2006. The trend for injuries per 1,000 fires is decreasing. Compared to the Maryland value the number of injuries per 1,000 fires is lower.
Based on the data from the years 2004 - 2018 the average number of fire-related yearly casualties is 1. The highest number of reported injuries - 4 took place in 2004, and the lowest - 0 in 2006. The data has a dropping trend.
The average number of injuries per 1,000 fire incidents is 6. This indicator was the highest - 29 in 2004, and the lowest 0 in 2006. The trend for injuries per 1,000 fires is decreasing. Compared to the Maryland value the number of injuries per 1,000 fires is lower.Casualties per 1,000 incidents in Parkville, MD compared to nearest cities:
(Note: Based on data for all years, including only cities with at least 500 fire incidents)
| Parkville: | 6.2 |
| Towson: | 2.9 |
| Baltimore: | 11.4 |
| Middle River: | 2.7 |
| Essex: | 4.9 |
| Cockeysville: | 4.4 |
| Pikesville: | 4.2 |
| Dundalk: | 6.0 |
| Fallston: | 1.1 |
 30.1% incidents where reported in the morning and 69.9% in the evening. The most fires (16.6%) took place on Saturday, and the least (12.4%) on Wednesday.
 According to the 1,450 reports from years 2004 - 2018 most fires (10.2%) took place during July, and the least (5.2%) in January.
 Out of all 34,350 cases reported during the years 2004 - 2018, the most belonged to the categories: Rescue & EMS (73.5%), Hazardous Condition (11.0%), and Fire (4.2%).
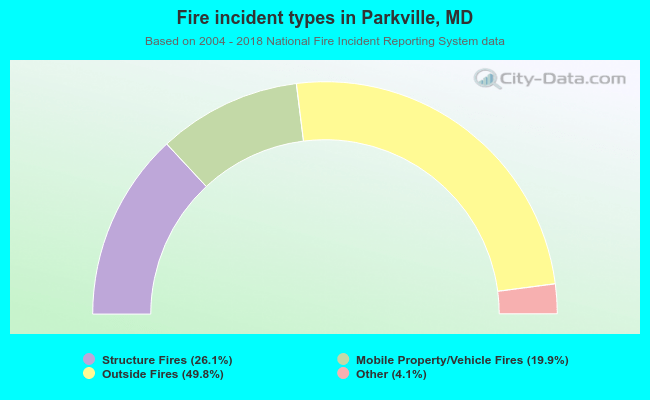 When looking into fire subcategories, the most incidents belonged to: Outside Fires (49.8%), and Structure Fires (26.1%).