Hockessin: Fire Incidents, Delaware (DE)
Where are fire incidents reported in Hockessin, DE
Something went wrong! Please refresh the page.
|
| |||||||||||||||||||||||||||||||||||||||||||||||||||||||||||||||||||||||||||||||||||||||||||||||||||||||||||||
2002 - 2018 National Fire Incident Reporting System (NFIRS) incidents
- Incident types reported to NFIRS in Hockessin, DE
- 93324.1%Hazardous Condition
- 88322.8%Rescue & EMS
- 77820.1%Fire
- 56914.7%Good Intent Call
- 55914.4%False Alarm
- 1253.2%Service Call
- 120.3%Special Incident
- 70.2%Overpressure Rupture
- 60.2%Severe Weather
- Fire incident types reported to NFIRS in Hockessin, DE
- 42855.0%Structure Fires
- 24030.8%Outside Fires
- 8210.5%Mobile Property/Vehicle Fires
- 283.6%Other
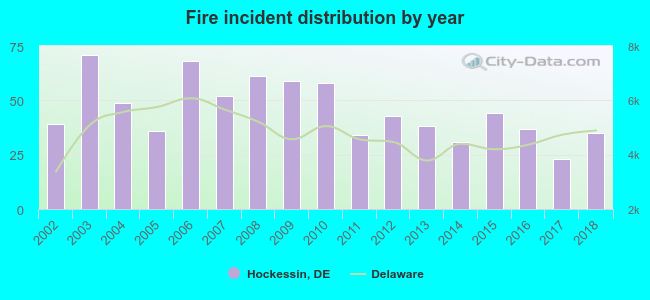 Based on the data from the years 2002 - 2018 the average number of fires per year is 46. The highest number of fire incidents - 71 took place in 2003, and the least - 23 in 2017. The data has a declining trend.
The average number of yearly fire incidents per 10k residents in Hockessin, DE compared to nearest cities:
(Note: Based on data for the last 3 years, including only cities with population 5,000 and above)
| Hockessin: | 23.4 |
| Pike Creek: | 3.2 |
| Elsmere: | 19.0 |
| Wilmington: | 159.3 |
| Newark: | 202.9 |
| Wilmington Manor: | 3.8 |
| New Castle: | 1,020.0 |
| Bear: | 92.9 |
| Claymont: | 122.0 |
 The median response time based on all reported fire incidents is 8 minutes. This is comparable to the state median value.
The median response time in Hockessin, DE compared to nearest cities:
(Note: Based on data for all years, including only cities with at least 500 fire incidents)
| Hockessin: | 8 minutes |
| Wilmington: | 6 minutes |
| Newark: | 8 minutes |
| New Castle: | 7 minutes |
| Bear: | 9 minutes |
| Claymont: | 6 minutes |
| Delaware City: | 8 minutes |
 30.1% incidents where reported in the morning and 69.9% in the evening. The most fires (19.2%) took place on Saturday, and the least (11.8%) on Friday.
 According to the 778 fire incidents from years 2002 - 2018 most fires (10.7%) took place during April, and the least (5.5%) in May.
 Out of all 3,872 cases reported during the years 2002 - 2018, the most belonged to the categories: Hazardous Condition (24.1%), Rescue & EMS (22.8%), and Fire (20.1%).
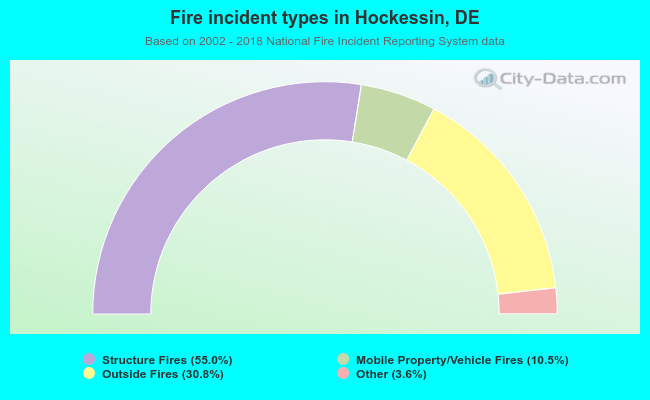 When looking into fire subcategories, the most reports belonged to: Structure Fires (55.0%), and Outside Fires (30.8%).