Hockessin, Delaware Submit your own pictures of this place and show them to the world
OSM Map
General Map
Google Map
MSN Map
OSM Map
General Map
Google Map
MSN Map
OSM Map
General Map
Google Map
MSN Map
OSM Map
General Map
Google Map
MSN Map
Please wait while loading the map...
Population in 2010: 13,527. Population change since 2000: +4.8%Males: 6,340 Females: 7,187
March 2022 cost of living index in Hockessin: 108.4 (more than average, U.S. average is 100) Percentage of residents living in poverty in 2022: 1.9%for White Non-Hispanic residents , 0.7% for Black residents )
Profiles of local businesses
Business Search - 14 Million verified businesses
Data:
Median household income ($)
Median household income (% change since 2000)
Household income diversity
Ratio of average income to average house value (%)
Ratio of average income to average rent
Median household income ($) - White
Median household income ($) - Black or African American
Median household income ($) - Asian
Median household income ($) - Hispanic or Latino
Median household income ($) - American Indian and Alaska Native
Median household income ($) - Multirace
Median household income ($) - Other Race
Median household income for houses/condos with a mortgage ($)
Median household income for apartments without a mortgage ($)
Races - White alone (%)
Races - White alone (% change since 2000)
Races - Black alone (%)
Races - Black alone (% change since 2000)
Races - American Indian alone (%)
Races - American Indian alone (% change since 2000)
Races - Asian alone (%)
Races - Asian alone (% change since 2000)
Races - Hispanic (%)
Races - Hispanic (% change since 2000)
Races - Native Hawaiian and Other Pacific Islander alone (%)
Races - Native Hawaiian and Other Pacific Islander alone (% change since 2000)
Races - Two or more races (%)
Races - Two or more races (% change since 2000)
Races - Other race alone (%)
Races - Other race alone (% change since 2000)
Racial diversity
Unemployment (%)
Unemployment (% change since 2000)
Unemployment (%) - White
Unemployment (%) - Black or African American
Unemployment (%) - Asian
Unemployment (%) - Hispanic or Latino
Unemployment (%) - American Indian and Alaska Native
Unemployment (%) - Multirace
Unemployment (%) - Other Race
Population density (people per square mile)
Population - Males (%)
Population - Females (%)
Population - Males (%) - White
Population - Males (%) - Black or African American
Population - Males (%) - Asian
Population - Males (%) - Hispanic or Latino
Population - Males (%) - American Indian and Alaska Native
Population - Males (%) - Multirace
Population - Males (%) - Other Race
Population - Females (%) - White
Population - Females (%) - Black or African American
Population - Females (%) - Asian
Population - Females (%) - Hispanic or Latino
Population - Females (%) - American Indian and Alaska Native
Population - Females (%) - Multirace
Population - Females (%) - Other Race
Coronavirus confirmed cases (May 19, 2024)
Deaths caused by coronavirus (May 19, 2024)
Coronavirus confirmed cases (per 100k population) (May 19, 2024)
Deaths caused by coronavirus (per 100k population) (May 19, 2024)
Daily increase in number of cases (May 19, 2024)
Weekly increase in number of cases (May 19, 2024)
Cases doubled (in days) (May 19, 2024)
Hospitalized patients (Apr 18, 2022)
Negative test results (Apr 18, 2022)
Total test results (Apr 18, 2022)
COVID Vaccine doses distributed (per 100k population) (Sep 19, 2023)
COVID Vaccine doses administered (per 100k population) (Sep 19, 2023)
COVID Vaccine doses distributed (Sep 19, 2023)
COVID Vaccine doses administered (Sep 19, 2023)
Likely homosexual households (%)
Likely homosexual households (% change since 2000)
Likely homosexual households - Lesbian couples (%)
Likely homosexual households - Lesbian couples (% change since 2000)
Likely homosexual households - Gay men (%)
Likely homosexual households - Gay men (% change since 2000)
Cost of living index
Median gross rent ($)
Median contract rent ($)
Median monthly housing costs ($)
Median house or condo value ($)
Median house or condo value ($ change since 2000)
Mean house or condo value by units in structure - 1, detached ($)
Mean house or condo value by units in structure - 1, attached ($)
Mean house or condo value by units in structure - 2 ($)
Mean house or condo value by units in structure by units in structure - 3 or 4 ($)
Mean house or condo value by units in structure - 5 or more ($)
Mean house or condo value by units in structure - Boat, RV, van, etc. ($)
Mean house or condo value by units in structure - Mobile home ($)
Median house or condo value ($) - White
Median house or condo value ($) - Black or African American
Median house or condo value ($) - Asian
Median house or condo value ($) - Hispanic or Latino
Median house or condo value ($) - American Indian and Alaska Native
Median house or condo value ($) - Multirace
Median house or condo value ($) - Other Race
Median resident age
Resident age diversity
Median resident age - Males
Median resident age - Females
Median resident age - White
Median resident age - Black or African American
Median resident age - Asian
Median resident age - Hispanic or Latino
Median resident age - American Indian and Alaska Native
Median resident age - Multirace
Median resident age - Other Race
Median resident age - Males - White
Median resident age - Males - Black or African American
Median resident age - Males - Asian
Median resident age - Males - Hispanic or Latino
Median resident age - Males - American Indian and Alaska Native
Median resident age - Males - Multirace
Median resident age - Males - Other Race
Median resident age - Females - White
Median resident age - Females - Black or African American
Median resident age - Females - Asian
Median resident age - Females - Hispanic or Latino
Median resident age - Females - American Indian and Alaska Native
Median resident age - Females - Multirace
Median resident age - Females - Other Race
Commute - mean travel time to work (minutes)
Travel time to work - Less than 5 minutes (%)
Travel time to work - Less than 5 minutes (% change since 2000)
Travel time to work - 5 to 9 minutes (%)
Travel time to work - 5 to 9 minutes (% change since 2000)
Travel time to work - 10 to 19 minutes (%)
Travel time to work - 10 to 19 minutes (% change since 2000)
Travel time to work - 20 to 29 minutes (%)
Travel time to work - 20 to 29 minutes (% change since 2000)
Travel time to work - 30 to 39 minutes (%)
Travel time to work - 30 to 39 minutes (% change since 2000)
Travel time to work - 40 to 59 minutes (%)
Travel time to work - 40 to 59 minutes (% change since 2000)
Travel time to work - 60 to 89 minutes (%)
Travel time to work - 60 to 89 minutes (% change since 2000)
Travel time to work - 90 or more minutes (%)
Travel time to work - 90 or more minutes (% change since 2000)
Marital status - Never married (%)
Marital status - Now married (%)
Marital status - Separated (%)
Marital status - Widowed (%)
Marital status - Divorced (%)
Median family income ($)
Median family income (% change since 2000)
Median non-family income ($)
Median non-family income (% change since 2000)
Median per capita income ($)
Median per capita income (% change since 2000)
Median family income ($) - White
Median family income ($) - Black or African American
Median family income ($) - Asian
Median family income ($) - Hispanic or Latino
Median family income ($) - American Indian and Alaska Native
Median family income ($) - Multirace
Median family income ($) - Other Race
Median year house/condo built
Median year apartment built
Year house built - Built 2005 or later (%)
Year house built - Built 2000 to 2004 (%)
Year house built - Built 1990 to 1999 (%)
Year house built - Built 1980 to 1989 (%)
Year house built - Built 1970 to 1979 (%)
Year house built - Built 1960 to 1969 (%)
Year house built - Built 1950 to 1959 (%)
Year house built - Built 1940 to 1949 (%)
Year house built - Built 1939 or earlier (%)
Average household size
Household density (households per square mile)
Average household size - White
Average household size - Black or African American
Average household size - Asian
Average household size - Hispanic or Latino
Average household size - American Indian and Alaska Native
Average household size - Multirace
Average household size - Other Race
Occupied housing units (%)
Vacant housing units (%)
Owner occupied housing units (%)
Renter occupied housing units (%)
Vacancy status - For rent (%)
Vacancy status - For sale only (%)
Vacancy status - Rented or sold, not occupied (%)
Vacancy status - For seasonal, recreational, or occasional use (%)
Vacancy status - For migrant workers (%)
Vacancy status - Other vacant (%)
Residents with income below the poverty level (%)
Residents with income below 50% of the poverty level (%)
Children below poverty level (%)
Poor families by family type - Married-couple family (%)
Poor families by family type - Male, no wife present (%)
Poor families by family type - Female, no husband present (%)
Poverty status for native-born residents (%)
Poverty status for foreign-born residents (%)
Poverty among high school graduates not in families (%)
Poverty among people who did not graduate high school not in families (%)
Residents with income below the poverty level (%) - White
Residents with income below the poverty level (%) - Black or African American
Residents with income below the poverty level (%) - Asian
Residents with income below the poverty level (%) - Hispanic or Latino
Residents with income below the poverty level (%) - American Indian and Alaska Native
Residents with income below the poverty level (%) - Multirace
Residents with income below the poverty level (%) - Other Race
Air pollution - Air Quality Index (AQI)
Air pollution - CO
Air pollution - NO2
Air pollution - SO2
Air pollution - Ozone
Air pollution - PM10
Air pollution - PM25
Air pollution - Pb
Crime - Murders per 100,000 population
Crime - Rapes per 100,000 population
Crime - Robberies per 100,000 population
Crime - Assaults per 100,000 population
Crime - Burglaries per 100,000 population
Crime - Thefts per 100,000 population
Crime - Auto thefts per 100,000 population
Crime - Arson per 100,000 population
Crime - City-data.com crime index
Crime - Violent crime index
Crime - Property crime index
Crime - Murders per 100,000 population (5 year average)
Crime - Rapes per 100,000 population (5 year average)
Crime - Robberies per 100,000 population (5 year average)
Crime - Assaults per 100,000 population (5 year average)
Crime - Burglaries per 100,000 population (5 year average)
Crime - Thefts per 100,000 population (5 year average)
Crime - Auto thefts per 100,000 population (5 year average)
Crime - Arson per 100,000 population (5 year average)
Crime - City-data.com crime index (5 year average)
Crime - Violent crime index (5 year average)
Crime - Property crime index (5 year average)
1996 Presidential Elections Results (%) - Democratic Party (Clinton)
1996 Presidential Elections Results (%) - Republican Party (Dole)
1996 Presidential Elections Results (%) - Other
2000 Presidential Elections Results (%) - Democratic Party (Gore)
2000 Presidential Elections Results (%) - Republican Party (Bush)
2000 Presidential Elections Results (%) - Other
2004 Presidential Elections Results (%) - Democratic Party (Kerry)
2004 Presidential Elections Results (%) - Republican Party (Bush)
2004 Presidential Elections Results (%) - Other
2008 Presidential Elections Results (%) - Democratic Party (Obama)
2008 Presidential Elections Results (%) - Republican Party (McCain)
2008 Presidential Elections Results (%) - Other
2012 Presidential Elections Results (%) - Democratic Party (Obama)
2012 Presidential Elections Results (%) - Republican Party (Romney)
2012 Presidential Elections Results (%) - Other
2016 Presidential Elections Results (%) - Democratic Party (Clinton)
2016 Presidential Elections Results (%) - Republican Party (Trump)
2016 Presidential Elections Results (%) - Other
2020 Presidential Elections Results (%) - Democratic Party (Biden)
2020 Presidential Elections Results (%) - Republican Party (Trump)
2020 Presidential Elections Results (%) - Other
Ancestries Reported - Arab (%)
Ancestries Reported - Czech (%)
Ancestries Reported - Danish (%)
Ancestries Reported - Dutch (%)
Ancestries Reported - English (%)
Ancestries Reported - French (%)
Ancestries Reported - French Canadian (%)
Ancestries Reported - German (%)
Ancestries Reported - Greek (%)
Ancestries Reported - Hungarian (%)
Ancestries Reported - Irish (%)
Ancestries Reported - Italian (%)
Ancestries Reported - Lithuanian (%)
Ancestries Reported - Norwegian (%)
Ancestries Reported - Polish (%)
Ancestries Reported - Portuguese (%)
Ancestries Reported - Russian (%)
Ancestries Reported - Scotch-Irish (%)
Ancestries Reported - Scottish (%)
Ancestries Reported - Slovak (%)
Ancestries Reported - Subsaharan African (%)
Ancestries Reported - Swedish (%)
Ancestries Reported - Swiss (%)
Ancestries Reported - Ukrainian (%)
Ancestries Reported - United States (%)
Ancestries Reported - Welsh (%)
Ancestries Reported - West Indian (%)
Ancestries Reported - Other (%)
Educational Attainment - No schooling completed (%)
Educational Attainment - Less than high school (%)
Educational Attainment - High school or equivalent (%)
Educational Attainment - Less than 1 year of college (%)
Educational Attainment - 1 or more years of college (%)
Educational Attainment - Associate degree (%)
Educational Attainment - Bachelor's degree (%)
Educational Attainment - Master's degree (%)
Educational Attainment - Professional school degree (%)
Educational Attainment - Doctorate degree (%)
School Enrollment - Nursery, preschool (%)
School Enrollment - Kindergarten (%)
School Enrollment - Grade 1 to 4 (%)
School Enrollment - Grade 5 to 8 (%)
School Enrollment - Grade 9 to 12 (%)
School Enrollment - College undergrad (%)
School Enrollment - Graduate or professional (%)
School Enrollment - Not enrolled in school (%)
School enrollment - Public schools (%)
School enrollment - Private schools (%)
School enrollment - Not enrolled (%)
Median number of rooms in houses and condos
Median number of rooms in apartments
Housing units lacking complete plumbing facilities (%)
Housing units lacking complete kitchen facilities (%)
Density of houses
Urban houses (%)
Rural houses (%)
Households with people 60 years and over (%)
Households with people 65 years and over (%)
Households with people 75 years and over (%)
Households with one or more nonrelatives (%)
Households with no nonrelatives (%)
Population in households (%)
Family households (%)
Nonfamily households (%)
Population in families (%)
Family households with own children (%)
Median number of bedrooms in owner occupied houses
Mean number of bedrooms in owner occupied houses
Median number of bedrooms in renter occupied houses
Mean number of bedrooms in renter occupied houses
Median number of vehichles in owner occupied houses
Mean number of vehichles in owner occupied houses
Median number of vehichles in renter occupied houses
Mean number of vehichles in renter occupied houses
Mortgage status - with mortgage (%)
Mortgage status - with second mortgage (%)
Mortgage status - with home equity loan (%)
Mortgage status - with both second mortgage and home equity loan (%)
Mortgage status - without a mortgage (%)
Average family size
Average family size - White
Average family size - Black or African American
Average family size - Asian
Average family size - Hispanic or Latino
Average family size - American Indian and Alaska Native
Average family size - Multirace
Average family size - Other Race
Geographical mobility - Same house 1 year ago (%)
Geographical mobility - Moved within same county (%)
Geographical mobility - Moved from different county within same state (%)
Geographical mobility - Moved from different state (%)
Geographical mobility - Moved from abroad (%)
Place of birth - Born in state of residence (%)
Place of birth - Born in other state (%)
Place of birth - Native, outside of US (%)
Place of birth - Foreign born (%)
Housing units in structures - 1, detached (%)
Housing units in structures - 1, attached (%)
Housing units in structures - 2 (%)
Housing units in structures - 3 or 4 (%)
Housing units in structures - 5 to 9 (%)
Housing units in structures - 10 to 19 (%)
Housing units in structures - 20 to 49 (%)
Housing units in structures - 50 or more (%)
Housing units in structures - Mobile home (%)
Housing units in structures - Boat, RV, van, etc. (%)
House/condo owner moved in on average (years ago)
Renter moved in on average (years ago)
Year householder moved into unit - Moved in 1999 to March 2000 (%)
Year householder moved into unit - Moved in 1995 to 1998 (%)
Year householder moved into unit - Moved in 1990 to 1994 (%)
Year householder moved into unit - Moved in 1980 to 1989 (%)
Year householder moved into unit - Moved in 1970 to 1979 (%)
Year householder moved into unit - Moved in 1969 or earlier (%)
Means of transportation to work - Drove car alone (%)
Means of transportation to work - Carpooled (%)
Means of transportation to work - Public transportation (%)
Means of transportation to work - Bus or trolley bus (%)
Means of transportation to work - Streetcar or trolley car (%)
Means of transportation to work - Subway or elevated (%)
Means of transportation to work - Railroad (%)
Means of transportation to work - Ferryboat (%)
Means of transportation to work - Taxicab (%)
Means of transportation to work - Motorcycle (%)
Means of transportation to work - Bicycle (%)
Means of transportation to work - Walked (%)
Means of transportation to work - Other means (%)
Working at home (%)
Industry diversity
Most Common Industries - Agriculture, forestry, fishing and hunting, and mining (%)
Most Common Industries - Agriculture, forestry, fishing and hunting (%)
Most Common Industries - Mining, quarrying, and oil and gas extraction (%)
Most Common Industries - Construction (%)
Most Common Industries - Manufacturing (%)
Most Common Industries - Wholesale trade (%)
Most Common Industries - Retail trade (%)
Most Common Industries - Transportation and warehousing, and utilities (%)
Most Common Industries - Transportation and warehousing (%)
Most Common Industries - Utilities (%)
Most Common Industries - Information (%)
Most Common Industries - Finance and insurance, and real estate and rental and leasing (%)
Most Common Industries - Finance and insurance (%)
Most Common Industries - Real estate and rental and leasing (%)
Most Common Industries - Professional, scientific, and management, and administrative and waste management services (%)
Most Common Industries - Professional, scientific, and technical services (%)
Most Common Industries - Management of companies and enterprises (%)
Most Common Industries - Administrative and support and waste management services (%)
Most Common Industries - Educational services, and health care and social assistance (%)
Most Common Industries - Educational services (%)
Most Common Industries - Health care and social assistance (%)
Most Common Industries - Arts, entertainment, and recreation, and accommodation and food services (%)
Most Common Industries - Arts, entertainment, and recreation (%)
Most Common Industries - Accommodation and food services (%)
Most Common Industries - Other services, except public administration (%)
Most Common Industries - Public administration (%)
Occupation diversity
Most Common Occupations - Management, business, science, and arts occupations (%)
Most Common Occupations - Management, business, and financial occupations (%)
Most Common Occupations - Management occupations (%)
Most Common Occupations - Business and financial operations occupations (%)
Most Common Occupations - Computer, engineering, and science occupations (%)
Most Common Occupations - Computer and mathematical occupations (%)
Most Common Occupations - Architecture and engineering occupations (%)
Most Common Occupations - Life, physical, and social science occupations (%)
Most Common Occupations - Education, legal, community service, arts, and media occupations (%)
Most Common Occupations - Community and social service occupations (%)
Most Common Occupations - Legal occupations (%)
Most Common Occupations - Education, training, and library occupations (%)
Most Common Occupations - Arts, design, entertainment, sports, and media occupations (%)
Most Common Occupations - Healthcare practitioners and technical occupations (%)
Most Common Occupations - Health diagnosing and treating practitioners and other technical occupations (%)
Most Common Occupations - Health technologists and technicians (%)
Most Common Occupations - Service occupations (%)
Most Common Occupations - Healthcare support occupations (%)
Most Common Occupations - Protective service occupations (%)
Most Common Occupations - Fire fighting and prevention, and other protective service workers including supervisors (%)
Most Common Occupations - Law enforcement workers including supervisors (%)
Most Common Occupations - Food preparation and serving related occupations (%)
Most Common Occupations - Building and grounds cleaning and maintenance occupations (%)
Most Common Occupations - Personal care and service occupations (%)
Most Common Occupations - Sales and office occupations (%)
Most Common Occupations - Sales and related occupations (%)
Most Common Occupations - Office and administrative support occupations (%)
Most Common Occupations - Natural resources, construction, and maintenance occupations (%)
Most Common Occupations - Farming, fishing, and forestry occupations (%)
Most Common Occupations - Construction and extraction occupations (%)
Most Common Occupations - Installation, maintenance, and repair occupations (%)
Most Common Occupations - Production, transportation, and material moving occupations (%)
Most Common Occupations - Production occupations (%)
Most Common Occupations - Transportation occupations (%)
Most Common Occupations - Material moving occupations (%)
People in Group quarters - Institutionalized population (%)
People in Group quarters - Correctional institutions (%)
People in Group quarters - Federal prisons and detention centers (%)
People in Group quarters - Halfway houses (%)
People in Group quarters - Local jails and other confinement facilities (including police lockups) (%)
People in Group quarters - Military disciplinary barracks (%)
People in Group quarters - State prisons (%)
People in Group quarters - Other types of correctional institutions (%)
People in Group quarters - Nursing homes (%)
People in Group quarters - Hospitals/wards, hospices, and schools for the handicapped (%)
People in Group quarters - Hospitals/wards and hospices for chronically ill (%)
People in Group quarters - Hospices or homes for chronically ill (%)
People in Group quarters - Military hospitals or wards for chronically ill (%)
People in Group quarters - Other hospitals or wards for chronically ill (%)
People in Group quarters - Hospitals or wards for drug/alcohol abuse (%)
People in Group quarters - Mental (Psychiatric) hospitals or wards (%)
People in Group quarters - Schools, hospitals, or wards for the mentally retarded (%)
People in Group quarters - Schools, hospitals, or wards for the physically handicapped (%)
People in Group quarters - Institutions for the deaf (%)
People in Group quarters - Institutions for the blind (%)
People in Group quarters - Orthopedic wards and institutions for the physically handicapped (%)
People in Group quarters - Wards in general hospitals for patients who have no usual home elsewhere (%)
People in Group quarters - Wards in military hospitals for patients who have no usual home elsewhere (%)
People in Group quarters - Juvenile institutions (%)
People in Group quarters - Long-term care (%)
People in Group quarters - Homes for abused, dependent, and neglected children (%)
People in Group quarters - Residential treatment centers for emotionally disturbed children (%)
People in Group quarters - Training schools for juvenile delinquents (%)
People in Group quarters - Short-term care, detention or diagnostic centers for delinquent children (%)
People in Group quarters - Type of juvenile institution unknown (%)
People in Group quarters - Noninstitutionalized population (%)
People in Group quarters - College dormitories (includes college quarters off campus) (%)
People in Group quarters - Military quarters (%)
People in Group quarters - On base (%)
People in Group quarters - Barracks, unaccompanied personnel housing (UPH), (Enlisted/Officer), ;and similar group living quarters for military personnel (%)
People in Group quarters - Transient quarters for temporary residents (%)
People in Group quarters - Military ships (%)
People in Group quarters - Group homes (%)
People in Group quarters - Homes or halfway houses for drug/alcohol abuse (%)
People in Group quarters - Homes for the mentally ill (%)
People in Group quarters - Homes for the mentally retarded (%)
People in Group quarters - Homes for the physically handicapped (%)
People in Group quarters - Other group homes (%)
People in Group quarters - Religious group quarters (%)
People in Group quarters - Dormitories (%)
People in Group quarters - Agriculture workers' dormitories on farms (%)
People in Group quarters - Job Corps and vocational training facilities (%)
People in Group quarters - Other workers' dormitories (%)
People in Group quarters - Crews of maritime vessels (%)
People in Group quarters - Other nonhousehold living situations (%)
People in Group quarters - Other noninstitutional group quarters (%)
Residents speaking English at home (%)
Residents speaking English at home - Born in the United States (%)
Residents speaking English at home - Native, born elsewhere (%)
Residents speaking English at home - Foreign born (%)
Residents speaking Spanish at home (%)
Residents speaking Spanish at home - Born in the United States (%)
Residents speaking Spanish at home - Native, born elsewhere (%)
Residents speaking Spanish at home - Foreign born (%)
Residents speaking other language at home (%)
Residents speaking other language at home - Born in the United States (%)
Residents speaking other language at home - Native, born elsewhere (%)
Residents speaking other language at home - Foreign born (%)
Class of Workers - Employee of private company (%)
Class of Workers - Self-employed in own incorporated business (%)
Class of Workers - Private not-for-profit wage and salary workers (%)
Class of Workers - Local government workers (%)
Class of Workers - State government workers (%)
Class of Workers - Federal government workers (%)
Class of Workers - Self-employed workers in own not incorporated business and Unpaid family workers (%)
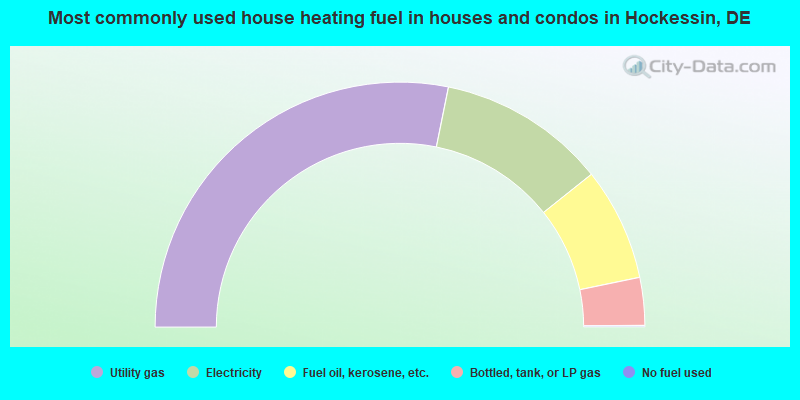
House heating fuel used in houses and condos - Utility gas (%)
House heating fuel used in houses and condos - Bottled, tank, or LP gas (%)
House heating fuel used in houses and condos - Electricity (%)
House heating fuel used in houses and condos - Fuel oil, kerosene, etc. (%)
House heating fuel used in houses and condos - Coal or coke (%)
House heating fuel used in houses and condos - Wood (%)
House heating fuel used in houses and condos - Solar energy (%)
House heating fuel used in houses and condos - Other fuel (%)
House heating fuel used in houses and condos - No fuel used (%)
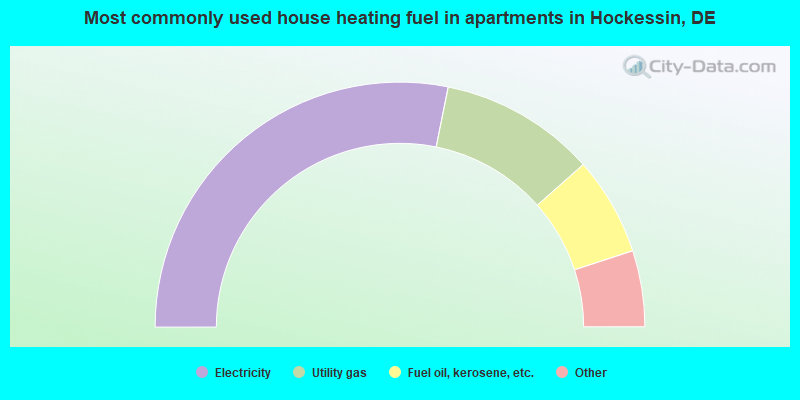
House heating fuel used in apartments - Utility gas (%)
House heating fuel used in apartments - Bottled, tank, or LP gas (%)
House heating fuel used in apartments - Electricity (%)
House heating fuel used in apartments - Fuel oil, kerosene, etc. (%)
House heating fuel used in apartments - Coal or coke (%)
House heating fuel used in apartments - Wood (%)
House heating fuel used in apartments - Solar energy (%)
House heating fuel used in apartments - Other fuel (%)
House heating fuel used in apartments - No fuel used (%)
Armed forces status - In Armed Forces (%)
Armed forces status - Civilian (%)
Armed forces status - Civilian - Veteran (%)
Armed forces status - Civilian - Nonveteran (%)
Fatal accidents locations in years 2005-2021
Fatal accidents locations in 2005
Fatal accidents locations in 2006
Fatal accidents locations in 2007
Fatal accidents locations in 2008
Fatal accidents locations in 2009
Fatal accidents locations in 2010
Fatal accidents locations in 2011
Fatal accidents locations in 2012
Fatal accidents locations in 2013
Fatal accidents locations in 2014
Fatal accidents locations in 2015
Fatal accidents locations in 2016
Fatal accidents locations in 2017
Fatal accidents locations in 2018
Fatal accidents locations in 2019
Fatal accidents locations in 2020
Fatal accidents locations in 2021
Alcohol use - People drinking some alcohol every month (%)
Alcohol use - People not drinking at all (%)
Alcohol use - Average days/month drinking alcohol
Alcohol use - Average drinks/week
Alcohol use - Average days/year people drink much
Audiometry - Average condition of hearing (%)
Audiometry - People that can hear a whisper from across a quiet room (%)
Audiometry - People that can hear normal voice from across a quiet room (%)
Audiometry - Ears ringing, roaring, buzzing (%)
Audiometry - Had a job exposure to loud noise (%)
Audiometry - Had off-work exposure to loud noise (%)
Blood Pressure & Cholesterol - Has high blood pressure (%)
Blood Pressure & Cholesterol - Checking blood pressure at home (%)
Blood Pressure & Cholesterol - Frequently checking blood cholesterol (%)
Blood Pressure & Cholesterol - Has high cholesterol level (%)
Consumer Behavior - Money monthly spent on food at supermarket/grocery store
Consumer Behavior - Money monthly spent on food at other stores
Consumer Behavior - Money monthly spent on eating out
Consumer Behavior - Money monthly spent on carryout/delivered foods
Consumer Behavior - Income spent on food at supermarket/grocery store (%)
Consumer Behavior - Income spent on food at other stores (%)
Consumer Behavior - Income spent on eating out (%)
Consumer Behavior - Income spent on carryout/delivered foods (%)
Current Health Status - General health condition (%)
Current Health Status - Blood donors (%)
Current Health Status - Has blood ever tested for HIV virus (%)
Current Health Status - Left-handed people (%)
Dermatology - People using sunscreen (%)
Diabetes - Diabetics (%)
Diabetes - Had a blood test for high blood sugar (%)
Diabetes - People taking insulin (%)
Diet Behavior & Nutrition - Diet health (%)
Diet Behavior & Nutrition - Milk product consumption (# of products/month)
Diet Behavior & Nutrition - Meals not home prepared (#/week)
Diet Behavior & Nutrition - Meals from fast food or pizza place (#/week)
Diet Behavior & Nutrition - Ready-to-eat foods (#/month)
Diet Behavior & Nutrition - Frozen meals/pizza (#/month)
Drug Use - People that ever used marijuana or hashish (%)
Drug Use - Ever used hard drugs (%)
Drug Use - Ever used any form of cocaine (%)
Drug Use - Ever used heroin (%)
Drug Use - Ever used methamphetamine (%)
Health Insurance - People covered by health insurance (%)
Kidney Conditions-Urology - Avg. # of times urinating at night
Medical Conditions - People with asthma (%)
Medical Conditions - People with anemia (%)
Medical Conditions - People with psoriasis (%)
Medical Conditions - People with overweight (%)
Medical Conditions - Elderly people having difficulties in thinking or remembering (%)
Medical Conditions - People who ever received blood transfusion (%)
Medical Conditions - People having trouble seeing even with glass/contacts (%)
Medical Conditions - People with arthritis (%)
Medical Conditions - People with gout (%)
Medical Conditions - People with congestive heart failure (%)
Medical Conditions - People with coronary heart disease (%)
Medical Conditions - People with angina pectoris (%)
Medical Conditions - People who ever had heart attack (%)
Medical Conditions - People who ever had stroke (%)
Medical Conditions - People with emphysema (%)
Medical Conditions - People with thyroid problem (%)
Medical Conditions - People with chronic bronchitis (%)
Medical Conditions - People with any liver condition (%)
Medical Conditions - People who ever had cancer or malignancy (%)
Mental Health - People who have little interest in doing things (%)
Mental Health - People feeling down, depressed, or hopeless (%)
Mental Health - People who have trouble sleeping or sleeping too much (%)
Mental Health - People feeling tired or having little energy (%)
Mental Health - People with poor appetite or overeating (%)
Mental Health - People feeling bad about themself (%)
Mental Health - People who have trouble concentrating on things (%)
Mental Health - People moving or speaking slowly or too fast (%)
Mental Health - People having thoughts they would be better off dead (%)
Oral Health - Average years since last visit a dentist
Oral Health - People embarrassed because of mouth (%)
Oral Health - People with gum disease (%)
Oral Health - General health of teeth and gums (%)
Oral Health - Average days a week using dental floss/device
Oral Health - Average days a week using mouthwash for dental problem
Oral Health - Average number of teeth
Pesticide Use - Households using pesticides to control insects (%)
Pesticide Use - Households using pesticides to kill weeds (%)
Physical Activity - People doing vigorous-intensity work activities (%)
Physical Activity - People doing moderate-intensity work activities (%)
Physical Activity - People walking or bicycling (%)
Physical Activity - People doing vigorous-intensity recreational activities (%)
Physical Activity - People doing moderate-intensity recreational activities (%)
Physical Activity - Average hours a day doing sedentary activities
Physical Activity - Average hours a day watching TV or videos
Physical Activity - Average hours a day using computer
Physical Functioning - People having limitations keeping them from working (%)
Physical Functioning - People limited in amount of work they can do (%)
Physical Functioning - People that need special equipment to walk (%)
Physical Functioning - People experiencing confusion/memory problems (%)
Physical Functioning - People requiring special healthcare equipment (%)
Prescription Medications - Average number of prescription medicines taking
Preventive Aspirin Use - Adults 40+ taking low-dose aspirin (%)
Reproductive Health - Vaginal deliveries (%)
Reproductive Health - Cesarean deliveries (%)
Reproductive Health - Deliveries resulted in a live birth (%)
Reproductive Health - Pregnancies resulted in a delivery (%)
Reproductive Health - Women breastfeeding newborns (%)
Reproductive Health - Women that had a hysterectomy (%)
Reproductive Health - Women that had both ovaries removed (%)
Reproductive Health - Women that have ever taken birth control pills (%)
Reproductive Health - Women taking birth control pills (%)
Reproductive Health - Women that have ever used Depo-Provera or injectables (%)
Reproductive Health - Women that have ever used female hormones (%)
Sexual Behavior - People 18+ that ever had sex (vaginal, anal, or oral) (%)
Sexual Behavior - Males 18+ that ever had vaginal sex with a woman (%)
Sexual Behavior - Males 18+ that ever performed oral sex on a woman (%)
Sexual Behavior - Males 18+ that ever had anal sex with a woman (%)
Sexual Behavior - Males 18+ that ever had any sex with a man (%)
Sexual Behavior - Females 18+ that ever had vaginal sex with a man (%)
Sexual Behavior - Females 18+ that ever performed oral sex on a man (%)
Sexual Behavior - Females 18+ that ever had anal sex with a man (%)
Sexual Behavior - Females 18+ that ever had any kind of sex with a woman (%)
Sexual Behavior - Average age people first had sex
Sexual Behavior - Average number of female sex partners in lifetime (males 18+)
Sexual Behavior - Average number of female vaginal sex partners in lifetime (males 18+)
Sexual Behavior - Average age people first performed oral sex on a woman (18+)
Sexual Behavior - Average number of woman performed oral sex on in lifetime (18+)
Sexual Behavior - Average number of male sex partners in lifetime (males 18+)
Sexual Behavior - Average number of male anal sex partners in lifetime (males 18+)
Sexual Behavior - Average age people first performed oral sex on a man (18+)
Sexual Behavior - Average number of male oral sex partners in lifetime (18+)
Sexual Behavior - People using protection when performing oral sex (%)
Sexual Behavior - Average number of times people have vaginal or anal sex a year
Sexual Behavior - People having sex without condom (%)
Sexual Behavior - Average number of male sex partners in lifetime (females 18+)
Sexual Behavior - Average number of male vaginal sex partners in lifetime (females 18+)
Sexual Behavior - Average number of female sex partners in lifetime (females 18+)
Sexual Behavior - Circumcised males 18+ (%)
Sleep Disorders - Average hours sleeping at night
Sleep Disorders - People that has trouble sleeping (%)
Smoking-Cigarette Use - People smoking cigarettes (%)
Taste & Smell - People 40+ having problems with smell (%)
Taste & Smell - People 40+ having problems with taste (%)
Taste & Smell - People 40+ that ever had wisdom teeth removed (%)
Taste & Smell - People 40+ that ever had tonsils teeth removed (%)
Taste & Smell - People 40+ that ever had a loss of consciousness because of a head injury (%)
Taste & Smell - People 40+ that ever had a broken nose or other serious injury to face or skull (%)
Taste & Smell - People 40+ that ever had two or more sinus infections (%)
Weight - Average height (inches)
Weight - Average weight (pounds)
Weight - Average BMI
Weight - People that are obese (%)
Weight - People that ever were obese (%)
Weight - People trying to lose weight (%)
According to our research of Delaware and other state lists, there were 7 registered sex offenders living in Hockessin, Delaware as of May 19, 2024 . The ratio of all residents to sex offenders in Hockessin is 1,975 to 1.The ratio of registered sex offenders to all residents in this city is much lower than the state average.
Latest news from Hockessin, DE collected exclusively by city-data.com from local newspapers, TV, and radio stations
Ancestries: Irish (13.6%), English (12.1%), Italian (11.3%), American (7.2%), German (5.9%), European (3.8%).
Current Local Time:
Land area: 10.0 square miles.
Population density: 1,349 people per square mile (low).
1,214 residents are foreign born (5.7% Asia , 1.6% Latin America ).
This place:
8.7%Delaware:
9.8%
Median real estate property taxes paid for housing units with mortgages in 2022: $4,198 (0.7%)Median real estate property taxes paid for housing units with no mortgage in 2022: $4,682 (0.9%)
Nearest city with pop. 50,000+: Wilmington, DE
Nearest city with pop. 200,000+: Philadelphia, PA
Nearest cities:
Latitude: 39.78 N, Longitude: 75.69 W
Daytime population change due to commuting: -784 (-5.6%)Workers who live and work in this place: 2,259 (34.1%)
Unemployment in December 2023:
Most common occupations in Hockessin, DE (%)
Both Males Females
Other management occupations, except farmers and farm managers (8.3%)
Life and physical scientists (4.6%)
Other sales and related occupations, including supervisors (4.4%)
Preschool, kindergarten, elementary, and middle school teachers (4.4%)
Computer specialists (4.3%)
Top executives (4.1%)
Sales representatives, services, wholesale and manufacturing (4.0%)
Other management occupations, except farmers and farm managers (10.6%)
Engineers (6.6%)
Life and physical scientists (6.6%)
Top executives (5.6%)
Sales representatives, services, wholesale and manufacturing (4.9%)
Other sales and related occupations, including supervisors (4.7%)
Computer specialists (4.7%)
Preschool, kindergarten, elementary, and middle school teachers (8.6%)
Secretaries and administrative assistants (7.2%)
Registered nurses (5.7%)
Other management occupations, except farmers and farm managers (5.4%)
Information and record clerks, except customer service representatives (4.6%)
Other office and administrative support workers, including supervisors (4.5%)
Other sales and related occupations, including supervisors (4.1%)
Tornado activity:
Hockessin-area historical tornado activity is above Delaware state average. It is 12% greater than the overall U.S. average.
On 7/27/1994, a category F3 (max. wind speeds 158-206 mph) tornado 3.6 miles away from the Hockessin place center injured 11 people and caused between $500,000 and $5,000,000 in damages.
On 4/28/1961, a category F3 tornado 10.0 miles away from the place center caused between $5000 and $50,000 in damages.
Earthquake activity:
Hockessin-area historical earthquake activity is significantly above Delaware state average. It is 64% smaller than the overall U.S. average. On 8/23/2011 at 17:51:04, a magnitude 5.8 (5.8 MW, Depth: 3.7 mi, Class: Moderate, Intensity: VI - VII) earthquake occurred 177.5 miles away from the city center On 1/16/1994 at 01:49:16, a magnitude 4.6 (4.6 MB, 4.6 LG, Depth: 3.1 mi, Class: Light, Intensity: IV - V) earthquake occurred 42.1 miles away from the city center On 1/16/1994 at 00:42:43, a magnitude 4.2 (4.2 MB, 4.0 LG, Depth: 3.1 mi) earthquake occurred 41.2 miles away from the city center On 11/30/2017 at 21:47:31, a magnitude 4.1 (4.1 MW, Depth: 6.1 mi) earthquake occurred 42.7 miles away from the city center On 9/25/1998 at 19:52:52, a magnitude 5.2 (4.8 MB, 4.3 MS, 5.2 LG, 4.5 MW, Depth: 3.1 mi) earthquake occurred 273.9 miles away from the city center On 10/7/1983 at 10:18:46, a magnitude 5.3 (5.1 MB, 5.3 LG, 5.1 ML) earthquake occurred 296.5 miles away from the city center Magnitude types: regional Lg-wave magnitude (LG), body-wave magnitude (MB), local magnitude (ML), surface-wave magnitude (MS), moment magnitude (MW) Natural disasters: The number of natural disasters in New Castle County (15) is near the US average (15).Major Disasters (Presidential) Declared: 9Emergencies Declared: 5Hurricanes: 7, Snowstorms: 2, Tropical Storms: 2, Winter Storms: 2, Blizzard: 1, Flood: 1, Snowfall: 1, Storm: 1, Tornado: 1, Water Shortage: 1, Other: 1 (Note: some incidents may be assigned to more than one category). Hospitals and medical centers in Hockessin: COKESBURY VILLAGE (726 LOVEVILLE ROAD)
REGAL HEIGHTS HEALTHCARE AND REHAB CENTER (6525 LANCASTER PIKE)
ST. FRANCIS CARE/BRACKENVILLE (100 ST. CLAIRE DRIVE)
Amtrak stations near Hockessin: 8 miles: WILMINGTON (M. L. KING BLVD, & FRENCH ST.) Services: ticket office, partially wheelchair accessible, enclosed waiting area, public restrooms, public payphones, snack bar, ATM, paid short-term parking, paid long-term parking, car rental agency, taxi stand, intercity bus service, public transit connection.
9 miles: NEWARK (429 S. COLLEGE AVE.) Services: public payphones, free short-term parking, call for car rental service, call for taxi service, public transit connection.
16 miles: DOWNINGTOWN (VIADUCT AVE.) Services: public payphones, paid short-term parking, call for car rental service, call for taxi service, public transit connection.
Operable nuclear power plants near Hockessin:
19 miles: Salem 2 in Salem, NJ.19 miles: Hope Creek in Salem, NJ.19 miles: Salem 1 in Salem, NJ.
Colleges/universities with over 2000 students nearest to Hockessin:
Delaware Technical Community College-Stanton/Wilmington (about 8 miles; Wilmington, DE ; Full-time enrollment: 4,972)
University of Delaware (about 9 miles; Newark, DE ; FT enrollment: 20,078)
Wilmington University (about 9 miles; New Castle, DE ; FT enrollment: 10,072)
West Chester University of Pennsylvania (about 13 miles; West Chester, PA ; FT enrollment: 14,492)
Lincoln University of Pennsylvania (about 13 miles; Lincoln University, PA ; FT enrollment: 2,042)
Neumann University (about 15 miles; Aston, PA ; FT enrollment: 2,622)
Immaculata University (about 18 miles; Immaculata, PA ; FT enrollment: 2,912)
Private high schools in Hockessin: SANFORD SCHOOL Students: 599, Location: 6900 LANCASTER PIKE, Grades: PK-12)WILMINGTON CHRISTIAN SCHOOL Students: 486, Location: 825 LOVEVILLE RD, Grades: PK-12)
Public elementary/middle schools in Hockessin:
Private elementary/middle school in Hockessin: HOCKESSIN MONTESSORI SCHOOL Students: 143, Location: 1000 OLD LANCASTER PIKE, Grades: PK-8)
See full list of schools located in Hockessin User-submitted facts and corrections:
James Fox was born in baltimore MD. However he has lived in Hockessin for the past 10 years. Bernad Hopkins, the profesional boxer, also currently lives in Hockessin. added by Mikey K
Birthplace of: James Fox - College basketball player (Loyola MD Greyhounds).
New Castle County has a predicted average indoor radon screening level between 2 and 4 pCi/L (pico curies per liter) - Moderate Potential Drinking water stations with addresses in Hockessin and their reported violations in the past:
SHOPPES OF LONDON BRITAIN LP (Serves PA, Population served: 250, Groundwater):
Past monitoring violations:
2 routine major monitoring violations
Population served: 200, Groundwater):
Past health violations:
MCL, Monthly (TCR) - Between OCT-2013 and DEC-2013, Contaminant: Coliform. Follow-up actions: St Public Notif requested (DEC-04-2013), St Formal NOV issued (DEC-04-2013), St Public Notif received (DEC-18-2013), St Compliance achieved (JAN-16-2014)
Address: ATTN PAUL C. VENTI TREASURER Serves MA, Population served: 150, Groundwater):
Past monitoring violations:
Follow-up Or Routine LCR Tap M/R - In JUN-01-2011, Contaminant: Lead and Copper Rule. Follow-up actions: St AO (w/o penalty) issued (NOV-08-2011)
Follow-up Or Routine LCR Tap M/R - In OCT-01-2006, Contaminant: Lead and Copper Rule. Follow-up actions: St AO (w/o penalty) issued (DEC-06-2006), St Compliance achieved (FEB-03-2010)
2 routine major monitoring violations
One regular monitoring violation
Drinking water stations with addresses in Hockessin that have no violations reported:
ASHLAND NATURE CENTER SYSTEM #2 (Population served: 125, Primary Water Source Type: Groundwater)
COUNTRY CENTER GIRL SCOUT CAMP (Address: 1051 Sharpless Road Population served: 100, Primary Water Source Type: Groundwater)
MT CUBA CENTER (Population served: 60, Primary Water Source Type: Groundwater)
Average household size: This place:
2.8 peopleDelaware:
2.5 people
Percentage of family households: This place:
82.4%Whole state:
67.4%
Percentage of households with unmarried partners: This place:
2.7%Whole state:
7.3%
Likely homosexual households (counted as self-reported same-sex unmarried-partner households)
Lesbian couples: 0.4% of all households Gay men: 0.2% of all households
People in group quarters in Hockessin in 2010:
289 people in nursing facilities/skilled-nursing facilities
8 people in group homes intended for adults
3 people in other noninstitutional facilities
people in nursing homes in 2000people in religious group quarters in 2000Banks with branches in Hockessin (2011 data):
PNC Bank, National Association: Cokesbury Village Branch at 726 Loveville Road, branch established on 1990/05/08; Hockessin Branch at 7421 Lancaster Pike, branch established on 1976/03/15. Info updated 2012/03/20: Bank assets: $263,309.6 mil, Deposits: $197,343.0 mil, headquarters in Wilmington, DE, positive income , Commercial Lending Specialization, 3085 total offices , Holding Company: Pnc Financial Services Group, Inc., The
Wells Fargo Bank, National Association: Pike Creek Branch at 5801 Limestone Road, branch established on 1991/02/23; Hockessin Branch at 7270 Lancaster Pike And Yorklyn Road, branch established on 1966/03/01. Info updated 2011/04/05: Bank assets: $1,161,490.0 mil, Deposits: $905,653.0 mil, headquarters in Sioux Falls, SD, positive income , 6395 total offices , Holding Company: Wells Fargo & Company
RBS Citizens, National Association: Hockessin Acme Branch at 128 Lantana Drive, branch established on 2004/04/15. Info updated 2007/09/19: Bank assets: $106,940.6 mil, Deposits: $75,690.2 mil, headquarters in Providence, RI, positive income , 1135 total offices , Holding Company: Uk Financial Investments Limited
Manufacturers and Traders Trust Company: Hockessin Branch at 151 Lantana Drive, branch established on 1991/03/04. Info updated 2011/08/08: Bank assets: $76,887.1 mil, Deposits: $60,064.2 mil, headquarters in Buffalo, NY, positive income , Commercial Lending Specialization, 808 total offices , Holding Company: M&T Bank Corporation
Wilmington Savings Fund Society, FSB: Hockessin Branch at 7450 Lancaster Pike, branch established on 2000/06/16. Info updated 2011/07/21: Bank assets: $4,281.1 mil, Deposits: $3,150.2 mil, headquarters in Wilmington, DE, positive income , Commercial Lending Specialization, 43 total offices
TD Bank, National Association: Hockessin Branch at 7330 Lancaster Pike, branch established on 2008/11/11. Info updated 2010/10/04: Bank assets: $188,912.6 mil, Deposits: $153,149.8 mil, headquarters in Wilmington, DE, positive income , 1314 total offices , Holding Company: Toronto-Dominion Bank, The
For population 15 years and over in Hockessin:
Never married: 22.4%Now married: 63.8%Separated: 0.3%Widowed: 6.7%Divorced: 6.9% For population 25 years and over in Hockessin:
High school or higher: 98.0%Bachelor's degree or higher: 69.0%Graduate or professional degree: 33.3%Unemployed: 1.3%Mean travel time to work (commute): 16.9 minutes
Education Gini index (Inequality in education) Here:
9.7Delaware average:
11.5
Religion statistics for Hockessin, DE (based on New Castle County data)
Religion Adherents Congregations Catholic 138,172 33 Mainline Protestant 48,124 125 Evangelical Protestant 32,993 169 Other 22,672 45 Black Protestant 7,212 36 Orthodox 1,166 5 None 288,140 -
Source: Clifford Grammich, Kirk Hadaway, Richard Houseal, Dale E.Jones, Alexei Krindatch, Richie Stanley and Richard H.Taylor. 2012. 2010 U.S.Religion Census: Religious Congregations & Membership Study. Association of Statisticians of American Religious Bodies. Jones, Dale E., et al. 2002. Congregations and Membership in the United States 2000. Nashville, TN: Glenmary Research Center. Graphs represent county-level data
Food Environment Statistics: Number of grocery stores : 82Here :
1.56 / 10,000 pop.Delaware :
1.74 / 10,000 pop.
Number of supercenters and club stores : 3Here :
0.06 / 10,000 pop.Delaware :
0.09 / 10,000 pop.
Number of convenience stores (no gas) : 71New Castle County :
1.35 / 10,000 pop.State :
1.25 / 10,000 pop.
Number of convenience stores (with gas) : 112New Castle County :
2.13 / 10,000 pop.Delaware :
2.84 / 10,000 pop.
Number of full-service restaurants : 337New Castle County :
6.40 / 10,000 pop.Delaware :
7.43 / 10,000 pop.
Adult diabetes rate : New Castle County :
8.0%State :
9.0%
Adult obesity rate : New Castle County :
26.7%State :
27.9%
Health and Nutrition: Healthy diet rate : This city:
58.3%State:
49.1%
Average overall health of teeth and gums : Average BMI : Hockessin:
27.7Delaware:
28.8
People feeling badly about themselves : This city:
19.8%Delaware:
20.8%
People not drinking alcohol at all : Average hours sleeping at night : Hockessin:
7.0Delaware:
6.8
Overweight people : Hockessin:
34.2%State:
33.9%
General health condition : This city:
63.2%State:
55.5%
Average condition of hearing : More about Health and Nutrition of Hockessin, DE Residents
5.39% of this county's 2021 resident taxpayers lived in other counties in 2020 ($73,141 average adjusted gross income )
Here:
5.39%Delaware average:
6.79%
0.01% of residents moved from foreign countries ($80 average AGI )New Castle County:
0.01%Delaware average:
0.03%
Top counties from which taxpayers relocated into this county between 2020 and 2021:
5.25% of this county's 2020 resident taxpayers moved to other counties in 2021 ($94,385 average adjusted gross income )
Here:
5.25%Delaware average:
5.45%
0.01% of residents moved to foreign countries ($149 average AGI )New Castle County:
0.01%Delaware average:
0.03%
Top counties to which taxpayers relocated from this county between 2020 and 2021:
Businesses in Hockessin, DE
Name Count Name Count
AT&T 1 Papa John's Pizza 1 Dunkin Donuts 1 True Value 1 FedEx 3 UPS 2 Goodwill 1 Walgreens 2
Strongest AM radio stations in Hockessin:
WVCH (740 AM; 50 kW; CHESTER, PA; Owner: WVCH COMMUNICATIONS, INC.)
WPEN (950 AM; 50 kW; PHILADELPHIA, PA; Owner: GREATER PHILADELPHIA RADIO, INC.)
WDEL (1150 AM; 5 kW; WILMINGTON, DE; Owner: DELMARVA BROADCASTING COMPANY)
WTMC (1380 AM; 5 kW; WILMINGTON, DE; Owner: STATE OF DELAWARE DEPARTMENT OF TRAN)
WZZD (990 AM; 50 kW; PHILADELPHIA, PA; Owner: PENNSYLVANIA MEDIA ASSOCIATES, INC.)
KYW (1060 AM; 50 kW; PHILADELPHIA, PA; Owner: INFINITY BROADCASTING OPERATIONS, INC.)
WNWR (1540 AM; 50 kW; PHILADELPHIA, PA)
WWJZ (640 AM; 50 kW; MOUNT HOLLY, NJ; Owner: ABC, INC.)
WPHT (1210 AM; 50 kW; PHILADELPHIA, PA; Owner: INFINITY BROADCASTING OPERATIONS, INC.)
WJBR (1290 AM; 2 kW; WILMINGTON, DE; Owner: CAPSTAR TX LIMITED PARTNERSHIP)
WCBM (680 AM; 50 kW; BALTIMORE, MD; Owner: WCBM MARYLAND, INC.)
WEEU (830 AM; 20 kW; READING, PA; Owner: WEEU BROADCASTING COMPANY)
WWLG (1370 AM; 50 kW; BALTIMORE, MD; Owner: M-10 BROADCASTING, INC.)
Strongest FM radio stations in Hockessin:
WMHS (88.1 FM; PIKE CREEK, DE; Owner: RED CLAY CONSOLIDATED SCHOOL DISTRICT)
WSTW (93.7 FM; WILMINGTON, DE; Owner: DELMARVA BROADCASTING COMPANY)
WJBR-FM (99.5 FM; WILMINGTON, DE; Owner: NM LICENSING, LLC)
WPLY (100.3 FM; MEDIA, PA; Owner: RADIO ONE LICENSES, LLC)
WMWX (95.7 FM; PHILADELPHIA, PA; Owner: GREATER PHILADELPHIA RADIO, INC.)
WMGK (102.9 FM; PHILADELPHIA, PA; Owner: GREATER PHILADELPHIA RADIO, INC.)
WOGL (98.1 FM; PHILADELPHIA, PA; Owner: INFINITY BROADCASTING OPERATIONS, INC.)
WSNI-FM (104.5 FM; PHILADELPHIA, PA; Owner: AMFM RADIO LICENSES, L.L.C.)
WBEB (101.1 FM; PHILADELPHIA, PA; Owner: WEAZ-FM RADIO, INC.)
WRTI (90.1 FM; PHILADELPHIA, PA; Owner: TEMPLE UNIV. OF THE COMMONWEALTH, ET)
WPHI-FM (103.9 FM; JENKINTOWN, PA; Owner: RADIO ONE LICENSES, LLC)
WXPN (88.5 FM; PHILADELPHIA, PA; Owner: TRUSTEES OF THE UNIVERSITY OF PENNA.)
WHYY-FM (90.9 FM; PHILADELPHIA, PA; Owner: WHYY, INC.)
WXTU (92.5 FM; PHILADELPHIA, PA; Owner: WXTU LICENSE LIMITED PARTNERSHIP)
WDAS-FM (105.3 FM; PHILADELPHIA, PA; Owner: AMFM RADIO LICENSES, L.L.C.)
WYSP (94.1 FM; PHILADELPHIA, PA; Owner: INFINITY BROADCASTING OPERATIONS, INC.)
WMMR (93.3 FM; PHILADELPHIA, PA; Owner: GREATER BOSTON RADIO, INC.)
WPTP (96.5 FM; PHILADELPHIA, PA; Owner: WDAS LICENSE LIMITED PARTNERSHIP)
WVUD (91.3 FM; NEWARK, DE; Owner: UNIVERSITYOF DELAWARE)
WUSL (98.9 FM; PHILADELPHIA, PA; Owner: AMFM RADIO LICENSES, L.L.C.)
TV broadcast stations around Hockessin:
WTSD-CA (Channel 14; WILMINGTON, DE; Owner: PRIORITY COMMUNICATIONS MINISTRIES, INC.)
KYW-TV (Channel 3; PHILADELPHIA, PA; Owner: CBS BROADCASTING INC.)
WPHL-TV (Channel 17; PHILADELPHIA, PA; Owner: TRIBUNE TELEVISION COMPANY)
WPPX (Channel 61; WILMINGTON, DE; Owner: PAXSON PHILADELPHIA LICENSE, INC.)
WPVI-TV (Channel 6; PHILADELPHIA, PA; Owner: ABC, INC.)
WPSG (Channel 57; PHILADELPHIA, PA; Owner: VIACOM STATIONS GROUP OF PHILADELPHIA INC.)
WCAU (Channel 10; PHILADELPHIA, PA; Owner: NBC SUBSIDIARY (WCAU-TV), L.P.)
WGTW (Channel 48; BURLINGTON, NJ; Owner: BRUNSON COMMUNICATIONS, INC.)
WYBE (Channel 35; PHILADELPHIA, PA; Owner: INDEPENDENCE PUBLIC MEDIA OF PHILADELPHIA, INC.)
WWJT-LP (Channel 7; PHILADELPHIA, PA; Owner: PHILADELPHIA TELEVISION NETWORK, INC)
WHYY-TV (Channel 12; WILMINGTON, DE; Owner: WHYY, INC.)
W40AZ (Channel 40; WILMINGTON, DE; Owner: NATIONAL MINORITY T.V., INC.)
W55BT (Channel 55; TALLEYVILLE, DE; Owner: MEDIACASTING LLC)
WTXF-TV (Channel 29; PHILADELPHIA, PA; Owner: FOX TV STATIONS OF PHILADELPHIA)
WELL-LP (Channel 8; WILLOW GROVE, ETC., PA; Owner: WORD OF GOD FELLOWSHIP, INC.)
WUVP (Channel 65; VINELAND, NJ; Owner: UNIVISION PHILADELPHIA LLC)
WMCN-TV (Channel 53; ATLANTIC CITY, NJ; Owner: LENFEST BROADCASTING, LLC)
WFPA-CA (Channel 28; PHILADELPHIA, PA; Owner: WXTV LICENSE PARTNERSHIP, G.P.)
WPHA-LP (Channel 63; PHILADELPHIA, PA; Owner: COMMERCIAL BROADCASTING CORP.)
National Bridge Inventory (NBI) Statistics 29 Number of bridges167ft / 50.8m Total length $4,269,000 Total costs157,828 Total average daily traffic14,021 Total average daily truck traffic196,781 Total future (year 2038) average daily traffic
New bridges - historical statistics
2 Before 1900 1 1910-1919 3 1920-1929 3 1930-1939 1 1940-1949 3 1960-1969 5 1970-1979 6 1980-1989 2 1990-1999 2 2000-2009 1 2010-2019
See full National Bridge Inventory statistics for Hockessin, DE
FCC Registered Antenna Towers: 22 (
See the full list of FCC Registered Antenna Towers in Hockessin )
FCC Registered Broadcast Land Mobile Towers: 6
HOCKESSIN FIRE CO, 1225 Old Lancaster Pike (Lat: 39.787889 Lon: -75.694667), Type: Tower, Structure height: 46 m, Call Sign: WPTF849, Assigned Frequencies: 157.450 MHz, Grant Date: 08/16/2011, Expiration Date: 09/24/2021, Cancellation Date: 11/27/2021, Certifier: David Roser, Registrant: Delmarva Comm, 113 J & M Drive, New Castle, DE 19720, Phone: (302) 324-1230, Email:
HOCKENSSIN-CONECTIV, 7645 Lancaster Pike (Lat: 39.795833 Lon: -75.711111), Type: Tower, Structure height: 60.3 m, Call Sign: WQAP302, Assigned Frequencies: 453.050 MHz, 453.300 MHz, Grant Date: 05/30/2014, Expiration Date: 07/13/2024, Certifier: David J Roberts, Registrant: V-Comm L.L.C, 2147 Route 27, Suite 102, Edison, NJ 08817, Phone: (609) 655-1200, Email:
Lat: 39.723000 Lon: -75.601917, Call Sign: WQGH739, Assigned Frequencies: 72.2800 MHz, Grant Date: 01/22/2007, Expiration Date: 01/22/2017, Cancellation Date: 03/25/2017, Certifier: Steve Kuhl, Registrant: Primex Wireless, Inc, 965 Wells St, Lake Geneva, WI 53147, Phone: (800) 537-0464Lat: 39.785556 Lon: -75.688861, Call Sign: WQVA699, Assigned Frequencies: 451.806 MHz, 451.818 MHz, 456.806 MHz, 456.818 MHz, Grant Date: 12/09/2014, Expiration Date: 12/09/2024, Certifier: Bill Barrow, Registrant: Baycomm, Inc., 1016 Talon Lane, Wilmington, DE 19807, Phone: (302) 254-8100, Email:
SCHOOL, 1000 Old Lancaster Pike (Lat: 39.778056 Lon: -75.679444), Call Sign: WRER709, Assigned Frequencies: 456.237 MHz, 456.462 MHz, 457.112 MHz, Grant Date: 12/09/2019, Expiration Date: 12/09/2029, Certifier: Janette Henry, Registrant: Delmarva Communications, 113 J & M Dr, New Castle, DE 19720, Phone: (302) 324-1230, Fax: (302) 324-1238, Email:
Lat: 39.768083 Lon: -75.659111, Call Sign: WRFN783, Assigned Frequencies: 451.487 MHz, 451.712 MHz, 452.137 MHz, 456.487 MHz, 456.712 MHz, Grant Date: 04/03/2020, Expiration Date: 04/03/2030, Certifier: Miguel Gonzalez, Registrant: Procom Corporation, 8260 Patuxent Range Road, Jessup, MD 20794, Phone: (301) 497-9080, Fax: (301) 497-9082, Email:
FCC Registered Microwave Towers: 3
HOCKESSIN, Rt. 41 At De/Pa State Line (Lat: 39.795833 Lon: -75.711111), Type: Ltower, Structure height: 60.3 m, Call Sign: WQCN434, Assigned Frequencies: 6755.00 MHz, 6765.00 MHz, Grant Date: 03/05/2015, Expiration Date: 04/14/2025, Certifier: Richard R Reynolds, Registrant: State Of Delaware, 3050 Upper King Rd, Dover, DE 19904, Phone: (302) 697-4486, Fax: (302) 697-0305, Email:
DE0023B, 1225 Old Lancaster Pike (Lat: 39.787778 Lon: -75.695361), Type: Tower, Structure height: 49.4 m, Call Sign: WQMC376, Assigned Frequencies: 23030.0 MHz, Grant Date: 06/25/2010, Expiration Date: 06/25/2020, Cancellation Date: 02/16/2012, Certifier: Dan Mieszala, Registrant: Open Range Communications Inc., 6430 S. Fiddlers Green Circle, Suite 500, Greenwood Village, CO 80111, Phone: (303) 376-2112, Fax: (303) 376-2109, Email:
DE0037, 726 Loveville Rd. (Lat: 39.773667 Lon: -75.662694), Type: Bant, Structure height: 29 m, Overall height: 34 m, Call Sign: WQMC377, Assigned Frequencies: 23135.0 MHz, 10875.0 MHz, Grant Date: 06/25/2010, Expiration Date: 06/25/2020, Cancellation Date: 02/16/2012, Certifier: Dan Mieszala, Registrant: Open Range Communications Inc., 6430 S. Fiddlers Green Circle, Suite 500, Greenwood Village, CO 80111, Phone: (303) 376-2112, Fax: (303) 376-2109, Email:
FCC Registered Amateur Radio Licenses: 89 (
See the full list of FCC Registered Amateur Radio Licenses in Hockessin )
FAA Registered Aircraft: 32 (
See the full list of FAA Registered Aircraft in Hockessin )
Home Mortgage Disclosure Act Aggregated Statistics For Year 2009(Based on 1 full and 2 partial tracts) A) FHA, FSA/RHS & VA B) Conventional C) Refinancings D) Home Improvement Loans F) Non-occupant Loans on Number Average Value Number Average Value Number Average Value Number Average Value Number Average Value
LOANS ORIGINATED 29 $308,118 103 $283,507 536 $257,350 22 $134,460 15 $235,545 APPLICATIONS APPROVED, NOT ACCEPTED 1 $335,880 7 $264,447 37 $263,237 6 $34,333 0 $0 APPLICATIONS DENIED 1 $234,930 5 $343,440 107 $289,445 20 $58,456 3 $136,350 APPLICATIONS WITHDRAWN 2 $367,295 5 $265,710 70 $281,064 7 $241,246 1 $360,710 FILES CLOSED FOR INCOMPLETENESS 0 $0 2 $357,740 21 $289,463 2 $177,055 1 $50,000
Aggregated Statistics For Year 2008(Based on 1 full and 2 partial tracts) A) FHA, FSA/RHS & VA B) Conventional C) Refinancings D) Home Improvement Loans F) Non-occupant Loans on Number Average Value Number Average Value Number Average Value Number Average Value Number Average Value
LOANS ORIGINATED 12 $292,061 121 $293,441 183 $244,639 51 $78,522 10 $216,282 APPLICATIONS APPROVED, NOT ACCEPTED 1 $206,420 13 $274,668 32 $220,362 12 $71,775 0 $0 APPLICATIONS DENIED 0 $0 9 $349,697 83 $268,582 22 $149,760 3 $148,587 APPLICATIONS WITHDRAWN 1 $358,720 12 $331,012 42 $292,685 9 $202,033 0 $0 FILES CLOSED FOR INCOMPLETENESS 1 $266,710 1 $228,290 11 $290,108 2 $159,940 0 $0
Aggregated Statistics For Year 2007(Based on 1 full and 2 partial tracts) B) Conventional C) Refinancings D) Home Improvement Loans F) Non-occupant Loans on G) Loans On Manufactured Number Average Value Number Average Value Number Average Value Number Average Value Number Average Value
LOANS ORIGINATED 199 $267,374 237 $225,958 76 $76,091 17 $193,515 0 $0 APPLICATIONS APPROVED, NOT ACCEPTED 27 $225,394 46 $243,616 21 $96,234 1 $154,600 1 $31,000 APPLICATIONS DENIED 24 $236,543 80 $258,973 27 $75,960 4 $101,748 1 $38,000 APPLICATIONS WITHDRAWN 15 $273,672 53 $266,354 7 $168,470 6 $401,623 0 $0 FILES CLOSED FOR INCOMPLETENESS 7 $226,993 28 $316,054 1 $176,250 1 $211,360 0 $0
Aggregated Statistics For Year 2006(Based on 1 full and 2 partial tracts) A) FHA, FSA/RHS & VA B) Conventional C) Refinancings D) Home Improvement Loans F) Non-occupant Loans on Number Average Value Number Average Value Number Average Value Number Average Value Number Average Value
LOANS ORIGINATED 2 $170,195 217 $263,716 268 $206,410 95 $67,887 15 $244,301 APPLICATIONS APPROVED, NOT ACCEPTED 0 $0 21 $320,900 58 $195,874 14 $75,928 4 $304,765 APPLICATIONS DENIED 0 $0 15 $291,037 89 $263,888 31 $71,520 8 $322,348 APPLICATIONS WITHDRAWN 0 $0 22 $258,418 74 $271,555 11 $103,718 2 $104,755 FILES CLOSED FOR INCOMPLETENESS 0 $0 7 $303,453 36 $217,770 2 $48,540 1 $103,090
Aggregated Statistics For Year 2005(Based on 1 full and 2 partial tracts) A) FHA, FSA/RHS & VA B) Conventional C) Refinancings D) Home Improvement Loans F) Non-occupant Loans on G) Loans On Manufactured Number Average Value Number Average Value Number Average Value Number Average Value Number Average Value Number Average Value
LOANS ORIGINATED 1 $448,180 256 $269,841 356 $223,416 96 $86,979 19 $178,843 2 $134,020 APPLICATIONS APPROVED, NOT ACCEPTED 0 $0 21 $271,753 48 $213,170 10 $60,078 1 $337,680 1 $66,000 APPLICATIONS DENIED 0 $0 43 $249,195 88 $220,148 22 $40,673 10 $85,948 4 $33,155 APPLICATIONS WITHDRAWN 0 $0 19 $320,763 72 $197,320 11 $165,569 4 $167,088 0 $0 FILES CLOSED FOR INCOMPLETENESS 0 $0 4 $264,142 49 $260,309 2 $105,430 0 $0 0 $0
Aggregated Statistics For Year 2004(Based on 1 full and 2 partial tracts) A) FHA, FSA/RHS & VA B) Conventional C) Refinancings D) Home Improvement Loans E) Loans on Dwellings For 5+ Families F) Non-occupant Loans on Number Average Value Number Average Value Number Average Value Number Average Value Number Average Value Number Average Value
LOANS ORIGINATED 1 $154,300 227 $249,549 444 $208,032 69 $69,258 1 $66,510 22 $197,143 APPLICATIONS APPROVED, NOT ACCEPTED 0 $0 23 $292,505 69 $192,531 12 $48,123 0 $0 2 $116,590 APPLICATIONS DENIED 0 $0 19 $271,647 102 $208,782 16 $51,561 1 $209,510 11 $121,894 APPLICATIONS WITHDRAWN 0 $0 12 $223,871 75 $226,916 13 $55,558 0 $0 4 $172,495 FILES CLOSED FOR INCOMPLETENESS 0 $0 9 $266,861 53 $241,050 3 $130,467 0 $0 2 $122,000
Aggregated Statistics For Year 2003(Based on 1 full and 2 partial tracts) A) FHA, FSA/RHS & VA B) Conventional C) Refinancings D) Home Improvement Loans E) Loans on Dwellings For 5+ Families F) Non-occupant Loans on Number Average Value Number Average Value Number Average Value Number Average Value Number Average Value Number Average Value
LOANS ORIGINATED 2 $282,230 231 $227,541 1,287 $197,694 74 $57,144 0 $0 32 $149,027 APPLICATIONS APPROVED, NOT ACCEPTED 0 $0 20 $208,314 172 $191,085 28 $71,066 1 $350,000 2 $190,485 APPLICATIONS DENIED 0 $0 16 $196,532 170 $197,289 28 $61,934 0 $0 8 $131,369 APPLICATIONS WITHDRAWN 1 $104,420 18 $216,534 116 $206,255 8 $38,721 0 $0 4 $251,160 FILES CLOSED FOR INCOMPLETENESS 0 $0 5 $233,972 29 $184,993 6 $59,077 0 $0 0 $0
Aggregated Statistics For Year 2002(Based on 1 full and 1 partial tracts) A) FHA, FSA/RHS & VA B) Conventional C) Refinancings D) Home Improvement Loans F) Non-occupant Loans on Number Average Value Number Average Value Number Average Value Number Average Value Number Average Value
LOANS ORIGINATED 1 $109,080 218 $228,161 667 $201,338 44 $44,305 18 $144,293 APPLICATIONS APPROVED, NOT ACCEPTED 2 $116,145 27 $235,662 99 $172,695 14 $41,242 1 $158,000 APPLICATIONS DENIED 1 $177,000 17 $229,878 81 $190,257 12 $23,038 3 $65,543 APPLICATIONS WITHDRAWN 0 $0 10 $251,263 55 $183,618 9 $57,248 0 $0 FILES CLOSED FOR INCOMPLETENESS 0 $0 1 $276,000 30 $202,372 2 $41,570 1 $180,000
Aggregated Statistics For Year 2001(Based on 1 full and 1 partial tracts) A) FHA, FSA/RHS & VA B) Conventional C) Refinancings D) Home Improvement Loans F) Non-occupant Loans on Number Average Value Number Average Value Number Average Value Number Average Value Number Average Value
LOANS ORIGINATED 4 $159,060 233 $213,853 411 $179,862 70 $47,872 10 $164,140 APPLICATIONS APPROVED, NOT ACCEPTED 0 $0 23 $192,457 46 $158,498 13 $24,665 2 $182,500 APPLICATIONS DENIED 1 $270,030 13 $126,220 62 $155,792 20 $36,848 10 $154,600 APPLICATIONS WITHDRAWN 0 $0 22 $247,552 60 $155,142 12 $44,243 7 $128,714 FILES CLOSED FOR INCOMPLETENESS 0 $0 2 $362,000 6 $277,212 2 $26,000 0 $0
Aggregated Statistics For Year 2000(Based on 1 full and 1 partial tracts) A) FHA, FSA/RHS & VA B) Conventional C) Refinancings D) Home Improvement Loans F) Non-occupant Loans on Number Average Value Number Average Value Number Average Value Number Average Value Number Average Value
LOANS ORIGINATED 1 $65,000 238 $198,489 94 $136,445 48 $45,817 8 $80,601 APPLICATIONS APPROVED, NOT ACCEPTED 0 $0 23 $239,079 23 $82,575 9 $32,093 2 $51,000 APPLICATIONS DENIED 1 $99,000 18 $223,159 39 $139,127 20 $32,730 1 $3,000 APPLICATIONS WITHDRAWN 1 $143,000 15 $228,343 32 $126,338 3 $49,297 3 $189,667 FILES CLOSED FOR INCOMPLETENESS 1 $86,460 6 $203,577 8 $114,369 2 $26,630 1 $165,000
Aggregated Statistics For Year 1999(Based on 1 full and 2 partial tracts) A) FHA, FSA/RHS & VA B) Conventional C) Refinancings D) Home Improvement Loans F) Non-occupant Loans on Number Average Value Number Average Value Number Average Value Number Average Value Number Average Value
LOANS ORIGINATED 3 $127,047 311 $175,355 244 $142,370 62 $31,231 12 $95,520 APPLICATIONS APPROVED, NOT ACCEPTED 1 $197,700 30 $164,058 26 $112,638 10 $41,227 1 $67,540 APPLICATIONS DENIED 1 $112,340 19 $155,832 54 $135,896 15 $29,658 1 $131,470 APPLICATIONS WITHDRAWN 0 $0 21 $167,830 58 $159,162 5 $37,412 1 $317,010 FILES CLOSED FOR INCOMPLETENESS 0 $0 4 $188,848 16 $134,385 0 $0 0 $0
Detailed HMDA statistics for the following Tracts:
0135.01
, 0135.03 , 0136.12
Private Mortgage Insurance Companies Aggregated Statistics For Year 2009(Based on 1 full and 2 partial tracts) A) Conventional B) Refinancings Number Average Value Number Average Value
LOANS ORIGINATED 16 $299,101 8 $314,471 APPLICATIONS APPROVED, NOT ACCEPTED 3 $344,920 3 $383,317 APPLICATIONS DENIED 1 $459,550 2 $302,930 APPLICATIONS WITHDRAWN 3 $355,790 0 $0 FILES CLOSED FOR INCOMPLETENESS 1 $379,000 0 $0
Aggregated Statistics For Year 2008(Based on 1 full and 2 partial tracts) A) Conventional B) Refinancings C) Non-occupant Loans on Number Average Value Number Average Value Number Average Value
LOANS ORIGINATED 28 $328,659 5 $354,562 0 $0 APPLICATIONS APPROVED, NOT ACCEPTED 6 $289,555 7 $308,296 0 $0 APPLICATIONS DENIED 2 $342,580 1 $174,260 2 $277,295 APPLICATIONS WITHDRAWN 1 $285,000 0 $0 0 $0 FILES CLOSED FOR INCOMPLETENESS 2 $242,820 0 $0 0 $0
Aggregated Statistics For Year 2007(Based on 1 full and 2 partial tracts) A) Conventional B) Refinancings C) Non-occupant Loans on Number Average Value Number Average Value Number Average Value
LOANS ORIGINATED 21 $324,645 8 $352,162 1 $270,000 APPLICATIONS APPROVED, NOT ACCEPTED 1 $378,290 4 $443,625 0 $0 APPLICATIONS DENIED 0 $0 0 $0 0 $0 APPLICATIONS WITHDRAWN 0 $0 0 $0 0 $0 FILES CLOSED FOR INCOMPLETENESS 0 $0 0 $0 0 $0
Aggregated Statistics For Year 2006(Based on 1 full and 2 partial tracts) A) Conventional B) Refinancings C) Non-occupant Loans on Number Average Value Number Average Value Number Average Value
LOANS ORIGINATED 19 $274,066 4 $273,252 4 $198,478 APPLICATIONS APPROVED, NOT ACCEPTED 3 $288,590 3 $248,430 1 $218,000 APPLICATIONS DENIED 0 $0 0 $0 0 $0 APPLICATIONS WITHDRAWN 0 $0 1 $164,700 0 $0 FILES CLOSED FOR INCOMPLETENESS 0 $0 0 $0 0 $0
Aggregated Statistics For Year 2005(Based on 1 full and 2 partial tracts) A) Conventional B) Refinancings C) Non-occupant Loans on Number Average Value Number Average Value Number Average Value
LOANS ORIGINATED 14 $281,836 7 $292,157 2 $220,775 APPLICATIONS APPROVED, NOT ACCEPTED 4 $233,895 1 $207,530 0 $0 APPLICATIONS DENIED 0 $0 0 $0 0 $0 APPLICATIONS WITHDRAWN 0 $0 1 $346,000 0 $0 FILES CLOSED FOR INCOMPLETENESS 0 $0 0 $0 0 $0
Aggregated Statistics For Year 2004(Based on 1 full and 2 partial tracts) A) Conventional B) Refinancings C) Non-occupant Loans on Number Average Value Number Average Value Number Average Value
LOANS ORIGINATED 16 $250,100 8 $236,515 2 $209,265 APPLICATIONS APPROVED, NOT ACCEPTED 4 $216,208 4 $210,115 0 $0 APPLICATIONS DENIED 0 $0 0 $0 0 $0 APPLICATIONS WITHDRAWN 0 $0 0 $0 0 $0 FILES CLOSED FOR INCOMPLETENESS 0 $0 0 $0 0 $0
Aggregated Statistics For Year 2003(Based on 1 full and 2 partial tracts) A) Conventional B) Refinancings C) Non-occupant Loans on Number Average Value Number Average Value Number Average Value
LOANS ORIGINATED 35 $235,779 32 $233,561 1 $238,480 APPLICATIONS APPROVED, NOT ACCEPTED 8 $225,114 12 $250,601 0 $0 APPLICATIONS DENIED 1 $316,460 1 $194,000 1 $194,000 APPLICATIONS WITHDRAWN 3 $336,857 4 $188,730 0 $0 FILES CLOSED FOR INCOMPLETENESS 0 $0 0 $0 0 $0
Aggregated Statistics For Year 2002(Based on 1 full and 1 partial tracts) A) Conventional B) Refinancings C) Non-occupant Loans on Number Average Value Number Average Value Number Average Value
LOANS ORIGINATED 35 $241,571 20 $220,622 1 $58,530 APPLICATIONS APPROVED, NOT ACCEPTED 4 $231,862 12 $203,130 1 $158,000 APPLICATIONS DENIED 1 $75,820 0 $0 0 $0 APPLICATIONS WITHDRAWN 2 $271,655 3 $177,893 1 $47,890 FILES CLOSED FOR INCOMPLETENESS 1 $63,180 0 $0 0 $0
Aggregated Statistics For Year 2001(Based on 1 full and 1 partial tracts) A) Conventional B) Refinancings C) Non-occupant Loans on Number Average Value Number Average Value Number Average Value
LOANS ORIGINATED 35 $212,413 25 $198,593 1 $141,000 APPLICATIONS APPROVED, NOT ACCEPTED 2 $199,000 6 $235,667 0 $0 APPLICATIONS DENIED 0 $0 0 $0 0 $0 APPLICATIONS WITHDRAWN 0 $0 1 $146,990 0 $0 FILES CLOSED FOR INCOMPLETENESS 0 $0 0 $0 0 $0
Aggregated Statistics For Year 2000(Based on 1 full and 1 partial tracts) A) Conventional B) Refinancings C) Non-occupant Loans on Number Average Value Number Average Value Number Average Value
LOANS ORIGINATED 47 $201,902 1 $178,250 1 $158,000 APPLICATIONS APPROVED, NOT ACCEPTED 5 $238,800 4 $190,465 0 $0 APPLICATIONS DENIED 0 $0 1 $158,290 0 $0 APPLICATIONS WITHDRAWN 1 $157,630 0 $0 0 $0 FILES CLOSED FOR INCOMPLETENESS 0 $0 0 $0 0 $0
Aggregated Statistics For Year 1999(Based on 1 full and 2 partial tracts) A) Conventional B) Refinancings C) Non-occupant Loans on Number Average Value Number Average Value Number Average Value
LOANS ORIGINATED 76 $187,052 27 $165,699 1 $103,280 APPLICATIONS APPROVED, NOT ACCEPTED 11 $237,964 6 $149,062 1 $103,280 APPLICATIONS DENIED 1 $231,150 2 $176,180 0 $0 APPLICATIONS WITHDRAWN 1 $163,940 0 $0 0 $0 FILES CLOSED FOR INCOMPLETENESS 1 $292,100 0 $0 0 $0
Detailed PMIC statistics for the following Tracts:
0135.01
, 0135.03 , 0136.12
Most common first names in Hockessin, DE among deceased individuals Name Count Lived (average)
Mary 97 83.9 years John 86 78.2 years Elizabeth 59 86.1 years William 58 77.2 years Margaret 54 84.8 years Helen 47 84.3 years Dorothy 45 84.5 years James 41 77.8 years Robert 40 79.0 years Charles 34 76.7 years
Most common last names in Hockessin, DE among deceased individuals Last name Count Lived (average)
Smith 22 78.2 years Miller 15 78.1 years Taylor 15 84.9 years Johnson 15 83.0 years Brown 14 82.4 years Ford 11 82.2 years Malin 11 81.7 years Thompson 10 77.7 years Walker 10 83.5 years Jackson 10 75.6 years
Hockessin compared to Delaware state average:
Median household income above state average. Median house value above state average. Unemployed percentage significantly below state average. Black race population percentage significantly below state average. Hispanic race population percentage significantly below state average. Renting percentage significantly below state average. Length of stay since moving in significantly above state average. Number of rooms per house significantly above state average. Percentage of population with a bachelor's degree or higher significantly above state average.
#17 on the list of "Top 101 cities with the largest percentage of elementary and middle school students in private schools (1,000+ students)"
#31 on the list of "Top 101 cities with the most residents born in United Kingdom (population 500+)"
#31 on the list of "Top 101 cities with the most residents born in Yugoslavia (population 500+)"
#31 on the list of "Top 101 cities with the most residents born in Asia, n.e.c. (population 500+)"
#31 on the list of "Top 101 cities with the most residents born in Melanesia (population 500+)"
#31 on the list of "Top 101 cities with the most residents born in Micronesia (population 500+)"
#31 on the list of "Top 101 cities with the most residents born in Polynesia (population 500+)"
#46 on the list of "Top 101 cities with the largest percentage of high school students in private schools (500+ students)"
#51 on the list of "Top 101 cities with largest percentage of females in occupations: legal occupations (population 5,000+)"
#53 on the list of "Top 101 cities with the most residents born in Other South Eastern Asia (population 500+)"
#55 on the list of "Top 101 cities with the most residents born in Malaysia (population 500+)"
#59 on the list of "Top 101 cities with the most residents born in Born at sea (population 500+)"
#62 on the list of "Top 101 cities with largest percentage of females in occupations: management occupations (population 5,000+)"
#78 on the list of "Top 100 cities with biggest houses"
#17 on the list of "Top 101 counties with the highest number of infant deaths per 1000 residents 2007-2013 (pop. 50,000+)"
#35 on the list of "Top 101 counties with the highest percentage of residents that visited a dentist within the past year"
#51 on the list of "Top 101 counties with the highest carbon monoxide air pollution readings in 2012 (ppm)"
#53 on the list of "Top 101 counties with the highest average weight of females"
#55 on the list of "Top 101 counties with the highest Nitrogen Dioxide air pollution readings in 2012 (ppm)"
Top Patent Applicants
Hari Babu Sunkara (71)
Howard Glenn Damude (64)
Zhe Wang (46)
Zhongsen Li (41)
Subhash Vishnu Gangal (36)
Kurt Richard Mikeska (35)
Paul Douglas Vernooy (31)
Sheng Peng (29)
Bailin Li (29)
Thomas Paul Selby (28)
Total of 1733 patent applications in 2008-2024.
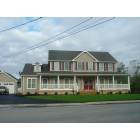
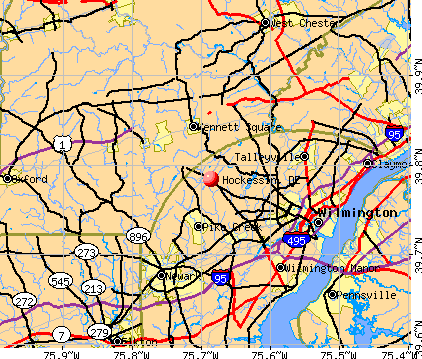


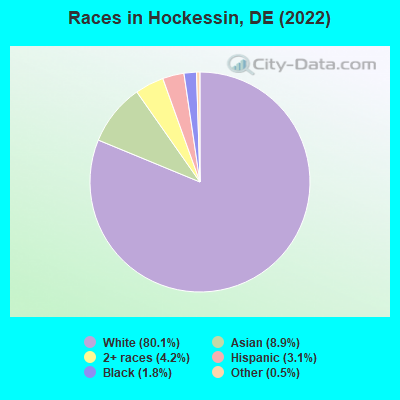
 Recent articles from our blog. Our writers, many of them Ph.D. graduates or candidates, create easy-to-read articles on a wide variety of topics.

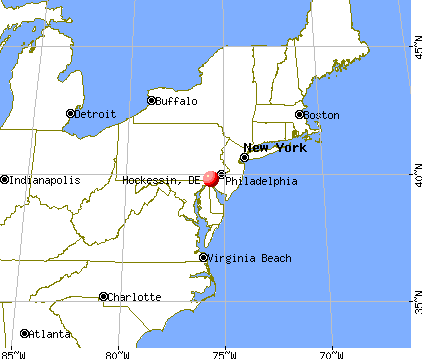
 (7.5 miles
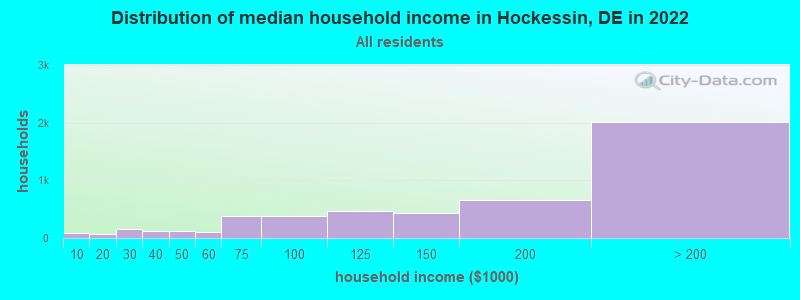
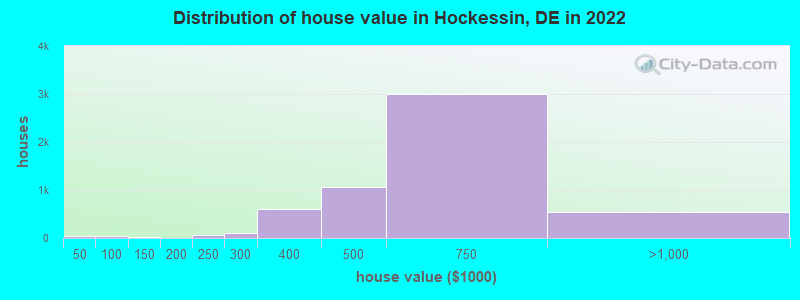
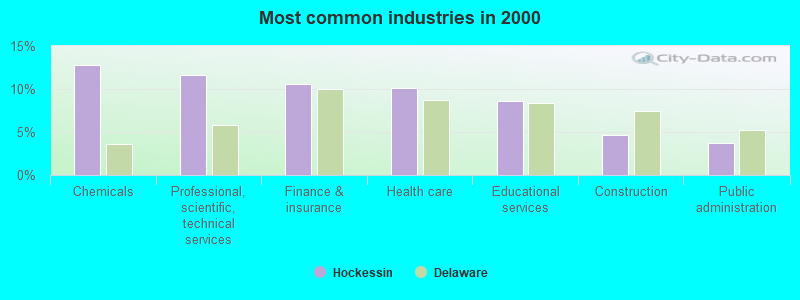
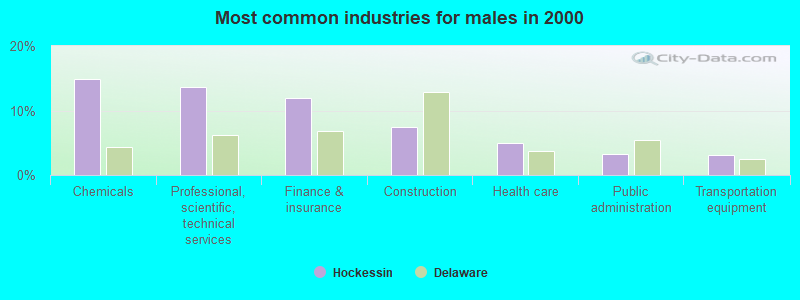
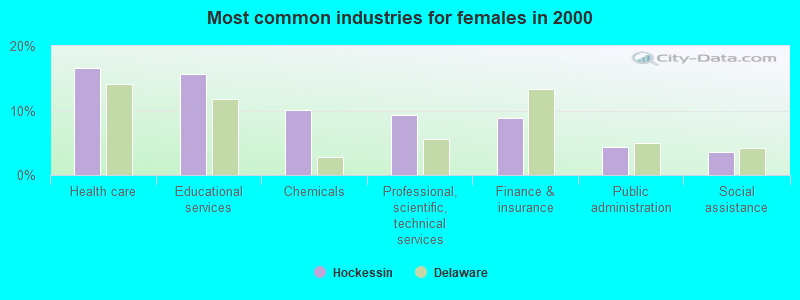
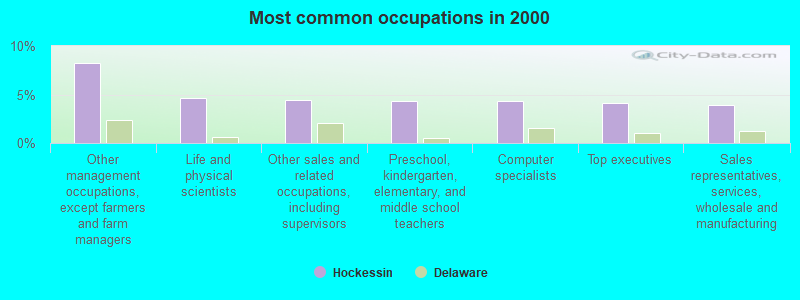
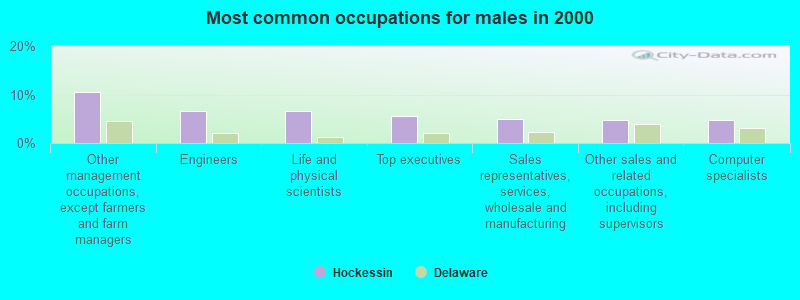
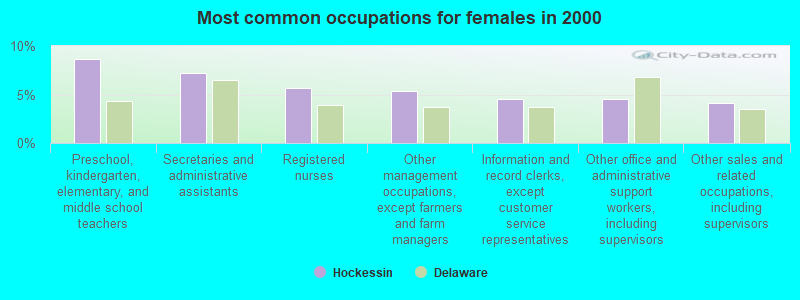
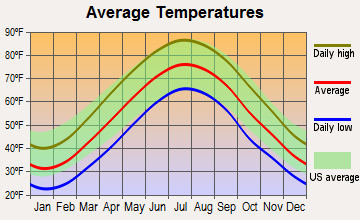
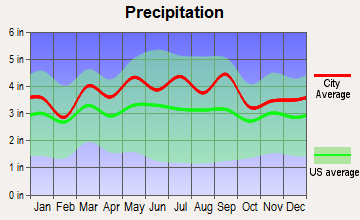
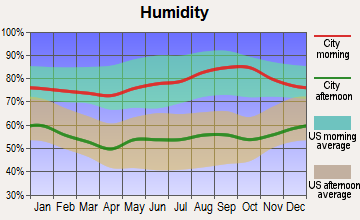
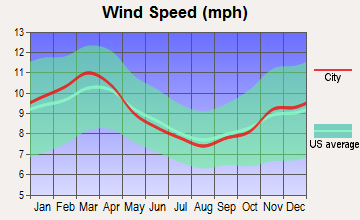
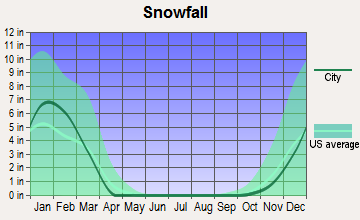
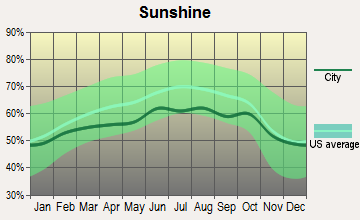
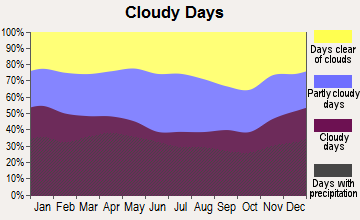
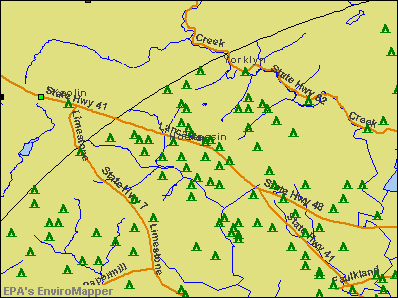

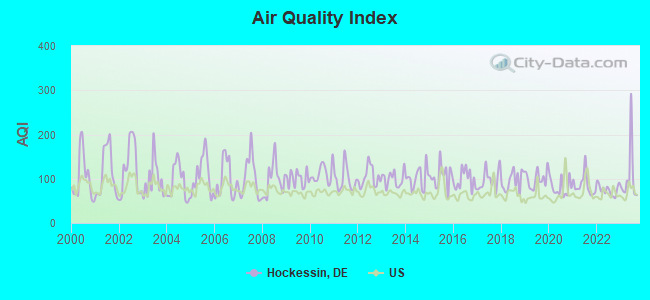
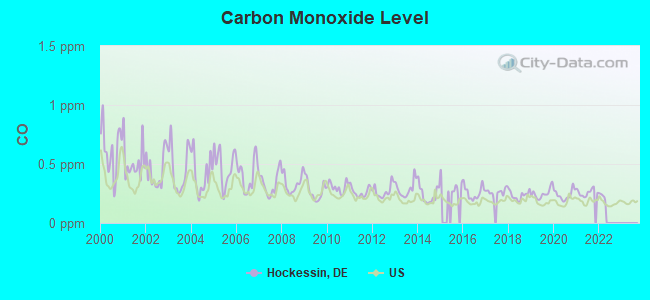
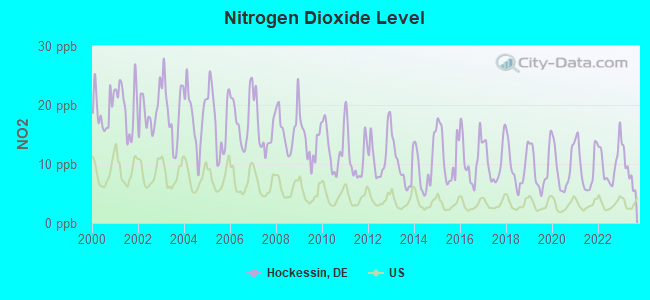
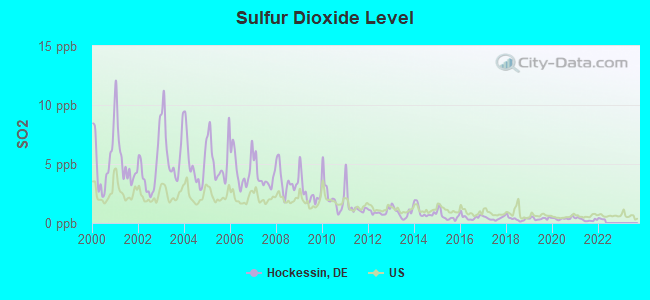
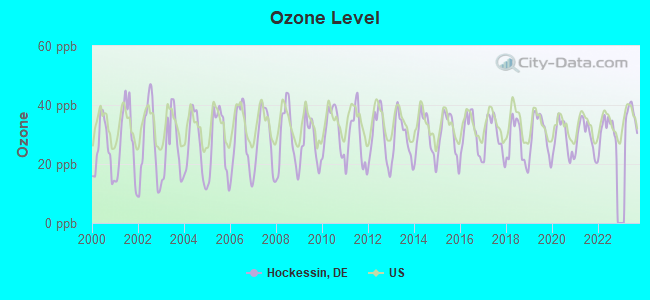
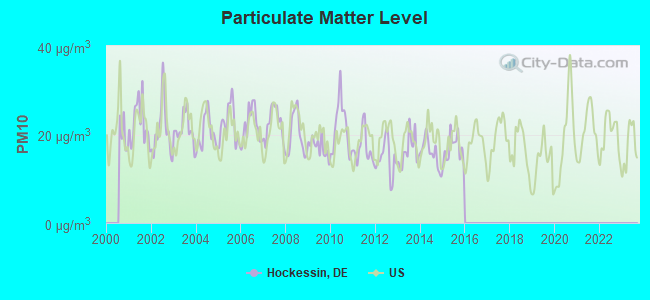
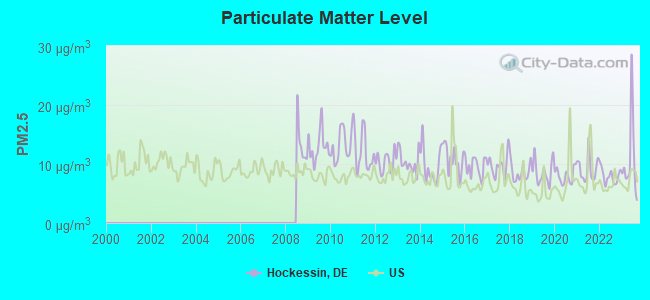
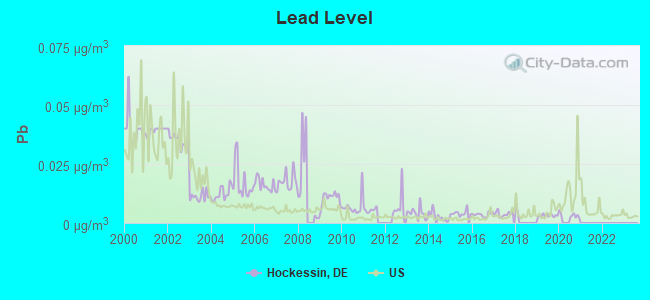
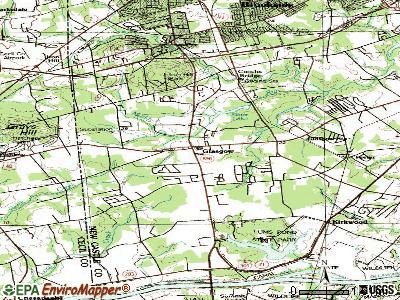
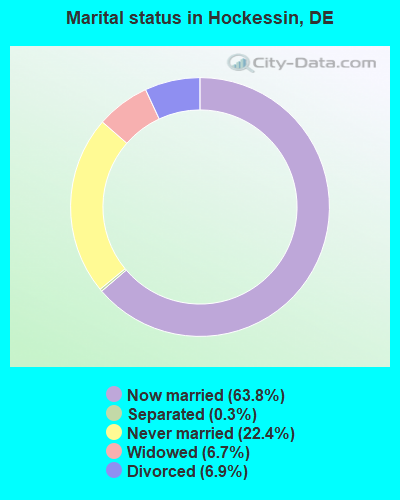
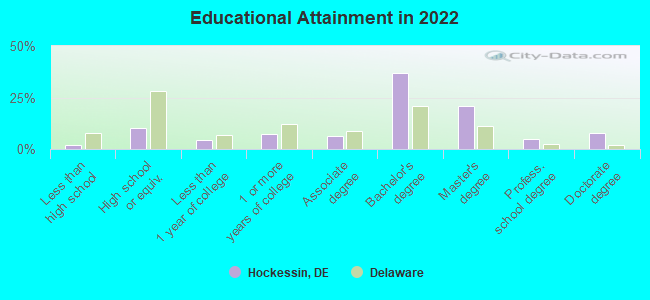
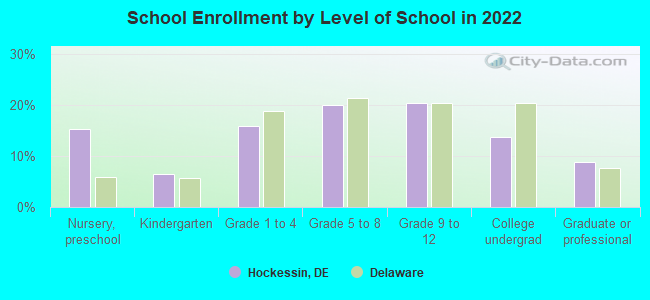
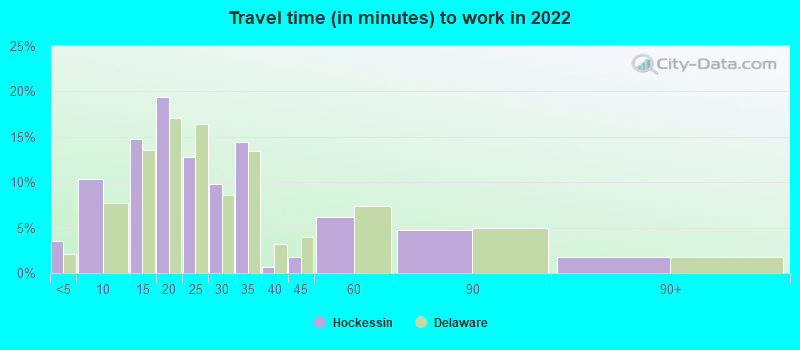
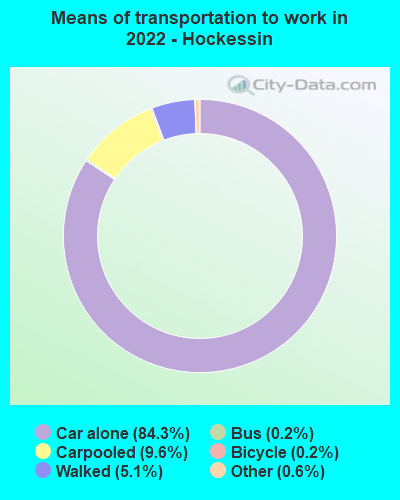
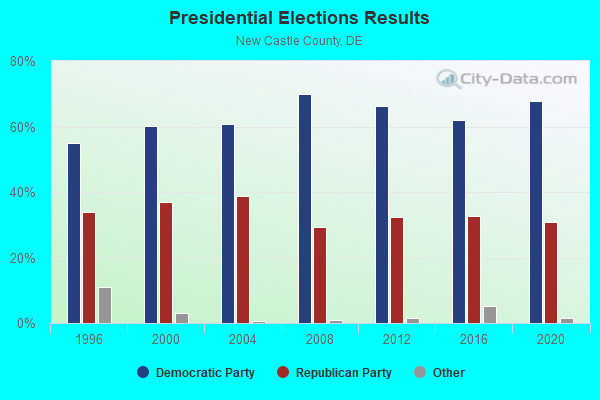
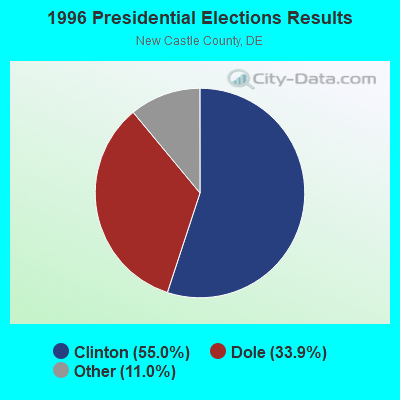
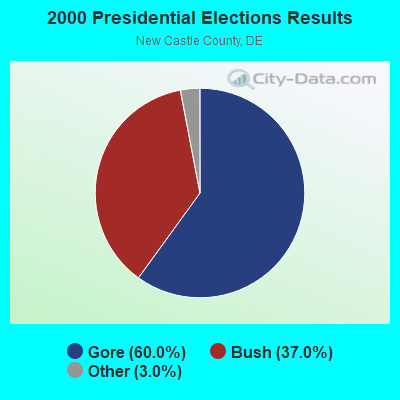
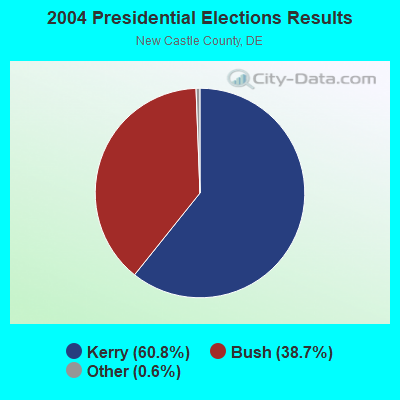
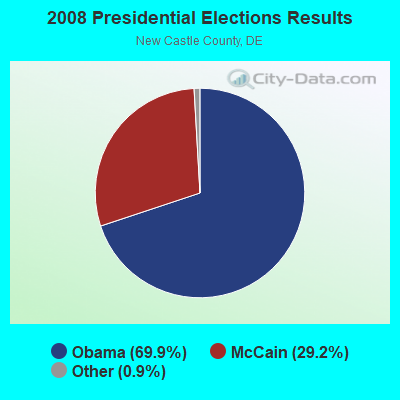
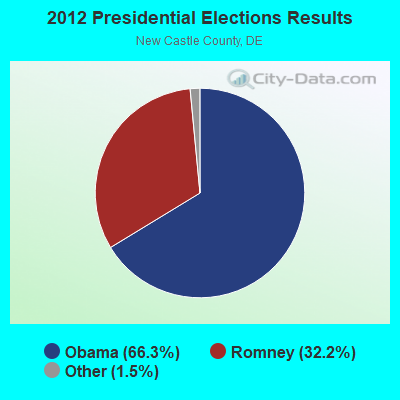
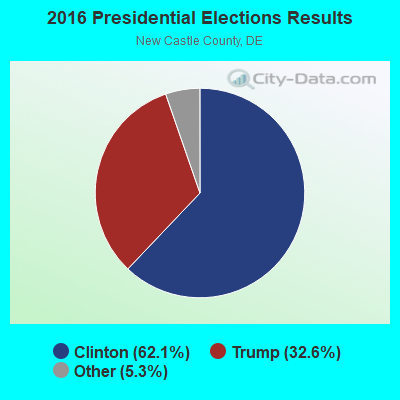
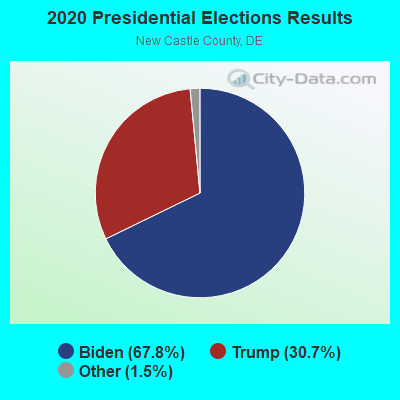
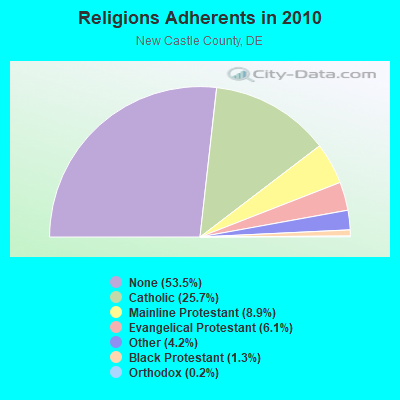
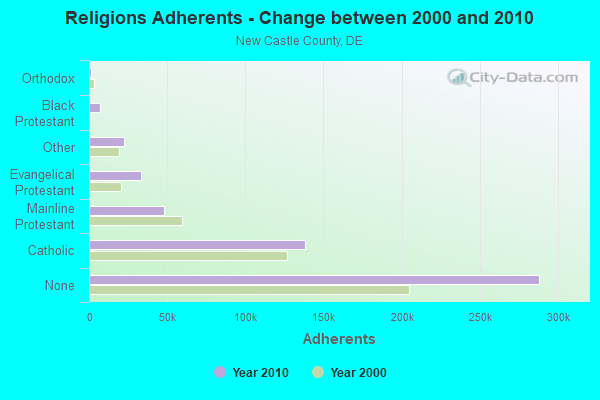
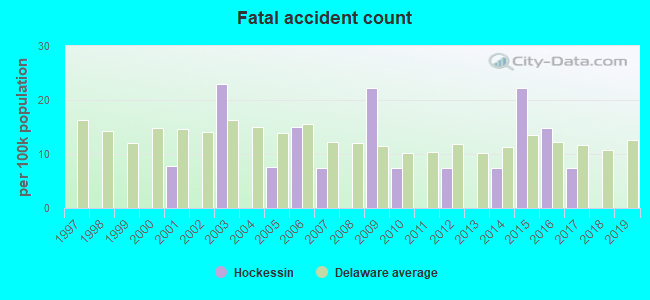
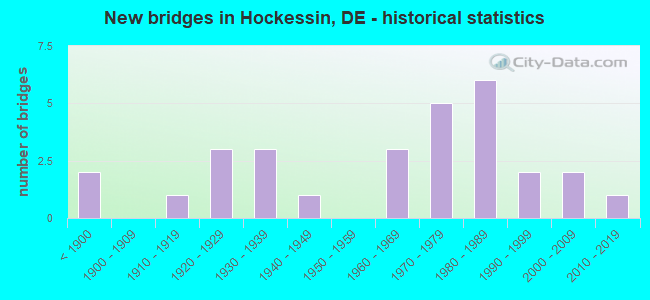
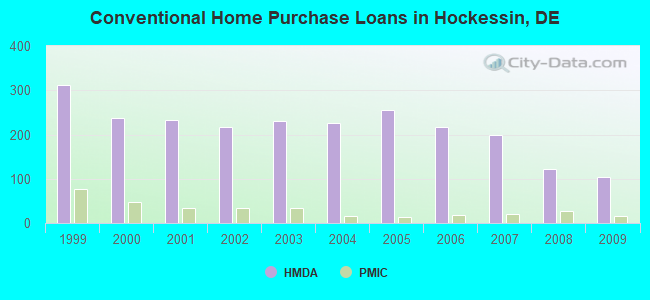
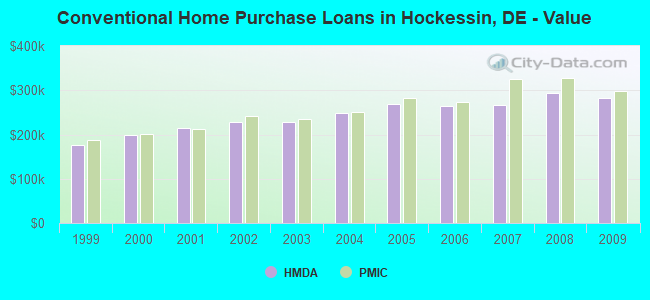
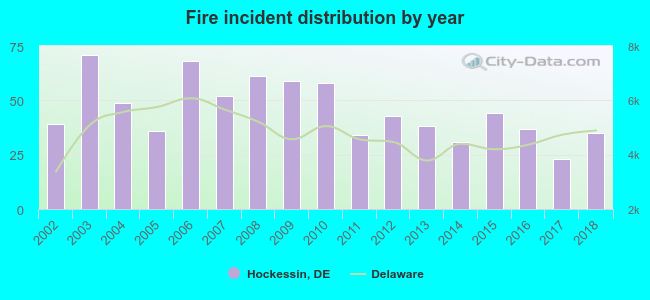 Based on the data from the years 2002 - 2018 the average number of fire incidents per year is 46. The highest number of reported fires - 71 took place in 2003, and the least - 23 in 2017. The data has a declining trend.
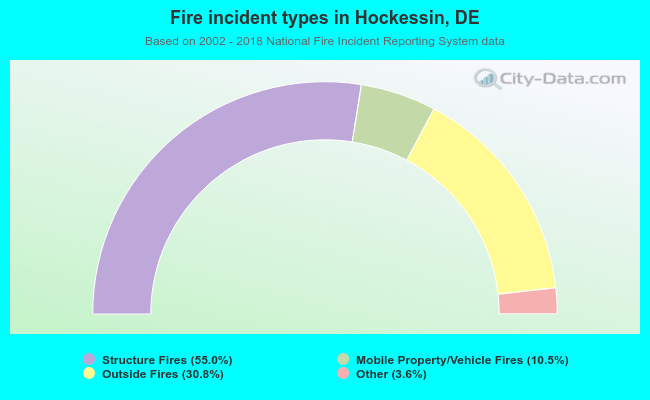 When looking into fire subcategories, the most reports belonged to: Structure Fires (55.0%), and Outside Fires (30.8%).