Jacksonville: Fire Incidents, Texas (TX)
Where are fire incidents reported in Jacksonville, TX
Something went wrong! Please refresh the page.
| Fire incidents reported | |
|---|---|
| Sreet name | Count |
| JACKSON ST | 226 |
| BOLTON ST | 146 |
| US HWY 79 | 94 |
| US HWY 69 | 80 |
| RUSK ST | 78 |
| CANADA ST | 48 |
| PINE ST | 48 |
| FM 747 | 46 |
| US HWY 175 | 44 |
| LOOP 456 | 38 |
| FM 347 | 36 |
| RAGSDALE ST | 36 |
| BYRD RD | 32 |
| MYRTLE DR | 30 |
| CR 4216 | 26 |
| FM 2138 | 26 |
| COLLEGE AVE | 22 |
| PLANTATION DR | 22 |
| STATE HWY 135 | 22 |
| SUNSET AVE | 22 |
| DEBUSK ST | 20 |
| JACKSONVILLE DR | 20 |
| SELMAN ST | 20 |
| TENA ST | 20 |
| ANDREWS ST | 18 |
| CR 4209 | 18 |
| DAVIS ST | 18 |
| ELBERTA ST | 18 |
| MAIN ST | 18 |
| QUEVADO ST | 18 |
| Other | 445 |
2002 - 2016 National Fire Incident Reporting System (NFIRS) incidents
- Incident types reported to NFIRS in Jacksonville, TX
- 2,34327.4%Rescue & EMS
- 2,15025.1%Hazardous Condition
- 1,75520.5%Fire
- 1,25814.7%Service Call
- 5506.4%Good Intent Call
- 4295.0%False Alarm
- 470.5%Special Incident
- 160.2%Overpressure Rupture
- Fire incident types reported to NFIRS in Jacksonville, TX
- 77143.9%Outside Fires
- 62835.8%Structure Fires
- 25414.5%Mobile Property/Vehicle Fires
- 1025.8%Other
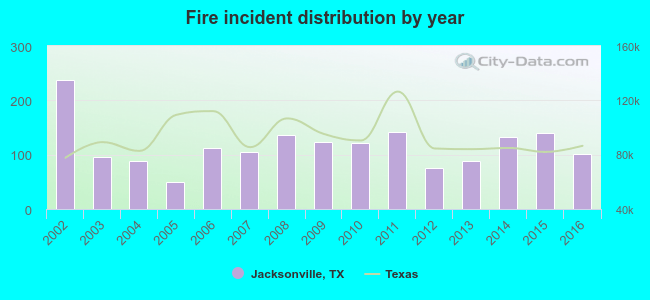 According to the data from the years 2002 - 2016 the average number of fires per year is 116. The highest number of reported fires - 237 took place in 2002, and the least - 49 in 2005. The data has a decreasing trend.
The average number of yearly fire incidents per 10k residents in Jacksonville, TX compared to nearest cities:
(Note: Based on data for the last 3 years, including only cities with population 5,000 and above)
| Jacksonville: | 25.2 |
| Rusk: | 1.8 |
| Whitehouse: | 45.6 |
| Tyler: | 29.8 |
| Palestine: | 65.4 |
| Henderson: | 177.9 |
| Kilgore: | 113.1 |
| Athens: | 166.9 |
| Lindale: | 274.4 |
 The median response time based on all reported fire incidents is 6 minutes. This is about the same as the state median value.
The median response time in Jacksonville, TX compared to nearest cities:
(Note: Based on data for all years, including only cities with at least 500 fire incidents)
| Jacksonville: | 6 minutes |
| Bullard: | 10 minutes |
| Troup: | 10 minutes |
| Frankston: | 10 minutes |
| Arp: | 8 minutes |
| Tyler: | 6 minutes |
| Palestine: | 5 minutes |
| Chandler: | 10 minutes |
| Overton: | 6 minutes |
 According to the data from the years 2002 - 2016 the average number of fire-related yearly deaths is 0. The highest number of reported deaths - 1 took place in 2006, and the lowest - 0 in 2002. The data has a constant trend.
 Based on the reports from the years 2002 - 2016 the average number of fire-related yearly casualties is 1. The highest number of injuries - 3 took place in 2002, and the lowest - 0 in 2003. The data has a declining trend.
The average number of injuries per 1,000 fire incidents is 5. This indicator was the highest - 41 in 2005, and the lowest 0 in 2003. The trend for casualties per 1,000 fire incidents is declining. Compared to the Texas value the number of casualties per 1,000 fire incidents is lower.
Based on the reports from the years 2002 - 2016 the average number of fire-related yearly casualties is 1. The highest number of injuries - 3 took place in 2002, and the lowest - 0 in 2003. The data has a declining trend.
The average number of injuries per 1,000 fire incidents is 5. This indicator was the highest - 41 in 2005, and the lowest 0 in 2003. The trend for casualties per 1,000 fire incidents is declining. Compared to the Texas value the number of casualties per 1,000 fire incidents is lower.
 29.1% incidents where reported in the morning and 70.9% in the evening. The most fires (15.2%) took place on Saturday, and the least (12.7%) on Wednesday.
 According to the 1,755 reports from years 2002 - 2016 most fires (12.3%) took place during August, and the least (6.0%) in November.
 Out of all 8,549 cases reported during the years 2002 - 2016, the most belonged to the categories: Rescue & EMS (27.4%), Hazardous Condition (25.1%), and Fire (20.5%).
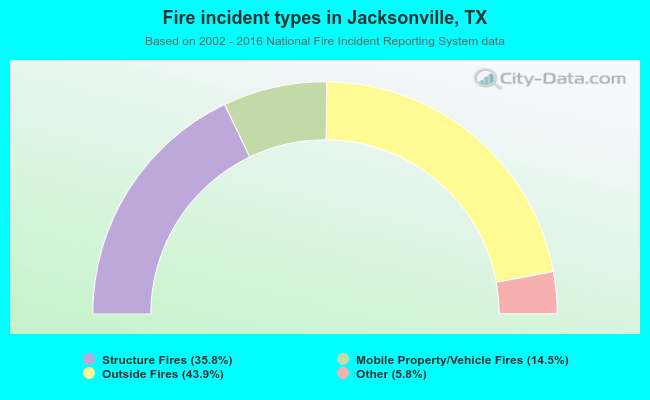 When looking into fire subcategories, the most reports belonged to: Outside Fires (43.9%), and Structure Fires (35.8%).