Tyler: Fire Incidents, Texas (TX)
Where are fire incidents reported in Tyler, TX
Something went wrong! Please refresh the page.
| Fire incidents reported | |
|---|---|
| Sreet name | Count |
| BROADWAY AVE | 562 |
| FM 14 | 334 |
| 2767 FM | 222 |
| SHILOH RD | 208 |
| PALUXY DR | 180 |
| 64 HWY | 176 |
| ERWIN ST | 170 |
| LOOP 323 N NW | 152 |
| 31 HWY | 138 |
| TROUP HWY | 138 |
| COUNTY ROAD 35 | 118 |
| LOOP 323 S SW | 118 |
| BECKHAM AVE | 116 |
| LOOP 323 W NW | 116 |
| OLD OMEN RD | 112 |
| 110 HWY | 110 |
| HWY 271 | 110 |
| 46 CR | 108 |
| GRAND AVE | 106 |
| OLD BULLARD RD | 106 |
| LOOP 323 W SW | 102 |
| 0031 STH | 98 |
| FM 16 | 96 |
| FRONT ST | 92 |
| GRANDE BLVD | 92 |
| LOOP 323 E SE | 92 |
| CONFEDERATE AVE | 90 |
| FM 2015 | 84 |
| 5 ST | 82 |
| HOUSTON ST | 82 |
| Other | 4,991 |
2002 - 2018 National Fire Incident Reporting System (NFIRS) incidents
- Incident types reported to NFIRS in Tyler, TX
- 36,42350.0%Rescue & EMS
- 9,30112.8%Fire
- 9,06812.4%Hazardous Condition
- 7,99011.0%Good Intent Call
- 6,0958.4%Service Call
- 3,5844.9%False Alarm
- 2930.4%Special Incident
- 1180.2%Overpressure Rupture
- Fire incident types reported to NFIRS in Tyler, TX
- 4,01043.1%Outside Fires
- 3,43937.0%Structure Fires
- 1,64117.6%Mobile Property/Vehicle Fires
- 2112.3%Other
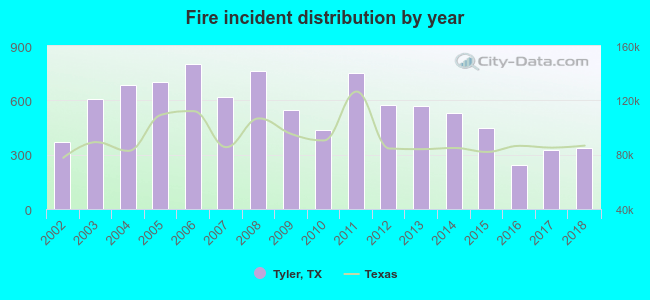 According to the data from the years 2002 - 2018 the average number of fire incidents per year is 547. The highest number of fire incidents - 800 took place in 2006, and the least - 245 in 2016. The data has a declining trend.
The average number of yearly fire incidents per 10k residents in Tyler, TX compared to nearest cities:
(Note: Based on data for the last 3 years, including only cities with population 5,000 and above)
| Tyler: | 29.8 |
| Whitehouse: | 45.6 |
| Lindale: | 274.4 |
| Gladewater: | 86.0 |
| Kilgore: | 113.1 |
| Jacksonville: | 25.2 |
| White Oak: | 55.9 |
| Henderson: | 177.9 |
| Athens: | 166.9 |
 The median response time based on all reported fire incidents is 6 minutes. This is close to the Texas median value.
The median response time in Tyler, TX compared to nearest cities:
(Note: Based on data for all years, including only cities with at least 500 fire incidents)
| Tyler: | 6 minutes |
| Chandler: | 10 minutes |
| Winona: | 15 minutes |
| Bullard: | 10 minutes |
| Lindale: | 11 minutes |
| Arp: | 8 minutes |
| Troup: | 10 minutes |
| Brownsboro: | 9 minutes |
| Hawkins: | 11 minutes |
 Based on the reports from the years 2002 - 2018 the average number of fire-related yearly deaths is 1. The highest number of deaths - 3 took place in 2007, and the lowest - 0 in 2002. The data has a growing trend.
The average number of fatalities per 1,000 fire incidents is 2. This indicator was the highest - 5 in 2007, and the lowest 0 in 2002. The trend for fatalities per 1,000 fires is growing. Compared to the state value the number of fatalities per 1,000 incidents is similar.
Based on the reports from the years 2002 - 2018 the average number of fire-related yearly deaths is 1. The highest number of deaths - 3 took place in 2007, and the lowest - 0 in 2002. The data has a growing trend.
The average number of fatalities per 1,000 fire incidents is 2. This indicator was the highest - 5 in 2007, and the lowest 0 in 2002. The trend for fatalities per 1,000 fires is growing. Compared to the state value the number of fatalities per 1,000 incidents is similar.
 According to the data from the years 2002 - 2018 the average number of fire-related yearly casualties is 5. The highest number of casualties - 11 took place in 2013, and the lowest - 2 in 2002. The data has a constant trend.
The average number of injuries per 1,000 fire incidents is 9. This indicator was the highest - 20 in 2016, and the lowest 3 in 2006. The trend for casualties per 1,000 fire incidents is increasing. Compared to the Texas value the number of casualties per 1,000 fires is about the same.
According to the data from the years 2002 - 2018 the average number of fire-related yearly casualties is 5. The highest number of casualties - 11 took place in 2013, and the lowest - 2 in 2002. The data has a constant trend.
The average number of injuries per 1,000 fire incidents is 9. This indicator was the highest - 20 in 2016, and the lowest 3 in 2006. The trend for casualties per 1,000 fire incidents is increasing. Compared to the Texas value the number of casualties per 1,000 fires is about the same.
 30.0% incidents where reported in the morning and 70.0% in the evening. The most fires (14.7%) took place on Friday, and the least (13.6%) on Thursday.
 Based on the 9,301 fires from years 2002 - 2018 most fires (10.1%) took place during January, and the least (6.8%) in May.
 Out of all 72,917 cases reported during the years 2002 - 2018, the most belonged to the categories: Rescue & EMS (50.0%), Fire (12.8%), and Hazardous Condition (12.4%).
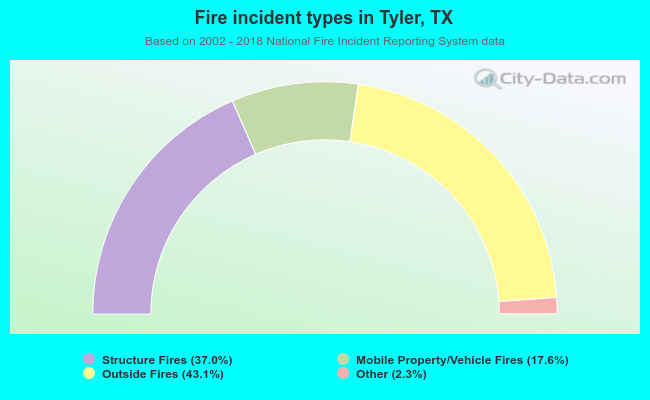 When looking into fire subcategories, the most incidents belonged to: Outside Fires (43.1%), and Structure Fires (37.0%).