Jenison: Fire Incidents, Michigan (MI)
Where are fire incidents reported in Jenison, MI
Something went wrong! Please refresh the page.
|
| |||||||||||||||||||||||||||||||||||||||||||||||||||||||||||||||||||||||||||||||||||||||||||||||||||||||||||||
2002 - 2018 National Fire Incident Reporting System (NFIRS) incidents
- Incident types reported to NFIRS in Jenison, MI
- 95730.7%Hazardous Condition
- 53617.2%Rescue & EMS
- 46915.0%Fire
- 45314.5%Service Call
- 41213.2%False Alarm
- 2598.3%Good Intent Call
- 160.5%Severe Weather
- 150.5%Overpressure Rupture
- Fire incident types reported to NFIRS in Jenison, MI
- 24351.8%Structure Fires
- 11524.5%Outside Fires
- 8217.5%Mobile Property/Vehicle Fires
- 296.2%Other
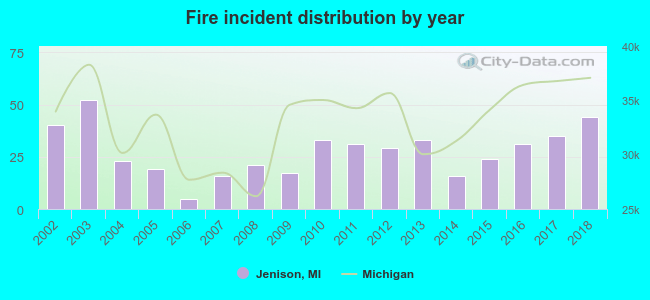 Based on the data from the years 2002 - 2018 the average number of fires per year is 28. The highest number of reported fire incidents - 52 took place in 2003, and the least - 5 in 2006. The data has a growing trend.
The average number of yearly fire incidents per 10k residents in Jenison, MI compared to nearest cities:
(Note: Based on data for the last 3 years, including only cities with population 5,000 and above)
| Jenison: | 22.2 |
| Hudsonville: | 68.7 |
| Grandville: | 32.4 |
| Wyoming: | 27.7 |
| Allendale: | 24.8 |
| Walker: | 31.9 |
| Byron Center: | 108.8 |
| Grand Rapids: | 42.6 |
| Cutlerville: | 4.9 |

 Based on the data from the years 2002 - 2018 the average number of fire-related casualties per year is 0. The highest number of casualties - 1 took place in 2011, and the lowest - 0 in 2002. The data has a constant trend.
 26.0% incidents where reported in the morning and 74.0% in the evening. The most fires (16.8%) took place on Wednesday, and the least (11.5%) on Thursday.
 According to the 469 fire incident reports from years 2002 - 2018 most fires (15.1%) took place during July, and the least (4.3%) in February.
 Out of all 3,118 cases reported during the years 2002 - 2018, the most belonged to the categories: Hazardous Condition (30.7%), Rescue & EMS (17.2%), and Fire (15.0%).
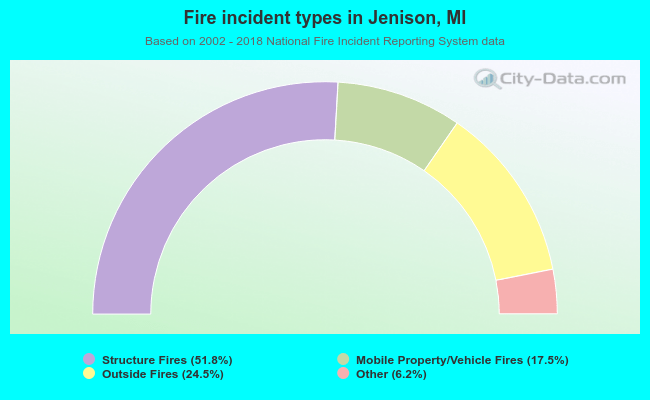 When looking into fire subcategories, the most incidents belonged to: Structure Fires (51.8%), and Outside Fires (24.5%).