Wyoming: Fire Incidents, Michigan (MI)
Where are fire incidents reported in Wyoming, MI
Something went wrong! Please refresh the page.
| Fire incidents reported | |
|---|---|
| Sreet name | Count |
| 28TH ST | 260 |
| 36TH ST | 222 |
| CLYDE PARK AVE | 220 |
| 44TH ST | 200 |
| DIVISION AVE | 196 |
| BYRON CENTER AVE | 176 |
| CHICAGO DR | 132 |
| BURLINGAME AVE | 130 |
| 54TH ST | 76 |
| 32ND ST | 74 |
| CLAY AVE | 70 |
| WOODWARD AVE | 68 |
| TAFT AVE | 66 |
| BURTON ST | 62 |
| PORTER ST | 62 |
| US131 EXPY | 62 |
| MADISON AVE | 60 |
| 56TH ST | 52 |
| EASTERN AVE | 52 |
| CROOKED TREE RD | 50 |
| RATHBONE ST | 50 |
| JEFFERSON AVE | 46 |
| 52ND ST | 42 |
| MICHAEL AVE | 42 |
| WILSON AVE | 42 |
| GODFREY AVE | 40 |
| BUCHANAN AVE | 38 |
| LEE ST | 36 |
| VILLAGE DR | 36 |
| 30TH ST | 34 |
| Other | 205 |
2002 - 2018 National Fire Incident Reporting System (NFIRS) incidents
- Incident types reported to NFIRS in Wyoming, MI
- 21,61459.5%Rescue & EMS
- 3,93610.8%Hazardous Condition
- 3,65810.1%Good Intent Call
- 2,9018.0%Fire
- 2,4416.7%Service Call
- 1,6884.6%False Alarm
- 630.2%Severe Weather
- Fire incident types reported to NFIRS in Wyoming, MI
- 1,33546.0%Structure Fires
- 75326.0%Mobile Property/Vehicle Fires
- 70724.4%Outside Fires
- 1063.7%Other
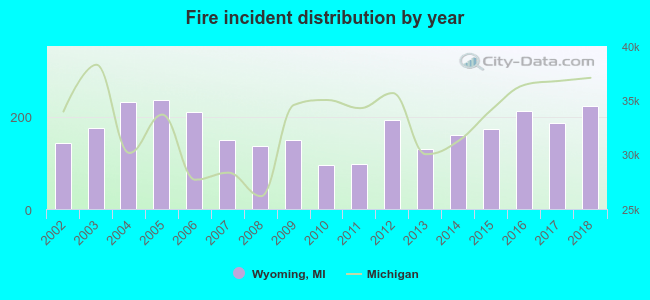 Based on the data from the years 2002 - 2018 the average number of fire incidents per year is 171. The highest number of reported fire incidents - 235 took place in 2005, and the least - 96 in 2010. The data has an increasing trend.
The average number of yearly fire incidents per 10k residents in Wyoming, MI compared to nearest cities:
(Note: Based on data for the last 3 years, including only cities with population 5,000 and above)
| Wyoming: | 27.7 |
| Grandville: | 32.4 |
| Cutlerville: | 4.9 |
| Grand Rapids: | 42.6 |
| Kentwood: | 22.3 |
| East Grand Rapids: | 6.8 |
| Byron Center: | 108.8 |
| Jenison: | 22.2 |
| Walker: | 31.9 |
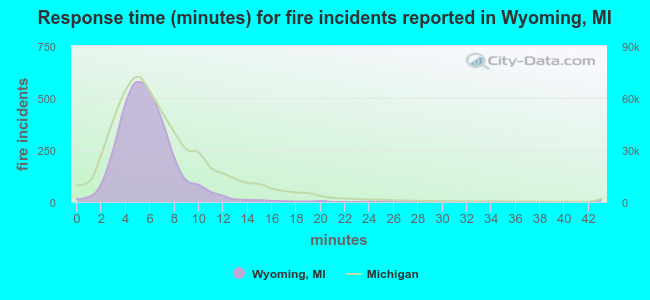 The median response time based on all reported fire incidents is 6 minutes. This is about the same as the state median value.
The median response time in Wyoming, MI compared to nearest cities:
(Note: Based on data for all years, including only cities with at least 500 fire incidents)
| Wyoming: | 6 minutes |
| Grandville: | 4 minutes |
| Grand Rapids: | 5 minutes |
| Kentwood: | 5 minutes |
| Byron Center: | 8 minutes |
| Walker: | 9 minutes |
| Hudsonville: | 6 minutes |
| Comstock Park: | 7 minutes |
| Caledonia: | 8 minutes |
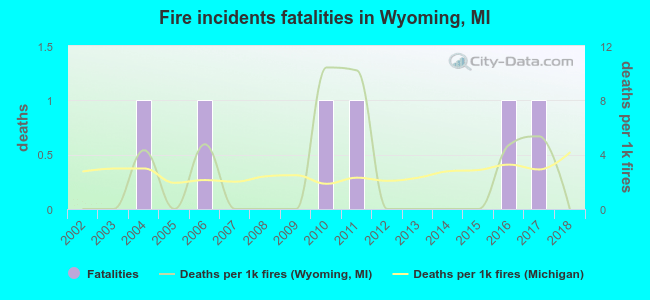 According to the data from the years 2002 - 2018 the average number of fire-related fatalities per year is 0. The highest number of deaths - 1 took place in 2004, and the lowest - 0 in 2002. The data has a constant trend.
The average number of fatalities per 1,000 fire incidents is 2. This indicator was the highest - 10 in 2010, and the lowest 0 in 2002. The trend for fatalities per 1,000 incidents is constant. Compared to the Michigan value the number of fatalities per 1,000 fires is lower.
According to the data from the years 2002 - 2018 the average number of fire-related fatalities per year is 0. The highest number of deaths - 1 took place in 2004, and the lowest - 0 in 2002. The data has a constant trend.
The average number of fatalities per 1,000 fire incidents is 2. This indicator was the highest - 10 in 2010, and the lowest 0 in 2002. The trend for fatalities per 1,000 incidents is constant. Compared to the Michigan value the number of fatalities per 1,000 fires is lower.Deaths per 1,000 incidents in Wyoming, MI compared to nearest cities:
(Note: Based on data for all years, including only cities with at least 2,500 fire incidents)
| Wyoming: | 2.1 |
| Grand Rapids: | 2.1 |
| Holland: | 2.5 |
| Muskegon: | 1.5 |
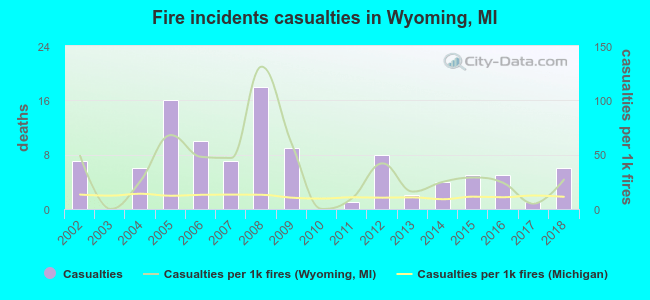 According to the reports from the years 2002 - 2018 the average number of fire-related yearly casualties is 6. The highest number of reported casualties - 18 took place in 2008, and the lowest - 0 in 2003. The data has a declining trend.
The average number of casualties per 1,000 fire incidents is 36. This indicator was the highest - 131 in 2008, and the lowest 0 in 2003. The trend for injuries per 1,000 fires is dropping. Compared to the Michigan value the number of injuries per 1,000 fires is much higher.
According to the reports from the years 2002 - 2018 the average number of fire-related yearly casualties is 6. The highest number of reported casualties - 18 took place in 2008, and the lowest - 0 in 2003. The data has a declining trend.
The average number of casualties per 1,000 fire incidents is 36. This indicator was the highest - 131 in 2008, and the lowest 0 in 2003. The trend for injuries per 1,000 fires is dropping. Compared to the Michigan value the number of injuries per 1,000 fires is much higher.Casualties per 1,000 incidents in Wyoming, MI compared to nearest cities:
(Note: Based on data for all years, including only cities with at least 500 fire incidents)
| Wyoming: | 36.2 |
| Grandville: | 28.7 |
| Grand Rapids: | 15.0 |
| Kentwood: | 34.5 |
| Byron Center: | 0.0 |
| Walker: | 8.7 |
| Hudsonville: | 4.7 |
| Comstock Park: | 15.0 |
| Caledonia: | 7.0 |
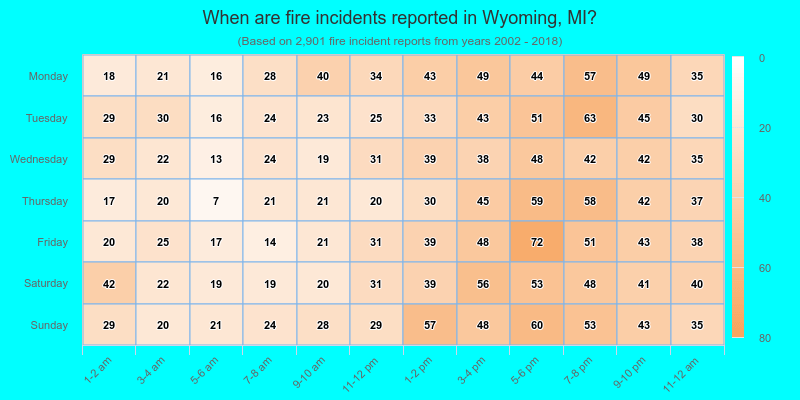
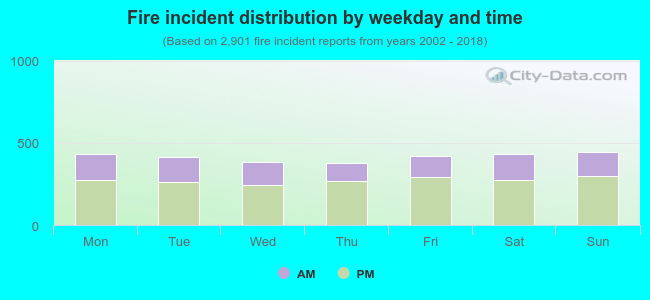 33.8% incidents where reported in the morning and 66.2% in the evening. The most fires (15.4%) took place on Sunday, and the least (13.0%) on Thursday.
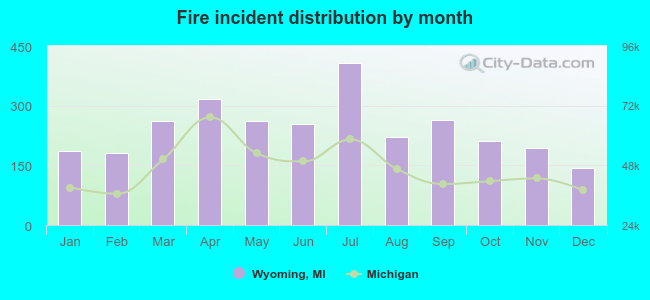 Based on the 2,901 incident reports from years 2002 - 2018 most fires (14.0%) took place during July, and the least (4.9%) in December.
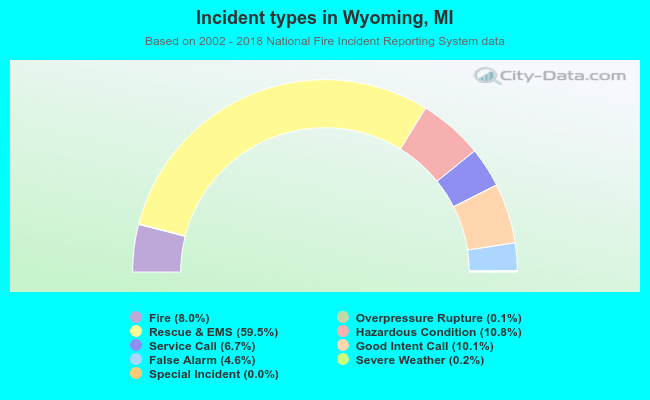 Out of all 36,340 cases reported during the years 2002 - 2018, the most belonged to the categories: Rescue & EMS (59.5%), Hazardous Condition (10.8%), and Good Intent Call (10.1%).
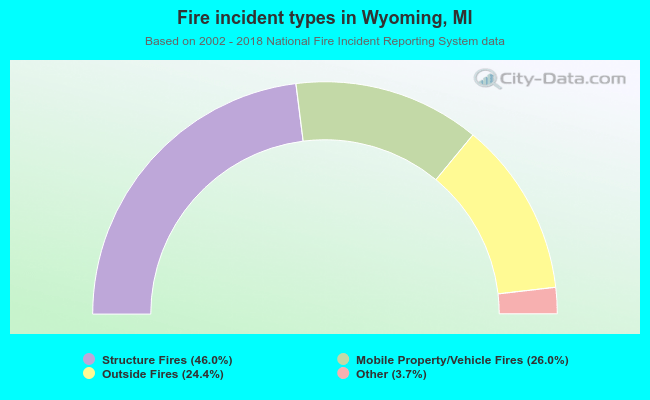 When looking into fire subcategories, the most reports belonged to: Structure Fires (46.0%), and Mobile Property/Vehicle Fires (26.0%).