Monroe: Fire Incidents, Michigan (MI)
Where are fire incidents reported in Monroe, MI
Something went wrong! Please refresh the page.
| Fire incidents reported | |
|---|---|
| Sreet name | Count |
| FRONT ST | 288 |
| TELEGRAPH RD | 274 |
| MONROE ST | 260 |
| DIXIE HWY | 208 |
| CUSTER RD | 150 |
| STEWART RD | 140 |
| ELM AVE | 108 |
| ROESSLER ST | 92 |
| THIRD ST | 90 |
| MACOMB ST | 78 |
| FOURTH ST | 68 |
| FIRST ST | 60 |
| SEVENTH ST | 56 |
| SECOND ST | 52 |
| HEISS RD | 48 |
| DUNBAR RD | 46 |
| SIXTH ST | 46 |
| SMITH ST | 46 |
| LAPLAISANCE RD | 44 |
| NADEAU RD | 42 |
| RAISINVILLE RD | 42 |
| WASHINGTON ST | 42 |
| EIGHTH ST | 40 |
| OAK ST | 40 |
| FIFTH ST | 38 |
| HOLLYWOOD DR | 38 |
| LORAIN ST | 38 |
| HURD RD | 36 |
| NOBLE AVE | 34 |
| UNION ST | 34 |
| Other | 351 |
2002 - 2018 National Fire Incident Reporting System (NFIRS) incidents
- Incident types reported to NFIRS in Monroe, MI
- 23,56459.7%Rescue & EMS
- 3,7829.6%Hazardous Condition
- 3,7429.5%Good Intent Call
- 3,3758.6%Service Call
- 2,9297.4%Fire
- 1,9705.0%False Alarm
- 420.1%Overpressure Rupture
- Fire incident types reported to NFIRS in Monroe, MI
- 1,26143.1%Structure Fires
- 96733.0%Outside Fires
- 45115.4%Mobile Property/Vehicle Fires
- 2508.5%Other
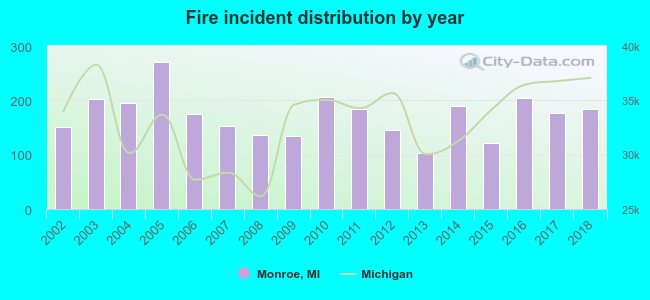 Based on the data from the years 2002 - 2018 the average number of fires per year is 172. The highest number of reported fire incidents - 270 took place in 2005, and the least - 103 in 2013. The data has a rising trend.
The average number of yearly fire incidents per 10k residents in Monroe, MI compared to nearest cities:
(Note: Based on data for the last 3 years, including only cities with population 5,000 and above)
| Monroe: | 93.1 |
| Flat Rock: | 39.2 |
| Temperance: | 59.1 |
| Lambertville: | 11.1 |
| Woodhaven: | 25.9 |
| Trenton: | 15.6 |
| Milan: | 71.1 |
| Grosse Ile: | 12.7 |
| Riverview: | 31.4 |
 The median response time based on all reported fire incidents is 5 minutes. This is lower than the Michigan median value.
The median response time in Monroe, MI compared to nearest cities:
(Note: Based on data for all years, including only cities with at least 500 fire incidents)
| Monroe: | 5 minutes |
| Carleton: | 8 minutes |
| Temperance: | 6 minutes |
| Woodhaven: | 5 minutes |
| Trenton: | 4 minutes |
| Milan: | 10 minutes |
| Belleville: | 7 minutes |
| Romulus: | 7 minutes |
| Southgate: | 5 minutes |
 According to the reports from the years 2002 - 2018 the average number of fire-related yearly deaths is 0. The highest number of deaths - 3 took place in 2011, and the lowest - 0 in 2002. The data has an increasing trend.
The average number of fatalities per 1,000 fires is 3. This indicator was the highest - 16 in 2011, and the lowest 0 in 2002. The trend for fatalities per 1,000 fire incidents is growing. Compared to the Michigan value the number of deaths per 1,000 fire incidents is about the same.
According to the reports from the years 2002 - 2018 the average number of fire-related yearly deaths is 0. The highest number of deaths - 3 took place in 2011, and the lowest - 0 in 2002. The data has an increasing trend.
The average number of fatalities per 1,000 fires is 3. This indicator was the highest - 16 in 2011, and the lowest 0 in 2002. The trend for fatalities per 1,000 fire incidents is growing. Compared to the Michigan value the number of deaths per 1,000 fire incidents is about the same.
 According to the reports from the years 2002 - 2018 the average number of fire-related casualties per year is 2. The highest number of injuries - 6 took place in 2006, and the lowest - 0 in 2002. The data has an increasing trend.
The average number of injuries per 1,000 fires is 9. This indicator was the highest - 34 in 2006, and the lowest 0 in 2002. The trend for injuries per 1,000 fires is growing. Compared to the state value the number of casualties per 1,000 fire incidents is lower.
According to the reports from the years 2002 - 2018 the average number of fire-related casualties per year is 2. The highest number of injuries - 6 took place in 2006, and the lowest - 0 in 2002. The data has an increasing trend.
The average number of injuries per 1,000 fires is 9. This indicator was the highest - 34 in 2006, and the lowest 0 in 2002. The trend for injuries per 1,000 fires is growing. Compared to the state value the number of casualties per 1,000 fire incidents is lower.Casualties per 1,000 incidents in Monroe, MI compared to nearest cities:
(Note: Based on data for all years, including only cities with at least 500 fire incidents)
| Monroe: | 9.2 |
| Carleton: | 1.9 |
| Temperance: | 16.2 |
| Woodhaven: | 10.8 |
| Trenton: | 20.4 |
| Milan: | 7.8 |
| Belleville: | 8.6 |
| Romulus: | 14.2 |
| Southgate: | 14.5 |
 31.6% incidents where reported in the morning and 68.4% in the evening. The most fires (16.1%) took place on Saturday, and the least (13.1%) on Friday.
 According to the 2,929 fire incident reports from years 2002 - 2018 most fires (10.3%) took place during July, and the least (6.5%) in January.
 Out of all 39,459 cases reported during the years 2002 - 2018, the most belonged to the categories: Rescue & EMS (59.7%), Hazardous Condition (9.6%), and Good Intent Call (9.5%).
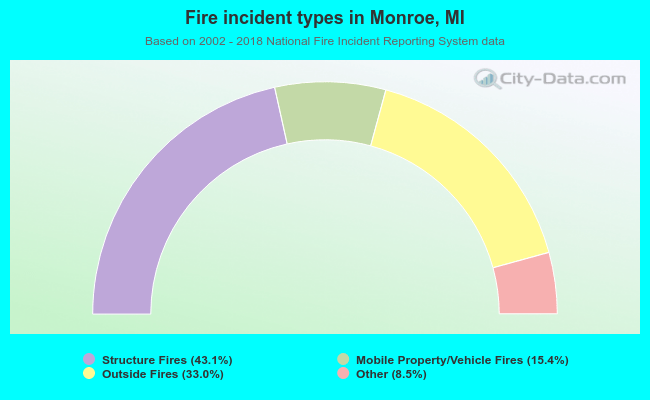 When looking into fire subcategories, the most reports belonged to: Structure Fires (43.1%), and Outside Fires (33.0%).