Mount Vernon: Fire Incidents, Washington (WA)
Where are fire incidents reported in Mount Vernon, WA
Something went wrong! Please refresh the page.
| Fire incidents reported | |
|---|---|
| Sreet name | Count |
| DIVISION ST | 174 |
| COLLEGE WAY | 156 |
| LAVENTURE RD | 132 |
| RIVERSIDE DR | 116 |
| FIR ST | 96 |
| 30TH ST | 78 |
| 26TH ST | 76 |
| COLLEGE WY | 72 |
| 3RD ST | 68 |
| 18TH ST | 66 |
| STANFORD DR | 64 |
| 2ND ST | 62 |
| FREEWAY DR | 62 |
| SECTION ST | 60 |
| CEDARDALE RD | 52 |
| MARKET ST | 50 |
| 6TH ST | 48 |
| 1ST ST | 42 |
| FRANCIS RD | 36 |
| 15TH ST | 34 |
| INST 5 NB | 34 |
| MCLEAN RD | 34 |
| STACKPOLE RD | 34 |
| CONTINENTAL PL | 32 |
| BLACKBURN RD | 30 |
| BROADWAY ST | 30 |
| KULSHAN VIEW DR | 30 |
| MARTIN RD | 30 |
| 21ST ST | 28 |
| 4TH ST | 28 |
| Other | 455 |
2002 - 2018 National Fire Incident Reporting System (NFIRS) incidents
- Incident types reported to NFIRS in Mount Vernon, WA
- 6,10450.5%Rescue & EMS
- 2,30919.1%Fire
- 1,28110.6%Hazardous Condition
- 8717.2%Good Intent Call
- 7346.1%False Alarm
- 7095.9%Service Call
- 590.5%Special Incident
- 190.2%Overpressure Rupture
- Fire incident types reported to NFIRS in Mount Vernon, WA
- 1,00743.6%Structure Fires
- 67829.4%Outside Fires
- 37316.2%Mobile Property/Vehicle Fires
- 25110.9%Other
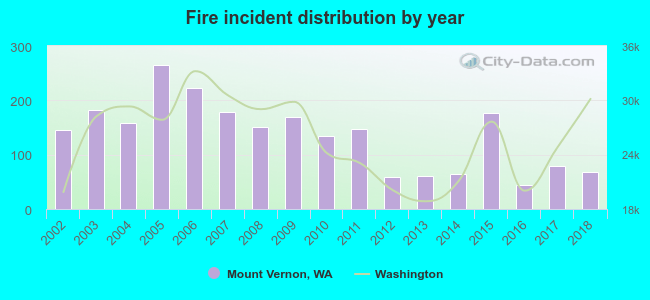 Based on the data from the years 2002 - 2018 the average number of fire incidents per year is 136. The highest number of fire incidents - 265 took place in 2005, and the least - 44 in 2016. The data has a dropping trend.
The average number of yearly fire incidents per 10k residents in Mount Vernon, WA compared to nearest cities:
(Note: Based on data for the last 3 years, including only cities with population 5,000 and above)
| Mount Vernon: | 19.3 |
| Burlington: | 91.4 |
| Bow: | 14.2 |
| Stanwood: | 41.5 |
| Anacortes: | 66.5 |
| Oak Harbor: | 43.0 |
| Arlington: | 79.4 |
| Sudden Valley: | 1.6 |
| Bellingham: | 23.1 |
 The median response time based on all reported fire incidents is 7 minutes. This is comparable to the Washington median value.
The median response time in Mount Vernon, WA compared to nearest cities:
(Note: Based on data for all years, including only cities with at least 500 fire incidents)
| Mount Vernon: | 7 minutes |
| Burlington: | 6 minutes |
| Stanwood: | 8 minutes |
| Anacortes: | 7 minutes |
| Oak Harbor: | 5 minutes |
| Arlington: | 8 minutes |
| Bellingham: | 7 minutes |
| Marysville: | 7 minutes |
| Granite Falls: | 9 minutes |
 Based on the data from the years 2002 - 2018 the average number of fire-related casualties per year is 1. The highest number of reported injuries - 3 took place in 2010, and the lowest - 0 in 2002. The data has a constant trend.
The average number of casualties per 1,000 fires is 4. This indicator was the highest - 22 in 2010, and the lowest 0 in 2002. The trend for injuries per 1,000 fire incidents is constant. Compared to the Washington value the number of injuries per 1,000 fire incidents is lower.
Based on the data from the years 2002 - 2018 the average number of fire-related casualties per year is 1. The highest number of reported injuries - 3 took place in 2010, and the lowest - 0 in 2002. The data has a constant trend.
The average number of casualties per 1,000 fires is 4. This indicator was the highest - 22 in 2010, and the lowest 0 in 2002. The trend for injuries per 1,000 fire incidents is constant. Compared to the Washington value the number of injuries per 1,000 fire incidents is lower.Casualties per 1,000 incidents in Mount Vernon, WA compared to nearest cities:
(Note: Based on data for all years, including only cities with at least 500 fire incidents)
| Mount Vernon: | 4.3 |
| Burlington: | 2.5 |
| Stanwood: | 0.5 |
| Anacortes: | 6.2 |
| Oak Harbor: | 9.9 |
| Arlington: | 4.7 |
| Bellingham: | 1.7 |
| Marysville: | 7.1 |
| Granite Falls: | 6.0 |
 32.0% incidents where reported in the morning and 68.0% in the evening. The most fires (15.6%) took place on Saturday, and the least (12.7%) on Wednesday.
 According to the 2,309 reports from years 2002 - 2018 most fires (15.5%) took place during July, and the least (5.9%) in December.
 Out of all 12,094 cases reported during the years 2002 - 2018, the most belonged to the categories: Rescue & EMS (50.5%), Fire (19.1%), and Hazardous Condition (10.6%).
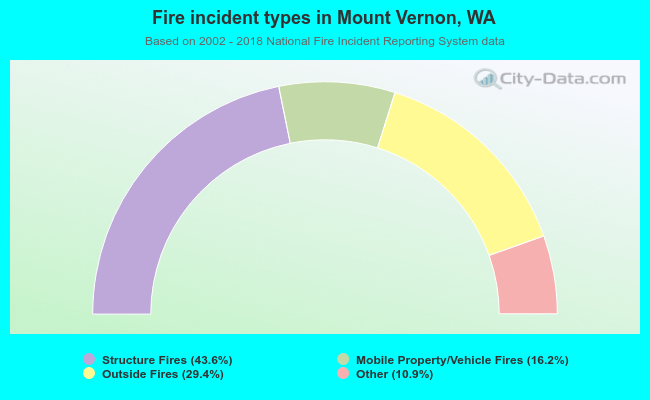 When looking into fire subcategories, the most reports belonged to: Structure Fires (43.6%), and Outside Fires (29.4%).