Oak Harbor: Fire Incidents, Washington (WA)
Where are fire incidents reported in Oak Harbor, WA
Something went wrong! Please refresh the page.
| Fire incidents reported | |
|---|---|
| Sreet name | Count |
| SR 20 | 266 |
| OAK HARBOR ST | 120 |
| 6TH AVE | 78 |
| BARRINGTON DR | 72 |
| GOLDIE ST | 64 |
| CROSBY AVE | 60 |
| 8TH AVE | 58 |
| WHIDBEY AVE | 56 |
| PIONEER WAY | 54 |
| BARRON DR | 48 |
| BEEKSMA DR | 48 |
| MONKEY HILL RD | 46 |
| 4TH AVE | 36 |
| AULT FIELD RD | 36 |
| JONES RD | 36 |
| MIDWAY BLVD | 36 |
| WEST BEACH RD | 36 |
| 7TH AVE | 34 |
| SCENIC HEIGHTS RD | 34 |
| ZYLSTRA RD | 34 |
| CROSBY RD | 32 |
| FORT NUGENT AVE | 32 |
| TAYLOR RD | 32 |
| 2ND AVE | 30 |
| CRESCENT HARBOR RD | 30 |
| FROSTAD RD | 30 |
| HELLER ST | 30 |
| MONROE LANDING RD | 30 |
| BAYSHORE DR | 28 |
| ELY ST | 28 |
| Other | 473 |
2002 - 2018 National Fire Incident Reporting System (NFIRS) incidents
- Incident types reported to NFIRS in Oak Harbor, WA
- 8,00450.3%Rescue & EMS
- 2,02712.7%Fire
- 1,62410.2%Good Intent Call
- 1,4479.1%Service Call
- 1,1537.2%Hazardous Condition
- 9946.2%False Alarm
- 4082.6%Special Incident
- 2611.6%Severe Weather
- Fire incident types reported to NFIRS in Oak Harbor, WA
- 95547.1%Structure Fires
- 74636.8%Outside Fires
- 22511.1%Mobile Property/Vehicle Fires
- 1015.0%Other
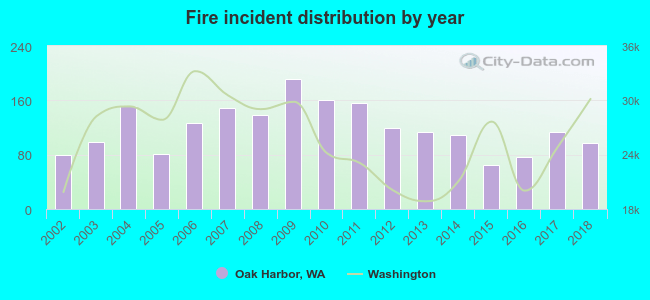 Based on the data from the years 2002 - 2018 the average number of fire incidents per year is 119. The highest number of reported fires - 192 took place in 2009, and the least - 65 in 2015. The data has a growing trend.
The average number of yearly fire incidents per 10k residents in Oak Harbor, WA compared to nearest cities:
(Note: Based on data for the last 3 years, including only cities with population 5,000 and above)
| Oak Harbor: | 43.0 |
| Port Townsend: | 94.4 |
| Anacortes: | 66.5 |
| Stanwood: | 41.5 |
| Discovery Bay: | 2.2 |
| Mount Vernon: | 19.3 |
| Burlington: | 91.4 |
| Bow: | 14.2 |
| Arlington: | 79.4 |
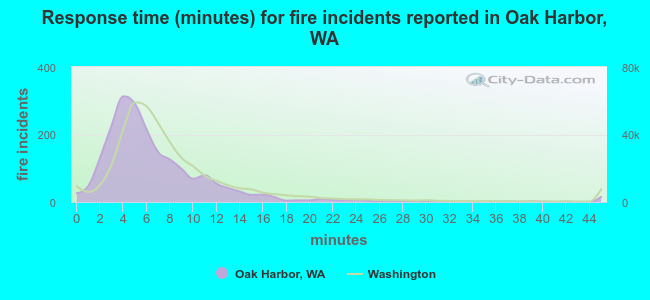 The median response time based on all reported fire incidents is 5 minutes. This is lower than the state median value.
The median response time in Oak Harbor, WA compared to nearest cities:
(Note: Based on data for all years, including only cities with at least 500 fire incidents)
| Oak Harbor: | 5 minutes |
| Port Townsend: | 7 minutes |
| Anacortes: | 7 minutes |
| Stanwood: | 8 minutes |
| Mount Vernon: | 7 minutes |
| Burlington: | 6 minutes |
| Arlington: | 8 minutes |
| Sequim: | 7 minutes |
| Marysville: | 7 minutes |
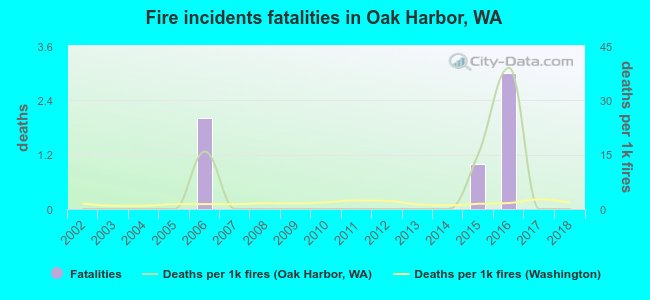 According to the data from the years 2002 - 2018 the average number of fire-related yearly deaths is 0. The highest number of reported deaths - 3 took place in 2016, and the lowest - 0 in 2002. The data has a constant trend.
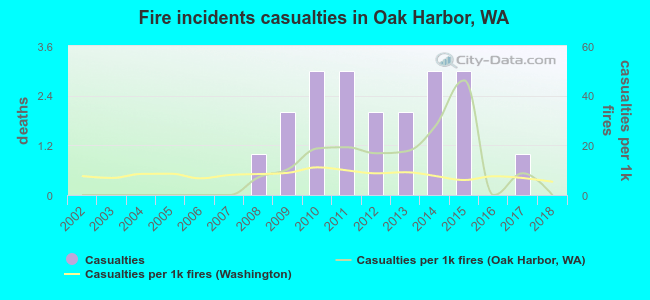 Based on the data from the years 2002 - 2018 the average number of fire-related yearly casualties is 1. The highest number of reported injuries - 3 took place in 2010, and the lowest - 0 in 2002. The data has a constant trend.
The average number of casualties per 1,000 fires is 10. This indicator was the highest - 46 in 2015, and the lowest 0 in 2002. The trend for injuries per 1,000 incidents is constant. Compared to the Washington value the number of casualties per 1,000 fire incidents is higher.
Based on the data from the years 2002 - 2018 the average number of fire-related yearly casualties is 1. The highest number of reported injuries - 3 took place in 2010, and the lowest - 0 in 2002. The data has a constant trend.
The average number of casualties per 1,000 fires is 10. This indicator was the highest - 46 in 2015, and the lowest 0 in 2002. The trend for injuries per 1,000 incidents is constant. Compared to the Washington value the number of casualties per 1,000 fire incidents is higher.Casualties per 1,000 incidents in Oak Harbor, WA compared to nearest cities:
(Note: Based on data for all years, including only cities with at least 500 fire incidents)
| Oak Harbor: | 9.9 |
| Port Townsend: | 5.3 |
| Anacortes: | 6.2 |
| Stanwood: | 0.5 |
| Mount Vernon: | 4.3 |
| Burlington: | 2.5 |
| Arlington: | 4.7 |
| Sequim: | 1.1 |
| Marysville: | 7.1 |
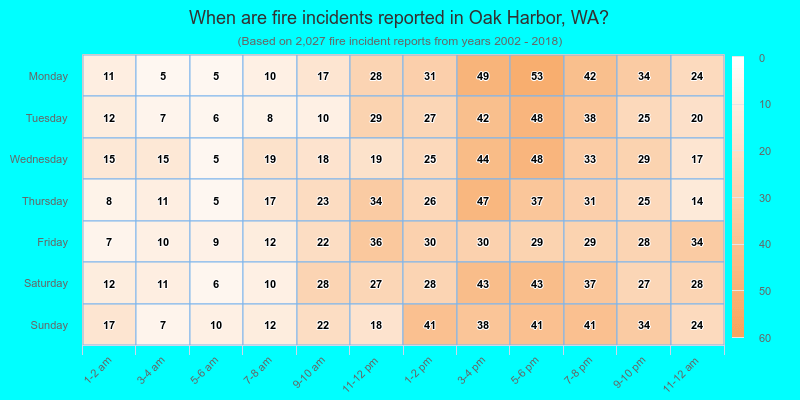
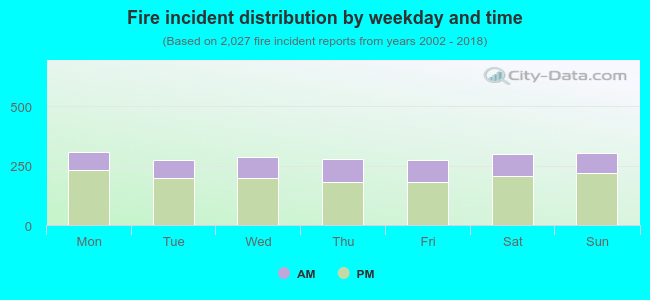 30.2% incidents where reported in the morning and 69.8% in the evening. The most fires (15.2%) took place on Monday, and the least (13.4%) on Tuesday.
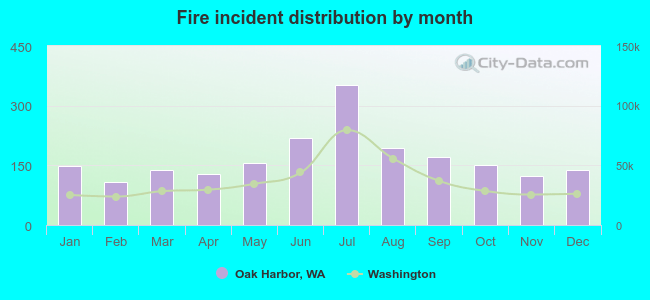 According to the 2,027 fire incident reports from years 2002 - 2018 most fires (17.4%) took place during July, and the least (5.3%) in February.
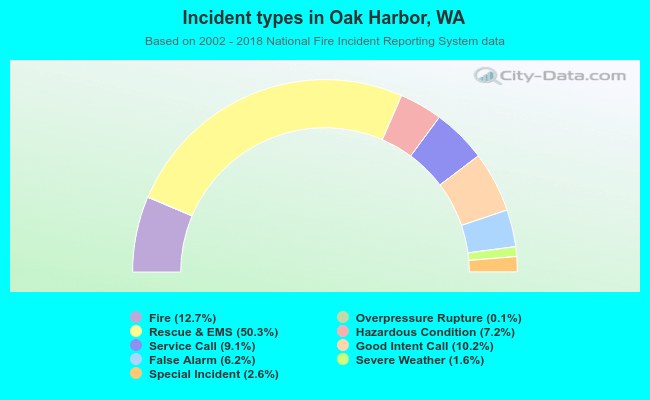 Out of all 15,927 cases reported during the years 2002 - 2018, the most belonged to the categories: Rescue & EMS (50.3%), Fire (12.7%), and Good Intent Call (10.2%).
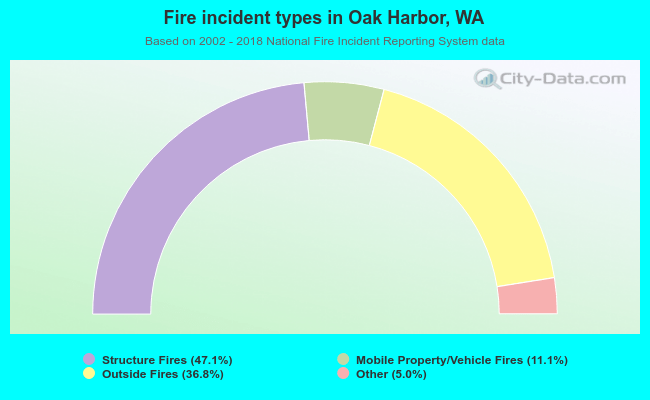 When looking into fire subcategories, the most reports belonged to: Structure Fires (47.1%), and Outside Fires (36.8%).