Rosenberg: Fire Incidents, Texas (TX)
Where are fire incidents reported in Rosenberg, TX
Something went wrong! Please refresh the page.
| Fire incidents reported | |
|---|---|
| Sreet name | Count |
| READING RD | 280 |
| AVENUE H | 212 |
| USHY 59 | 192 |
| LANE DR | 154 |
| 1ST ST | 102 |
| WESTWOOD DR | 102 |
| FM 2218 | 80 |
| STHY 36 | 80 |
| 3RD ST | 78 |
| STEHLE RD | 70 |
| BLUME RD | 68 |
| AVENUE I | 64 |
| 4TH ST | 60 |
| AIRPORT AVE | 58 |
| AVENUE N | 56 |
| 59 | 54 |
| FM 723 | 54 |
| H | 54 |
| MUEGGE RD | 54 |
| FIRST ST | 52 |
| HWY 36 | 52 |
| HWY 59 | 52 |
| 36 | 46 |
| USHY 90A | 46 |
| LOUISE ST | 44 |
| SPUR 10 | 44 |
| 6TH ST | 42 |
| MUSTANG AVE | 42 |
| RADIO LN | 42 |
| 7TH ST | 40 |
| Other | 848 |
2002 - 2018 National Fire Incident Reporting System (NFIRS) incidents
- Incident types reported to NFIRS in Rosenberg, TX
- 15,26157.6%Rescue & EMS
- 3,30112.5%Hazardous Condition
- 3,22212.2%Fire
- 2,1458.1%Good Intent Call
- 1,4665.5%Service Call
- 1,0614.0%False Alarm
- Fire incident types reported to NFIRS in Rosenberg, TX
- 1,38042.8%Structure Fires
- 1,28539.9%Outside Fires
- 47014.6%Mobile Property/Vehicle Fires
- 872.7%Other
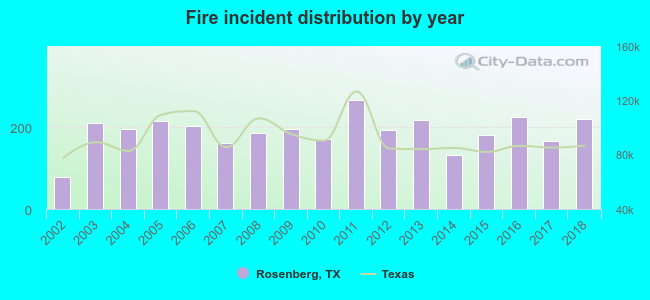 According to the data from the years 2002 - 2018 the average number of fire incidents per year is 190. The highest number of fires - 266 took place in 2011, and the least - 78 in 2002. The data has an increasing trend.
The average number of yearly fire incidents per 10k residents in Rosenberg, TX compared to nearest cities:
(Note: Based on data for the last 3 years, including only cities with population 5,000 and above)
| Rosenberg: | 59.4 |
| Richmond: | 151.4 |
| Sugar Land: | 18.3 |
| Meadows Place: | 2.9 |
| Stafford: | 75.0 |
| Missouri City: | 28.7 |
| Katy: | 260.2 |
| Fresno: | 16.6 |
| Bellaire: | 17.9 |
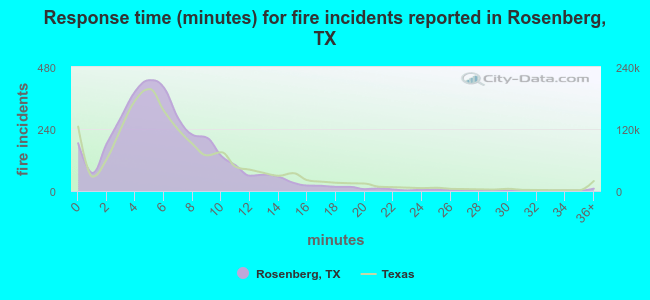 The median response time based on all reported fire incidents is 6 minutes. This is comparable to the state median value.
The median response time in Rosenberg, TX compared to nearest cities:
(Note: Based on data for all years, including only cities with at least 500 fire incidents)
| Rosenberg: | 6 minutes |
| Richmond: | 6 minutes |
| Beasley: | 10 minutes |
| Fulshear: | 9 minutes |
| Sugar Land: | 6 minutes |
| Stafford: | 7 minutes |
| Missouri City: | 7 minutes |
| Katy: | 8 minutes |
| Brookshire: | 9 minutes |
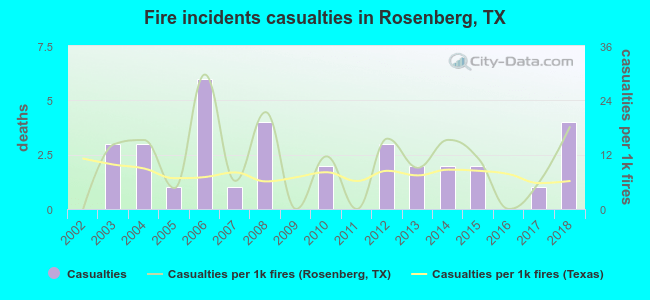 Based on the reports from the years 2002 - 2018 the average number of fire-related casualties per year is 2. The highest number of reported casualties - 6 took place in 2006, and the lowest - 0 in 2002. The data has an increasing trend.
The average number of injuries per 1,000 fire incidents is 10. This indicator was the highest - 30 in 2006, and the lowest 0 in 2002. The trend for casualties per 1,000 fire incidents is increasing. Compared to the Texas value the number of casualties per 1,000 fire incidents is higher.
Based on the reports from the years 2002 - 2018 the average number of fire-related casualties per year is 2. The highest number of reported casualties - 6 took place in 2006, and the lowest - 0 in 2002. The data has an increasing trend.
The average number of injuries per 1,000 fire incidents is 10. This indicator was the highest - 30 in 2006, and the lowest 0 in 2002. The trend for casualties per 1,000 fire incidents is increasing. Compared to the Texas value the number of casualties per 1,000 fire incidents is higher.Casualties per 1,000 incidents in Rosenberg, TX compared to nearest cities:
(Note: Based on data for all years, including only cities with at least 500 fire incidents)
| Rosenberg: | 10.6 |
| Richmond: | 6.1 |
| Beasley: | 0.0 |
| Fulshear: | 0.0 |
| Sugar Land: | 6.4 |
| Stafford: | 6.0 |
| Missouri City: | 15.7 |
| Katy: | 12.8 |
| Brookshire: | 1.6 |
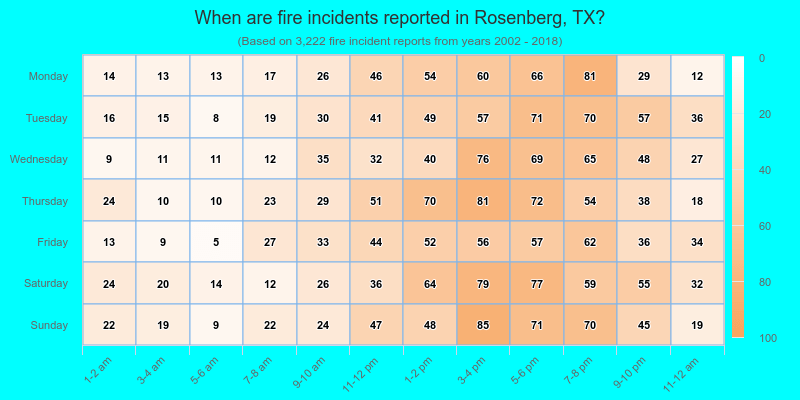
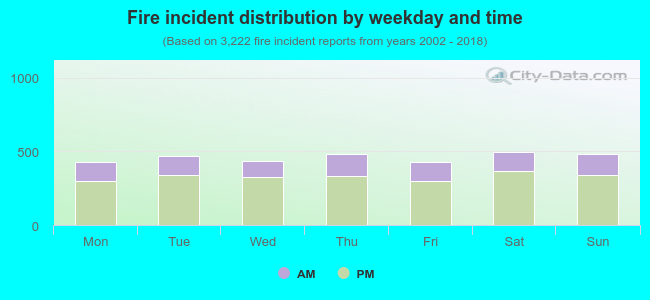 28.6% incidents where reported in the morning and 71.4% in the evening. The most fires (15.5%) took place on Saturday, and the least (13.3%) on Friday.
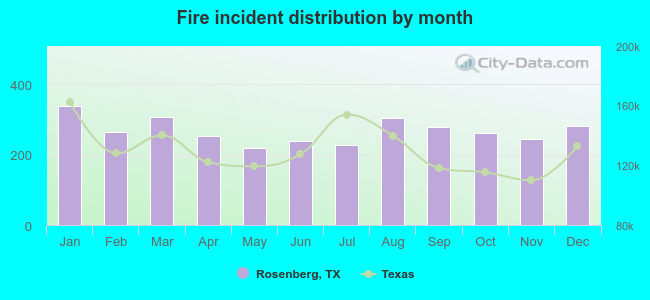 According to the 3,222 fire incidents from years 2002 - 2018 most fires (10.5%) took place during January, and the least (6.8%) in May.
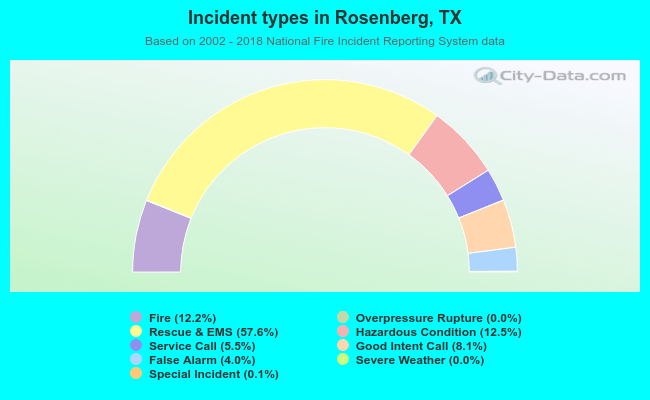 Out of all 26,493 cases reported during the years 2002 - 2018, the most belonged to the categories: Rescue & EMS (57.6%), Hazardous Condition (12.5%), and Fire (12.2%).
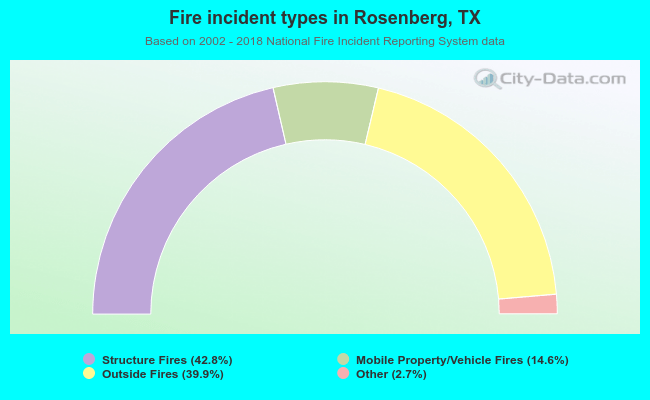 When looking into fire subcategories, the most incidents belonged to: Structure Fires (42.8%), and Outside Fires (39.9%).