Sugar Land: Fire Incidents, Texas (TX)
Where are fire incidents reported in Sugar Land, TX
Something went wrong! Please refresh the page.
| Fire incidents reported | |
|---|---|
| Sreet name | Count |
| SOUTHWEST FWY | 284 |
| SH 6 | 214 |
| US 59 | 208 |
| US 90A | 126 |
| SH 6 HWY | 108 |
| LEXINGTON BLVD | 80 |
| SETTLERS WAY | 70 |
| ELDRIDGE RD | 64 |
| NEW TERRITORY BLVD | 64 |
| DAIRY ASHFORD RD | 58 |
| INDUSTRIAL BLVD | 54 |
| SOUTHWEST FW | 52 |
| TOWN CENTER BLVD | 50 |
| AUSTIN PKY | 48 |
| US 90A HWY | 48 |
| WILLIAMS TRACE BLVD | 48 |
| DULLES AVE | 46 |
| US 59 HWY | 46 |
| GRANTS LAKE BLVD | 44 |
| SEVENTH ST | 44 |
| UNIVERSITY BLVD | 42 |
| FLUOR DANIEL DR | 40 |
| SWEETWATER BLVD | 36 |
| CRABB RIVER RD | 34 |
| FM 1464 | 34 |
| SOUTHWEST FRY | 32 |
| AIRPORT BLVD | 30 |
| COMMONWEALTH BLVD | 28 |
| RIVERCREST DR | 28 |
| SUGAR CREEK BLVD | 26 |
| Other | 730 |
2002 - 2018 National Fire Incident Reporting System (NFIRS) incidents
- Incident types reported to NFIRS in Sugar Land, TX
- 27,42959.8%Rescue & EMS
- 5,71912.5%Good Intent Call
- 4,72910.3%False Alarm
- 3,2597.1%Hazardous Condition
- 2,8166.1%Fire
- 1,8063.9%Service Call
- 460.1%Severe Weather
- Fire incident types reported to NFIRS in Sugar Land, TX
- 1,12439.9%Structure Fires
- 94033.4%Outside Fires
- 64723.0%Mobile Property/Vehicle Fires
- 1053.7%Other
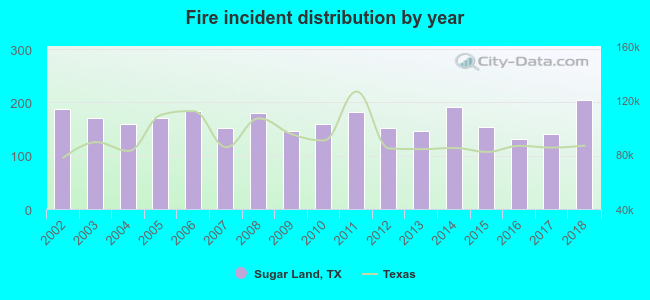 According to the data from the years 2002 - 2018 the average number of fires per year is 166. The highest number of fires - 204 took place in 2018, and the least - 132 in 2016. The data has a rising trend.
The average number of yearly fire incidents per 10k residents in Sugar Land, TX compared to nearest cities:
(Note: Based on data for the last 3 years, including only cities with population 5,000 and above)
| Sugar Land: | 18.3 |
| Stafford: | 75.0 |
| Meadows Place: | 2.9 |
| Missouri City: | 28.7 |
| Richmond: | 151.4 |
| Fresno: | 16.6 |
| Bellaire: | 17.9 |
| Rosenberg: | 59.4 |
| Manvel: | 42.3 |
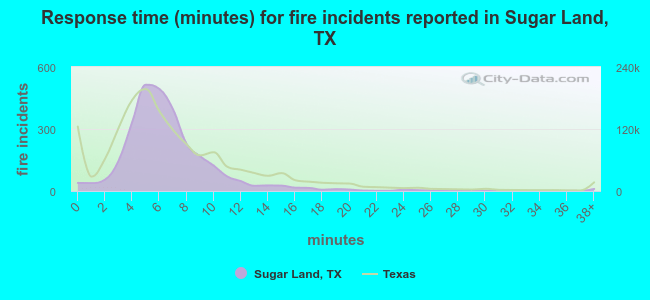 The median response time based on all reported fire incidents is 6 minutes. This is close to the Texas median value.
The median response time in Sugar Land, TX compared to nearest cities:
(Note: Based on data for all years, including only cities with at least 500 fire incidents)
| Sugar Land: | 6 minutes |
| Stafford: | 7 minutes |
| Missouri City: | 7 minutes |
| Richmond: | 6 minutes |
| Fresno: | 11 minutes |
| Bellaire: | 4 minutes |
| Rosenberg: | 6 minutes |
| Manvel: | 7 minutes |
| Fulshear: | 9 minutes |
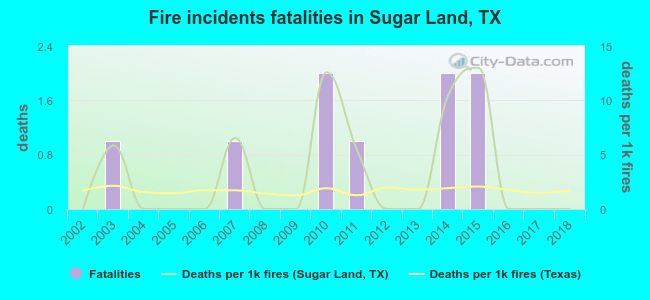 Based on the data from the years 2002 - 2018 the average number of fire-related yearly deaths is 1. The highest number of deaths - 2 took place in 2010, and the lowest - 0 in 2002. The data has a constant trend.
The average number of fatalities per 1,000 fires is 3. This indicator was the highest - 13 in 2015, and the lowest 0 in 2002. The trend for fatalities per 1,000 fire incidents is dropping. Compared to the Texas value the number of fatalities per 1,000 fires is higher.
Based on the data from the years 2002 - 2018 the average number of fire-related yearly deaths is 1. The highest number of deaths - 2 took place in 2010, and the lowest - 0 in 2002. The data has a constant trend.
The average number of fatalities per 1,000 fires is 3. This indicator was the highest - 13 in 2015, and the lowest 0 in 2002. The trend for fatalities per 1,000 fire incidents is dropping. Compared to the Texas value the number of fatalities per 1,000 fires is higher.
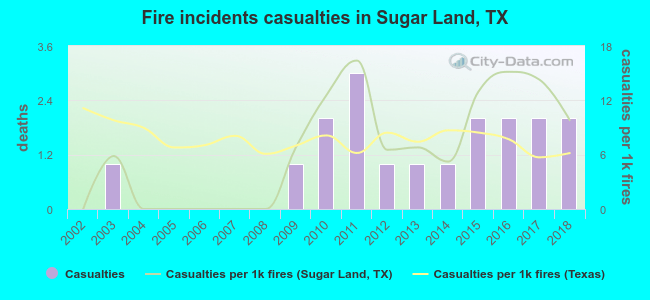 Based on the reports from the years 2002 - 2018 the average number of fire-related casualties per year is 1. The highest number of reported casualties - 3 took place in 2011, and the lowest - 0 in 2002. The data has a growing trend.
The average number of injuries per 1,000 fires is 7. This indicator was the highest - 16 in 2011, and the lowest 0 in 2002. The trend for casualties per 1,000 fire incidents is increasing. Compared to the state value the number of casualties per 1,000 fires is about the same.
Based on the reports from the years 2002 - 2018 the average number of fire-related casualties per year is 1. The highest number of reported casualties - 3 took place in 2011, and the lowest - 0 in 2002. The data has a growing trend.
The average number of injuries per 1,000 fires is 7. This indicator was the highest - 16 in 2011, and the lowest 0 in 2002. The trend for casualties per 1,000 fire incidents is increasing. Compared to the state value the number of casualties per 1,000 fires is about the same.
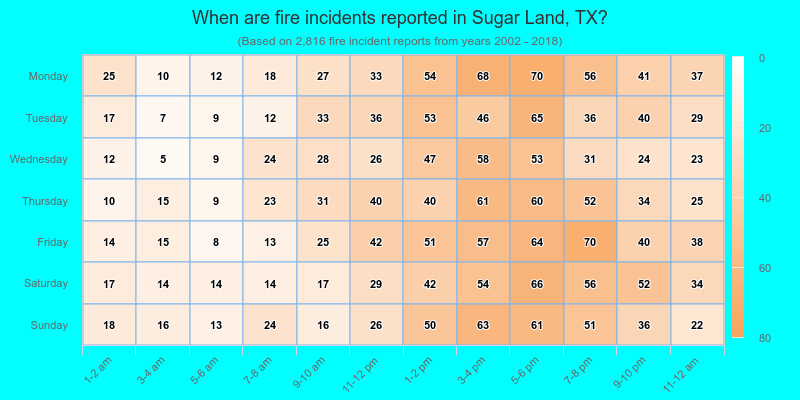
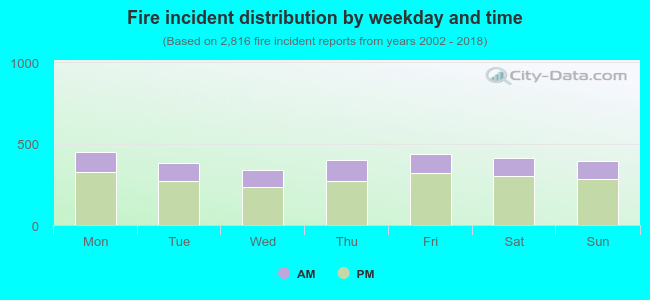 28.6% incidents where reported in the morning and 71.4% in the evening. The most fires (16.0%) took place on Monday, and the least (12.1%) on Wednesday.
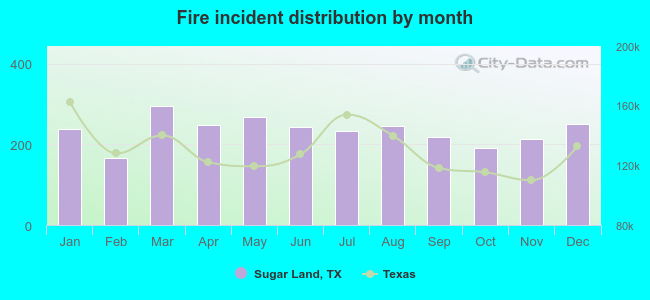 According to the 2,816 reports from years 2002 - 2018 most fires (10.5%) took place during March, and the least (5.9%) in February.
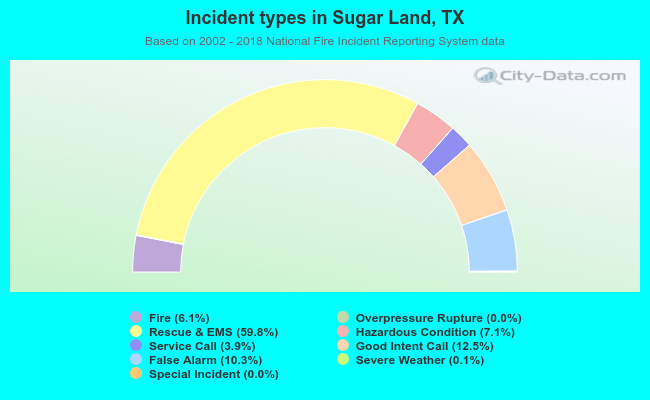 Out of all 45,842 cases reported during the years 2002 - 2018, the most belonged to the categories: Rescue & EMS (59.8%), Good Intent Call (12.5%), and False Alarm (10.3%).
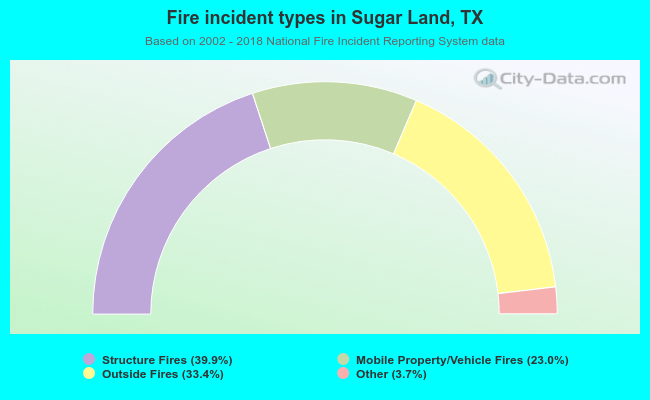 When looking into fire subcategories, the most reports belonged to: Structure Fires (39.9%), and Outside Fires (33.4%).