Germantown, MD (Maryland) Houses and Residents
| Germantown: | $410,000 |
| Maryland: | $398,100 |
Mean price in 2022:
Detached houses: $691,019
Here: $691,019 State: $526,819 Townhouses or other attached units: $396,551
Here: $396,551 State: $328,305 In 2-unit structures: $281,751
Here: $281,751 State: $346,599 In 3-to-4-unit structures: $269,938
Here: $269,938 State: $295,378 In 5-or-more-unit structures: $209,018
Here: $209,018 State: $350,378 Mobile homes: $48,010
Here: $48,010 State: $89,353
Total population: 86,395 (Urban population: 55,152, Rural population: 0)
Houses: 34,535 (34,385 occupied: 22,111 owner occupied, 12,274 renter occupied)
| % of renters here: | 36% |
| State: | 32% |
Housing density: 3,206 houses/condos per square mile
Median price asked for vacant for-sale houses and condos in 2022: $414,179.
Median contract rent in 2022: $1,555 (lower quartile is $1,285, upper quartile is $1,815)
Median rent asked for vacant for-rent units in 2022: $1,403
Median gross rent in Germantown, MD in 2022: $1,764
Housing units in Germantown with a mortgage: 17,844 (1,323 second mortgage, 0 home equity loan, 883 both second mortgage and home equity loan)
Houses without a mortgage: 239
Median household income for houses/condos with a mortgage: $130,246
Median household income for apartments without a mortgage: $144,152
Median monthly housing costs: $1,764
Compare current foreclosures in Germantown, MD:
| Photo | Address | Area | Beds / Baths | Price | Details |
|---|---|---|---|---|---|

|
#1
Caledonia Ct Apt K
Germantown, MD 20874
|
1,087 sq. feet
|
2 baths 2 beds |
show details | |

|
#2
Palmetto Cir
Germantown, MD 20874
|
1,135 sq. feet
|
2 baths 3 beds |
show details | |

|
#3
Berryville Rd
Germantown, MD 20874
|
960 sq. feet
|
1 baths 3 beds |
show details | |

|
#4
Placid Lake Ter
Germantown, MD 20874
|
1,518 sq. feet
|
4 baths - beds |
show details | |

|
#5
Zinnia Cir
Germantown, MD 20876
|
1,060 sq. feet
|
2 baths - beds |
show details | |

|
#6
Thunderhead Way
Germantown, MD 20874
|
1,232 sq. feet
|
4 baths - beds |
show details | |

|
#7
Stone Hollow Dr
Germantown, MD 20874
|
1,690 sq. feet
|
4 baths - beds |
show details | |

|
#8
Seneca Forest Cir
Germantown, MD 20876
|
3,947 sq. feet
|
3 baths - beds |
show details | |

|
#9
Ashbrook Ct
Germantown, MD 20876
|
1,220 sq. feet
|
1 baths - beds |
show details | |

|
#10
Beaconfield Ter Apt 101
Germantown, MD 20874
|
1,094 sq. feet
|
- baths - beds |
show details |
| Photo | Address | Area | Beds / Baths | Price | Details |
|---|---|---|---|---|---|

|
#11
Alderleaf Ter
Germantown, MD 20874
|
1,880 sq. feet
|
2 baths - beds |
show details | |

|
#12
Lark Song Ter
Germantown, MD 20874
|
1,377 sq. feet
|
2 baths - beds |
show details | |

|
#13
Yellow Leaf Way
Germantown, MD 20876
|
3,542 sq. feet
|
2 baths - beds |
show details | |

|
#14
Songbird Ln
Germantown, MD 20876
|
3,068 sq. feet
|
3 baths - beds |
show details | |

|
#15
Aberstraw Way
Germantown, MD 20876
|
1,620 sq. feet
|
2 baths - beds |
show details | |

|
#16
Appledowre Cir # 255
Germantown, MD 20876
|
1,270 sq. feet
|
2 baths - beds |
show details | |

|
#17
Summer Oak Dr
Germantown, MD 20874
|
1,096 sq. feet
|
1 baths - beds |
show details | |

|
#18
Queenstown Ln
Germantown, MD 20874
|
2,450 sq. feet
|
3 baths - beds |
show details | |

|
#19
Parev Ter
Germantown, MD 20874
|
4,622 sq. feet
|
5 baths - beds |
show details | |

|
#20
Country Ridge Dr
Germantown, MD 20874
|
2,078 sq. feet
|
3 baths - beds |
show details |
| Photo | Address | Area | Beds / Baths | Price | Details |
|---|---|---|---|---|---|

|
#21
Hartsbourne Dr
Germantown, MD 20874
|
3,272 sq. feet
|
3 baths - beds |
show details | |

|
#22
Red Pepper Ct
Germantown, MD 20874
|
1,464 sq. feet
|
2 baths - beds |
show details | |

|
#23
Metz Dr
Germantown, MD 20874
|
1,344 sq. feet
|
2 baths - beds |
show details | |

|
#24
Shearwater Pl
Germantown, MD 20874
|
3,612 sq. feet
|
3 baths - beds |
show details | |

|
#25
Cottage Field Ct
Germantown, MD 20874
|
2,100 sq. feet
|
2 baths - beds |
show details | |

|
#26
Warrior Brook Dr
Germantown, MD 20874
|
1,060 sq. feet
|
1 baths - beds |
show details | |

|
#27
Chatterly Ter
Germantown, MD 20874
|
1,494 sq. feet
|
2 baths - beds |
show details | |

|
#28
Roger Dr
Germantown, MD 20874
|
2,280 sq. feet
|
4 baths - beds |
show details | |

|
#29
Panthers Ridge Dr
Germantown, MD 20876
|
2,408 sq. feet
|
3 baths - beds |
show details | |

|
#30
Hartley Hall Pl
Germantown, MD 20874
|
4,569 sq. feet
|
3 baths - beds |
show details |
| Photo | Address | Area | Beds / Baths | Price | Details |
|---|---|---|---|---|---|

|
#31
Brundidge Ter
Germantown, MD 20876
|
1,240 sq. feet
|
2 baths - beds |
show details | |

|
#32
Eagles Roost Dr
Germantown, MD 20874
|
1,433 sq. feet
|
2 baths - beds |
show details | |

|
#33
Rushing Water Way
Germantown, MD 20874
|
1,910 sq. feet
|
3 baths - beds |
show details | |

|
#34
Minstrel Tune Dr
Germantown, MD 20876
|
2,674 sq. feet
|
1 baths - beds |
show details | |

|
#35
Kitchen House Way
Germantown, MD 20874
|
1,188 sq. feet
|
1 baths - beds |
show details | |

|
#36
Churubusco Ln
Germantown, MD 20874
|
1,280 sq. feet
|
1 baths - beds |
show details | |

|
#37
Futura Ct # Un86
Germantown, MD 20876
|
2,040 sq. feet
|
- baths - beds |
show details | |

|
#38
Ansel Ter
Germantown, MD 20874
|
2,260 sq. feet
|
3 baths - beds |
show details | |

|
#39
Cross Laurel Ct
Germantown, MD 20876
|
1,260 sq. feet
|
2 baths - beds |
show details | |

|
#40
Winding Creek Way
Germantown, MD 20874
|
1,218 sq. feet
|
1 baths - beds |
show details |
| Photo | Address | Area | Beds / Baths | Price | Details |
|---|---|---|---|---|---|

|
#41
Grassy Knoll Ter
Germantown, MD 20876
|
2,326 sq. feet
|
3 baths - beds |
show details | |

|
#42
Running Cedar Ct
Germantown, MD 20876
|
1,281 sq. feet
|
2 baths - beds |
show details | |

|
#43
Watkins Meadow Dr
Germantown, MD 20876
|
1,878 sq. feet
|
2 baths - beds |
show details | |

|
#44
Neerwinder Pl
Germantown, MD 20874
|
1,146 sq. feet
|
2 baths - beds |
show details | |

|
#45
Aberstraw Way
Germantown, MD 20876
|
1,620 sq. feet
|
1 baths - beds |
show details | |

|
#46
Monarch Vista Dr
Germantown, MD 20874
|
2,487 sq. feet
|
2 baths - beds |
show details | |

|
#47
Shakespeare Dr
Germantown, MD 20876
|
1,680 sq. feet
|
3 baths - beds |
show details | |

|
#48
Pikeview Dr
Germantown, MD 20874
|
1,064 sq. feet
|
1 baths - beds |
show details | |

|
#49
Steeple Ct
Germantown, MD 20874
|
2,151 sq. feet
|
3 baths - beds |
show details | |

|
Check over 1 million property listings on Foreclosure.com!
|
browse all offers | |||

Latest news about housing in Germantown, MD collected exclusively by city-data.com from local newspapers, TV, and radio stations


Median year apartment built: 1993
Household type by relationship:
Households: 93,203- Male householders: 16,429 (4,563 living alone), Female householders: 17,956 (5,851 living alone)
15,049 spouses (14,881 opposite-sex spouses), 2,246 unmarried partners, (1,830 opposite-sex unmarried partners), 29,283 children (27,978 natural, 564 adopted, 741 stepchildren), 2,299 grandchildren, 1,202 brothers or sisters, 3,083 parents, 0 foster children, 1,568 other relatives, 3,983 non-relatives
- In group quarters: 105
Size of family households: 6,727 2-persons, 6,468 3-persons, 5,727 4-persons, 1,956 5-persons, 589 6-persons, 735 7-or-more-persons.
Size of nonfamily households: 10,414 1-person, 1,396 2-persons, 272 3-persons, 101 5-persons.
13,578 married couples with children.
5,002 single-parent households (844 men, 4,158 women).
49.7% of residents of Germantown speak English at home.
21.1% of residents speak Spanish at home (56% speak English very well, 20% speak English well, 19% speak English not well, 5% don't speak English at all).
11.2% of residents speak other Indo-European language at home (74% speak English very well, 17% speak English well, 7% speak English not well, 1% don't speak English at all).
12.9% of residents speak Asian or Pacific Island language at home (55% speak English very well, 22% speak English well, 19% speak English not well, 3% don't speak English at all).
4.5% of residents speak other language at home (79% speak English very well, 16% speak English well, 4% speak English not well, 1% don't speak English at all).
Foreign born population: 35,123 (37.7%)
(58.2% of them are naturalized citizens)
| Here: | 6.9 |
| State: | 7.3 |
| Here: | 4.3 |
| State: | 4.2 |

- Bedrooms in owner-occupied houses and condos in Germantown, Maryland
- 0no bedroom
- 2751 bedroom
- 3,9702 bedrooms
- 9,0413 bedrooms
- 6,3224 bedrooms
- 2,5035+ bedrooms

- Bedrooms in renter-occupied apartments in Germantown, Maryland
- 828no bedroom
- 2,0901 bedroom
- 5,5842 bedrooms
- 3,0513 bedrooms
- 2524 bedrooms
- 4695+ bedrooms

- Cars and other vehicles available in Germantown in owner-occupied houses/condos
- 298no vehicle
- 8,0721 vehicle
- 8,4812 vehicles
- 3,9823 vehicles
- 6584 vehicles
- 6205+ vehicles

- Cars and other vehicles available in Germantown in renter-occupied apartments
- 1,883no vehicle
- 6,5191 vehicle
- 3,3362 vehicles
- 4163 vehicles
- 1204 vehicles
- 05+ vehicles

- Rooms in owner-occupied houses in Germantown, Maryland
- 01 room
- 2252 rooms
- 1433 rooms
- 2,2374 rooms
- 2,7905 rooms
- 4,0866 rooms
- 4,0657 rooms
- 2,7708 rooms
- 5,7959+ rooms

- Rooms in renter-occupied apartments in Germantown, Maryland
- 8281 room
- 3002 rooms
- 2,4473 rooms
- 3,3314 rooms
- 1,9185 rooms
- 1,5526 rooms
- 1,0887 rooms
- 5578 rooms
- 2539+ rooms


Germantown, MD household income distribution

- 325Less than $10,000
- 1,153$10,000 to $19,999
- 1,790$20,000 to $29,999
- 1,769$30,000 to $39,999
- 1,384$40,000 to $49,999
- 1,891$50,000 to $59,999
- 3,213$60,000 to $74,999
- 4,535$75,000 to $99,999
- 4,068$100,000 to $124,999
- 3,806$125,000 to $149,999
- 4,326$150,000 to $199,999
- 6,125$200,000 or more

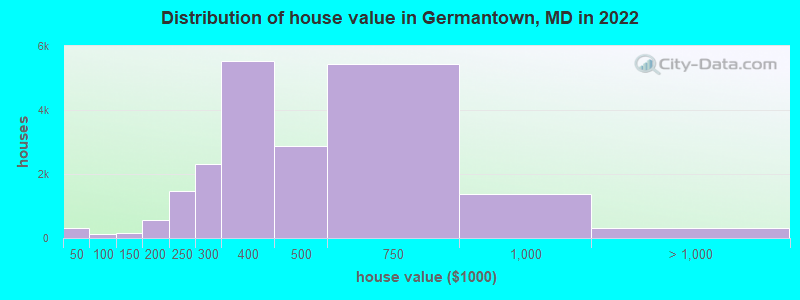
Home value of owner - occupied houses in 2022 in Germantown, MD
-
- 212Less than $10,000
- 41$20,000 to $24,999
- 23$35,000 to $39,999
- 18$40,000 to $49,999
- 43$50,000 to $59,999
- 41$60,000 to $69,999
- 16$70,000 to $79,999
- 13$90,000 to $99,999
- 62$100,000 to $124,999
- 108$125,000 to $149,999
- 165$150,000 to $174,999
- 382$175,000 to $199,999
- 1,462$200,000 to $249,999
- 2,318$250,000 to $299,999
- 5,524$300,000 to $399,999
- 2,876$400,000 to $499,999
- 5,450$500,000 to $749,999
- 1,369$750,000 to $999,999
- 105$1,000,000 to $1,499,999
- 20$1,500,000 to $1,999,999
- 183$2,000,000 or more
Rent paid by renters in 2022 in Germantown, MD
-
- 11Less than $100
- 16$100 to $149
- 98$150 to $199
- 8$200 to $249
- 43$300 to $349
- 120$600 to $649
- 17$650 to $699
- 42$700 to $749
- 66$750 to $799
- 91$800 to $899
- 30$900 to $999
- 656$1,000 to $1,249
- 2,672$1,250 to $1,499
- 5,554$1,500 to $1,999
- 1,539$2,000 to $2,499
- 200$2,500 to $2,999
- 54$3,000 to $3,499
- 39$3,500 or more
- 174No cash rent


Percentage of workers working in this county: 82.3%
Number of people working at home: 10,492 (21.4% of all workers)
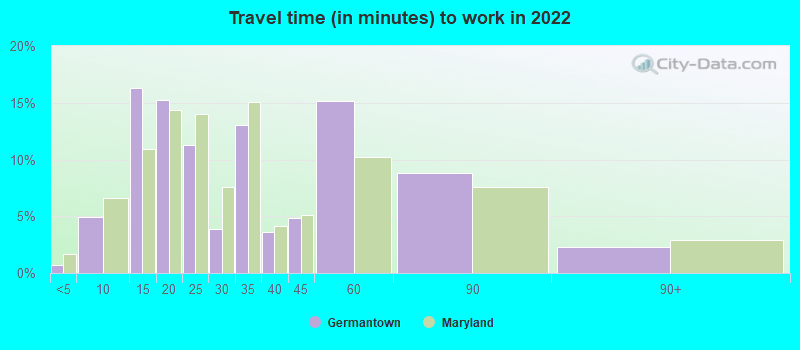
Travel time to work (commute)
- Less than 5 minutes: 447
- 5 to 9 minutes: 1,354
- 10 to 14 minutes: 3,911
- 15 to 19 minutes: 4,996
- 20 to 24 minutes: 4,788
- 25 to 29 minutes: 2,512
- 30 to 34 minutes: 5,831
- 35 to 39 minutes: 2,222
- 40 to 44 minutes: 2,854
- 45 to 59 minutes: 3,548
- 60 to 89 minutes: 5,339
- 90 or more minutes: 672
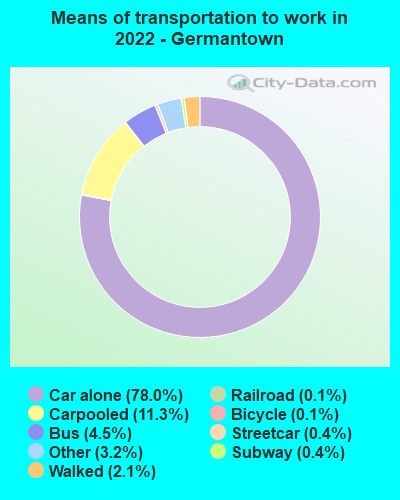
Means of transportation to work:
- Drove a car alone: 15,012 (51.7%)
- Carpooled: 2,322 (8.0%)
- Bus: 740 (2.5%)
- Subway or elevated rail: 59 (0.2%)
- Long-distance train or commuter rail: 73 (0.3%)
- Light rail, streetcar or trolley: 20 (0.1%)
- Taxi: 655 (2.3%)
- Bicycle: 35 (0.1%)
- Walked: 339 (1.2%)
- Worked at home: 10,492 (36.1%)

- Unemployment by race in 2022
- Unemployment rate for White non-Hispanic residents
- 7.8%Males
- 1.8%Females
- Unemployment rate for Black residents
- 12.6%Males
- 12.5%Females
- Unemployment rate for Asian residents
- 10.2%Males
- 5.2%Females
- Unemployment rate for other race residents
- 3.4%Males
- 2.9%Females
- Unemployment rate for two or more race residents
- 2.4%Males
- 5.0%Females
- Unemployment rate for Hispanic or Latino residents
- 2.9%Males
- 2.9%Females

- Year of entry for the foreign-born population in Germantown, Maryland
- 10,5652010 or later
- 9,4782000 to 2009
- 7,4141990 to 1999
- 3,9071980 to 1989
- 1,4801970 to 1979
- 642Before 1970

First ancestries reported:
- African: 1,929 (3.3%)
- German: 1,245 (2.2%)
- Irish: 1,151 (2.0%)
- English: 1,146 (2.0%)
- Ghanaian: 1,131 (2.0%)
- Jamaican: 1,017 (1.8%)
- American: 916 (1.6%)
- European: 914 (1.6%)
- Italian: 866 (1.5%)
- Nigerian: 859 (1.5%)
- Iranian: 832 (1.4%)
- Albanian: 780 (1.4%)
- Ethiopian: 510 (0.9%)
- Russian: 403 (0.7%)
- Polish: 352 (0.6%)
- West Indian: 332 (0.6%)
- British: 323 (0.6%)
- Brazilian: 229 (0.4%)
- Haitian: 180 (0.3%)
- Kenyan: 173 (0.3%)
- Sierra Leonean: 166 (0.3%)
- Scottish: 164 (0.3%)
- French: 139 (0.2%)
- Trinidadian and Tobagonian: 134 (0.2%)
- Eastern European: 131 (0.2%)
- Lebanese: 129 (0.2%)
- Northern European: 124 (0.2%)
- Ukrainian: 113 (0.2%)
- Czechoslovakian: 107 (0.2%)
- Greek: 107 (0.2%)
- Austrian: 106 (0.2%)
- Egyptian: 92 (0.2%)
- Hungarian: 82 (0.1%)
- Palestinian: 74 (0.1%)
- Slovak: 65 (0.1%)
- British West Indian: 62 (0.1%)
- Scandinavian: 62 (0.1%)
- Cajun: 59 (0.1%)
- Swedish: 50 (0.09%)
- Yugoslavian: 49 (0.09%)
- Pennsylvania German: 49 (0.09%)
- French Canadian: 44 (0.08%)
- Serbian: 43 (0.07%)
- Welsh: 40 (0.07%)
- Guyanese: 39 (0.07%)
- Czech: 37 (0.06%)
- Romanian: 30 (0.05%)
- Syrian: 27 (0.05%)
- Bulgarian: 25 (0.04%)
- Dutch: 24 (0.04%)
- Finnish: 23 (0.04%)
- Barbadian: 23 (0.04%)
- Zimbabwean: 21 (0.04%)
- Assyrian: 19 (0.03%)
- Turkish: 19 (0.03%)
- Senegalese: 18 (0.03%)
- Scotch-Irish: 18 (0.03%)
- Iraqi: 17 (0.03%)
- Arab: 12 (0.02%)
- Australian: 12 (0.02%)
- Armenian: 11 (0.02%)
- Slovene: 10 (0.02%)
- Lithuanian: 9 (0.02%)
- Norwegian: 8 (0.01%)
- Portuguese: 8 (0.01%)
- Ugandan: 8 (0.01%)
- Afghan: 6 (0.01%)
- Israeli: 4 (0.01%)
Most common places of birth for foreign-born residents (%):
| Germantown: | 10.5% (3,688) |
| Maryland: | 4.6% (44,742) |
| Germantown: | 9.7% (3,416) |
| Maryland: | 6.4% (61,725) |
| Germantown: | 9.2% (3,216) |
| Maryland: | 12.0% (115,412) |
| Germantown: | 3.6% (1,249) |
| Maryland: | 0.7% (7,000) |
| Germantown: | 3.5% (1,225) |
| Maryland: | 1.8% (17,161) |
| Germantown: | 3.5% (1,217) |
| Maryland: | 2.5% (24,026) |
| Germantown: | 3.2% (1,120) |
| Maryland: | 3.8% (36,698) |
| Germantown: | 3.1% (1,091) |
| Maryland: | 1.8% (17,774) |
| Germantown: | 2.7% (948) |
| Maryland: | 3.4% (32,635) |
| Germantown: | 2.5% (873) |
| Maryland: | 1.1% (10,205) |
| Germantown: | 2.1% (753) |
| Maryland: | 1.3% (12,074) |
| Germantown: | 1.9% (650) |
| Maryland: | 4.6% (44,825) |
| Germantown: | 1.8% (640) |
| Maryland: | 0.4% (4,118) |
| Germantown: | 1.7% (602) |
| Maryland: | 2.8% (27,444) |
| Germantown: | 1.7% (601) |
| Maryland: | 1.9% (18,716) |
| Germantown: | 1.6% (562) |
| Maryland: | 0.7% (6,317) |
| Germantown: | 1.6% (557) |
| Maryland: | 0.7% (7,124) |
| Germantown: | 1.6% (551) |
| Maryland: | 3.5% (34,065) |
| Germantown: | 1.5% (538) |
| Maryland: | 1.8% (17,037) |
| Germantown: | 1.5% (526) |
| Maryland: | 4.4% (42,350) |
Place of birth for U.S.-born residents:
- This state: 31,616
- Other state: 23,398
- Northeast: 5,979
- Midwest: 3,596
- South: 11,550
- West: 2,273
89.9% of Germantown residents lived in the same house 1 years ago.
Out of people who lived in different houses, 42.0% lived in this county.
Out of people who lived in different counties, 62.8% lived in Maryland.
| Germantown: | 89.9% |
| State average: | 88.5% |
Education attainment for males 25 years and older:
- No schooling: 600
- Nursery to 4th grade: 98
- 5th and 6th grade: 280
- 7th and 8th grade: 152
- 9th grade: 442
- 10th grade: 0
- 11th grade: 0
- 12th grade, no diploma: 1,011
- High school graduate (or equivalency): 5,568
- Less than 1 year of college: 1,935
- Some college more than 1 year, no degree: 2,989
- Associate degree: 1,854
- Bachelor's degree: 8,461
- Master's degree: 4,686
- Professional school degree: 989
- Doctorate degree: 1,788

Education attainment for females 25 years and older:
- No schooling: 896
- Nursery to 4th grade: 265
- 5th and 6th grade: 507
- 7th and 8th grade: 0
- 9th grade: 252
- 10th grade: 381
- 11th grade: 27
- 12th grade, no diploma: 1,284
- High school graduate (or equivalency): 6,151
- Less than 1 year of college: 1,164
- Some college more than 1 year, no degree: 3,192
- Associate degree: 1,953
- Bachelor's degree: 8,551
- Master's degree: 6,651
- Professional school degree: 709
- Doctorate degree: 1,032


Housing units in structures:
- One, detached: 9,069
- One, attached: 13,561
- Two: 1,064
- 3 or 4: 874
- 5 to 9: 2,060
- 10 to 19: 5,348
- 20 to 49: 583
- 50 or more: 1,663
- Mobile homes: 313
House/condo owner moved in on average 13 years ago
Renter moved in on average 2 years ago

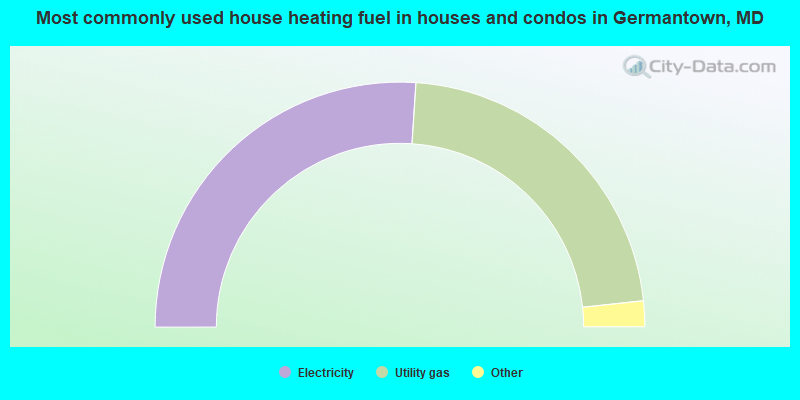
- 52.1%Electricity
- 44.5%Utility gas
- 2.0%Fuel oil, kerosene, etc.
- 0.6%Bottled, tank, or LP gas
- 0.4%No fuel used
- 0.3%Solar energy
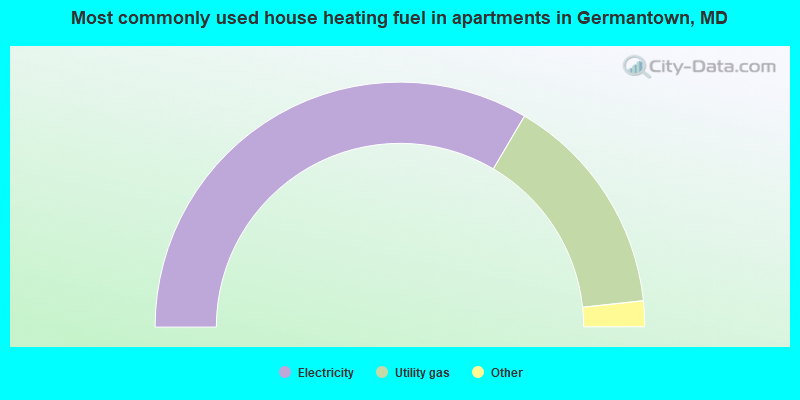
- 67.0%Electricity
- 29.6%Utility gas
- 2.5%Bottled, tank, or LP gas
- 0.5%Wood
- 0.3%No fuel used
- 0.2%Fuel oil, kerosene, etc.
Private vs. public school enrollment:
| Here: | 5.9% |
| Maryland: | 15.2% |
| Here: | 4.0% |
| Maryland: | 14.4% |
| Here: | 18.4% |
| Maryland: | 20.2% |


