Hempstead, TX (Texas) Houses and Residents
| Hempstead: | $172,761 |
| Texas: | $275,400 |
Mean price in 2022:
Detached houses: $229,073
Here: $229,073 State: $369,058 Mobile homes: $41,589
Here: $41,589 State: $124,413
Total population: 6,699 (Urban population: 4,157 (all inside urban clusters), Rural population: 456 (all nonfarm))
Houses: 2,168 (2,092 occupied: 572 owner occupied, 1,551 renter occupied)
| % of renters here: | 73% |
| State: | 38% |
Housing density: 436 houses/condos per square mile
Median price asked for vacant for-sale houses and condos in 2022 in this county: $1,019,421.
Median contract rent in 2022: $910 (lower quartile is $646, upper quartile is $1,154)
Median rent asked for vacant for-rent units in 2022: $4,766
Median gross rent in Hempstead, TX in 2022: $1,102
Housing units in Hempstead with a mortgage: 186 (6 second mortgage, 0 home equity loan, 7 both second mortgage and home equity loan)
Houses without a mortgage: 0
Median household income for houses/condos with a mortgage: $116,256
Median household income for apartments without a mortgage: $69,081
Median monthly housing costs: $1,052
Compare current foreclosures near Hempstead, TX:
| Photo | Address | Area | Beds / Baths | Price | Details |
|---|---|---|---|---|---|

|
#1
3rd St
Hempstead, TX 77445
|
- sq. feet
|
2 baths 4 beds |
show details | |

|
#2
Armadillo Dr
Hempstead, TX 77445
|
- sq. feet
|
- baths - beds |
show details | |

|
#3
Kildare St
Hempstead, TX 77445
|
- sq. feet
|
- baths - beds |
show details | |

|
#4
7th St
Hempstead, TX 77445
|
- sq. feet
|
- baths - beds |
show details | |

|
#5
6th St
Hempstead, TX 77445
|
- sq. feet
|
- baths - beds |
show details | |

|
#6
High Point St
Hempstead, TX 77445
|
- sq. feet
|
- baths - beds |
show details | |

|
#7
Frey Rd
Hempstead, TX 77445
|
1,185 sq. feet
|
- baths - beds |
show details | |

|
#8
Richards Rd # 4102
Hempstead, TX 77445
|
- sq. feet
|
- baths - beds |
show details | |

|
#9
Cattle Creek Rd
Hempstead, TX 77445
|
1,216 sq. feet
|
- baths - beds |
show details | |

|
#10
Farm To Market 359
Hempstead, TX 77445
|
- sq. feet
|
- baths - beds |
show details |
| Photo | Address | Area | Beds / Baths | Price | Details |
|---|---|---|---|---|---|

|
#11
Walnut Hill Dr
Hockley, TX 77447
|
1,894 sq. feet
|
2 baths 4 beds |
show details | |

|
#12
Cathy Dr
Hockley, TX 77447
|
1,746 sq. feet
|
2 baths 3 beds |
show details | |

|
#13
Whippoorwill Rd
Navasota, TX 77868
|
1,500 sq. feet
|
1 baths 4 beds |
show details | |

|
#14
Fields Store Rd
Waller, TX 77484
|
1,216 sq. feet
|
2 baths 3 beds |
show details | |

|
#15
Ironwood Dr
Waller, TX 77484
|
1,567 sq. feet
|
2 baths 3 beds |
show details | |

|
#16
Hunter Ranch Way
Hockley, TX 77447
|
1,568 sq. feet
|
2 baths 3 beds |
show details | |

|
#17
Roberts Rd
Hockley, TX 77447
|
1,288 sq. feet
|
2 baths 3 beds |
show details | |

|
#18
N Meinecke St
Bellville, TX 77418
|
2,413 sq. feet
|
2 baths - beds |
show details | |

|
#19
Evergreen Forest Ln
Navasota, TX 77868
|
560 sq. feet
|
- baths - beds |
show details | |

|
#20
Old Highway 36 Rd
Bellville, TX 77418
|
- sq. feet
|
- baths - beds |
show details |
| Photo | Address | Area | Beds / Baths | Price | Details |
|---|---|---|---|---|---|

|
#21
Fm 1488 Rd
Magnolia, TX 77355
|
768 sq. feet
|
- baths - beds |
show details | |

|
#22
Ridgewood Dr
Magnolia, TX 77355
|
1,288 sq. feet
|
- baths - beds |
show details | |

|
#23
Roberts Rd
Hockley, TX 77447
|
- sq. feet
|
- baths - beds |
show details | |

|
#24
Pine Ridge Rd
Hockley, TX 77447
|
1,816 sq. feet
|
- baths - beds |
show details | |

|
#25
Roberts Rd
Hockley, TX 77447
|
- sq. feet
|
- baths - beds |
show details | |

|
#26
Green Plume Ln
Hockley, TX 77447
|
- sq. feet
|
- baths - beds |
show details | |

|
#27
King Arthur Ct
Hockley, TX 77447
|
- sq. feet
|
- baths - beds |
show details | |

|
#28
Rolling Hills Dr
Hockley, TX 77447
|
- sq. feet
|
- baths - beds |
show details | |

|
#29
Country Lane
Hockley, TX 77447
|
- sq. feet
|
- baths - beds |
show details | |

|
#30
Bareback Ln
Waller, TX 77484
|
- sq. feet
|
- baths - beds |
show details |
| Photo | Address | Area | Beds / Baths | Price | Details |
|---|---|---|---|---|---|

|
#31
Indian Trail Ln
Brenham, TX 77833
|
- sq. feet
|
- baths - beds |
show details | |

|
#32
Appleyard Lane
Hockley, TX 77447
|
- sq. feet
|
- baths - beds |
show details | |

|
#33
Willow St # 2
Waller, TX 77484
|
- sq. feet
|
- baths - beds |
show details | |

|
#34
68 High Pt
Prairie View, TX 77446
|
- sq. feet
|
- baths - beds |
show details | |

|
#35
Pineridge Rd
Waller, TX 77484
|
2,200 sq. feet
|
- baths - beds |
show details | |

|
#36
Dahila St
Prairie View, TX 77446
|
- sq. feet
|
- baths - beds |
show details | |

|
#37
Fm 1456 Rd
Bellville, TX 77418
|
- sq. feet
|
- baths - beds |
show details | |

|
#38
G H Cir
Waller, TX 77484
|
- sq. feet
|
- baths - beds |
show details | |

|
#39
Key St
Waller, TX 77484
|
2,048 sq. feet
|
- baths - beds |
show details | |

|
#40
Ironwood Dr
Waller, TX 77484
|
- sq. feet
|
- baths - beds |
show details |
| Photo | Address | Area | Beds / Baths | Price | Details |
|---|---|---|---|---|---|

|
#41
Wild Duck Ln
Hockley, TX 77447
|
- sq. feet
|
- baths - beds |
show details | |

|
#42
Kitty Hawk Dr
Waller, TX 77484
|
- sq. feet
|
- baths - beds |
show details | |

|
#43
Margerstadt Rd
Waller, TX 77484
|
- sq. feet
|
- baths - beds |
show details | |

|
#44
Petty Rd
Waller, TX 77484
|
- sq. feet
|
- baths - beds |
show details | |

|
#45
Tepee Trl
Hockley, TX 77447
|
- sq. feet
|
- baths - beds |
show details | |

|
#46
Pappas Rd
Waller, TX 77484
|
- sq. feet
|
- baths - beds |
show details | |

|
#47
Jasper Ridge Dr
Hockley, TX 77447
|
- sq. feet
|
- baths - beds |
show details | |

|
#48
Miramichi Ct
Hockley, TX 77447
|
- sq. feet
|
- baths - beds |
show details | |

|
Check over 1 million property listings on Foreclosure.com!
|
browse all offers | |||

Latest news about housing in Hempstead, TX collected exclusively by city-data.com from local newspapers, TV, and radio stations

 | Houston CORE developments thread (743 replies) |
| Does Anyone Know How to Reach a Home Sapiens at the Texas DPS? (10 replies) |
| Beacon Hill-Massive Development in Waller County (58 replies) |
| Conroe (Commute) (11 replies) |
| International lives in Houston, where to buy a starter house? (46 replies) |
| Why are there so many blacks in west Houston? (73 replies) |

Median year apartment built: 1992
Household type by relationship:
Households: 5,838- Male householders: 751 (326 living alone), Female householders: 1,312 (227 living alone)
468 spouses (468 opposite-sex spouses), 149 unmarried partners, (149 opposite-sex unmarried partners), 1,960 children (1,933 natural, 0 adopted, 26 stepchildren), 84 grandchildren, 10 brothers or sisters, 63 parents, 0 foster children, 804 other relatives, 171 non-relatives
- In group quarters: 62
Size of family households: 619 2-persons, 418 3-persons, 155 4-persons, 78 5-persons, 84 6-persons.
Size of nonfamily households: 584 1-person, 197 2-persons.
580 married couples with children.
1,027 single-parent households (117 men, 910 women).
70.6% of residents of Hempstead speak English at home.
28.4% of residents speak Spanish at home (57% speak English very well, 23% speak English well, 17% speak English not well, 3% don't speak English at all).
Foreign born population: 740 (12.7%)
(23.5% of them are naturalized citizens)
| Here: | 5.8 |
| State: | 6.3 |
| Here: | 3.3 |
| State: | 4.0 |

- Bedrooms in owner-occupied houses and condos in Hempstead, Texas
- 0no bedroom
- 01 bedroom
- 822 bedrooms
- 2113 bedrooms
- 2524 bedrooms
- 275+ bedrooms

- Bedrooms in renter-occupied apartments in Hempstead, Texas
- 77no bedroom
- 1041 bedroom
- 1,0702 bedrooms
- 3013 bedrooms
- 04 bedrooms
- 05+ bedrooms

- Cars and other vehicles available in Hempstead in owner-occupied houses/condos
- 17no vehicle
- 791 vehicle
- 2162 vehicles
- 1333 vehicles
- 1104 vehicles
- 185+ vehicles

- Cars and other vehicles available in Hempstead in renter-occupied apartments
- 124no vehicle
- 1,0731 vehicle
- 3112 vehicles
- 443 vehicles
- 04 vehicles
- 05+ vehicles

- Rooms in owner-occupied houses in Hempstead, Texas
- 01 room
- 02 rooms
- 123 rooms
- 294 rooms
- 2025 rooms
- 1516 rooms
- 767 rooms
- 328 rooms
- 729+ rooms

- Rooms in renter-occupied apartments in Hempstead, Texas
- 771 room
- 02 rooms
- 7583 rooms
- 2864 rooms
- 2835 rooms
- 516 rooms
- 967 rooms
- 08 rooms
- 09+ rooms


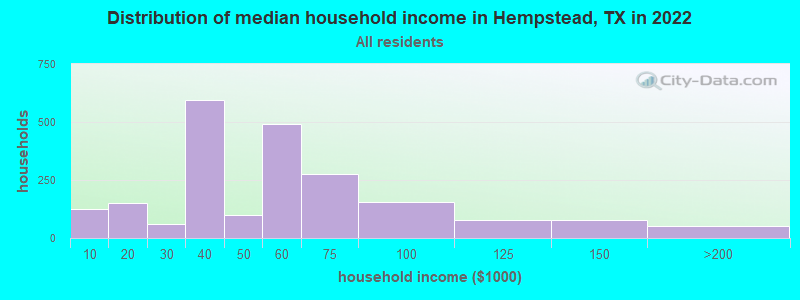
Hempstead, TX household income distribution

- 123Less than $10,000
- 149$10,000 to $19,999
- 59$20,000 to $29,999
- 593$30,000 to $39,999
- 101$40,000 to $49,999
- 491$50,000 to $59,999
- 278$60,000 to $74,999
- 154$75,000 to $99,999
- 78$100,000 to $124,999
- 79$125,000 to $149,999
- 44$150,000 to $199,999
- 8$200,000 or more
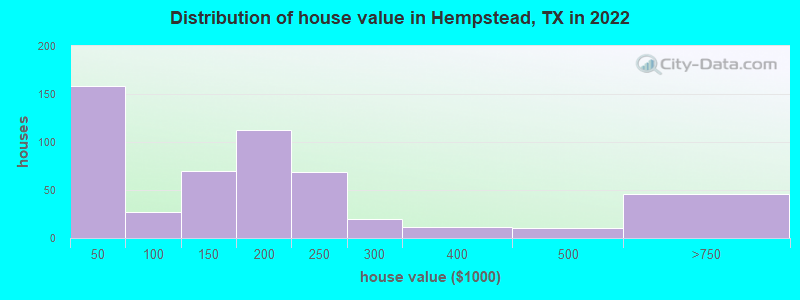
Home value of owner - occupied houses in 2022 in Hempstead, TX
-
- 42Less than $10,000
- 61$15,000 to $19,999
- 9$20,000 to $24,999
- 44$30,000 to $34,999
- 10$60,000 to $69,999
- 0$70,000 to $79,999
- 15$90,000 to $99,999
- 46$100,000 to $124,999
- 23$125,000 to $149,999
- 112$175,000 to $199,999
- 69$200,000 to $249,999
- 19$250,000 to $299,999
- 11$300,000 to $399,999
- 9$400,000 to $499,999
- 45$500,000 to $749,999
Rent paid by renters in 2022 in Hempstead, TX
-
- 19Less than $100
- 22$200 to $249
- 29$250 to $299
- 18$350 to $399
- 10$500 to $549
- 161$550 to $599
- 53$600 to $649
- 43$700 to $749
- 394$800 to $899
- 93$900 to $999
- 438$1,000 to $1,249
- 132$1,250 to $1,499
- 10No cash rent


Percentage of workers working in this county: 54.0%
Number of people working at home: 30 (1.2% of all workers)
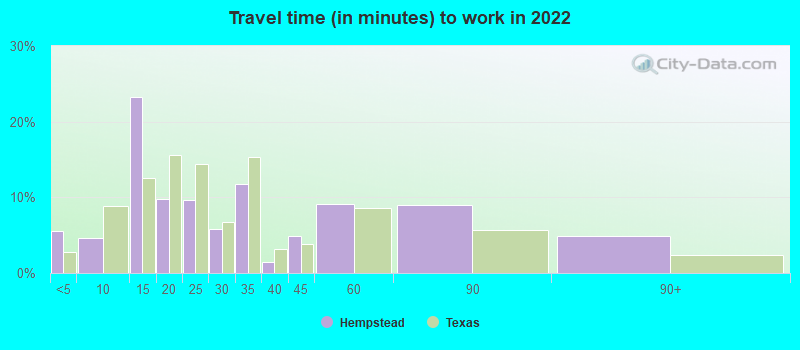
Travel time to work (commute)
- Less than 5 minutes: 79
- 5 to 9 minutes: 138
- 10 to 14 minutes: 628
- 15 to 19 minutes: 170
- 20 to 24 minutes: 239
- 25 to 29 minutes: 137
- 30 to 34 minutes: 219
- 35 to 39 minutes: 0
- 40 to 44 minutes: 8
- 45 to 59 minutes: 654
- 60 to 89 minutes: 127
- 90 or more minutes: 52
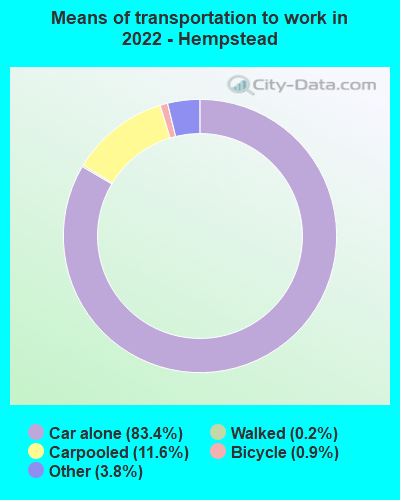
Means of transportation to work:
- Drove a car alone: 1,839 (78.3%)
- Carpooled: 279 (11.9%)
- Taxi: 103 (4.4%)
- Bicycle: 20 (0.9%)
- Walked: 5 (0.2%)
- Worked at home: 30 (1.3%)

- Unemployment by race in 2022
- Unemployment rate for Hispanic or Latino residents
- 3.7%Males

- Year of entry for the foreign-born population in Hempstead, Texas
- 1352010 or later
- 3942000 to 2009
- 1161990 to 1999
- 2251980 to 1989
- 461970 to 1979
- 4Before 1970
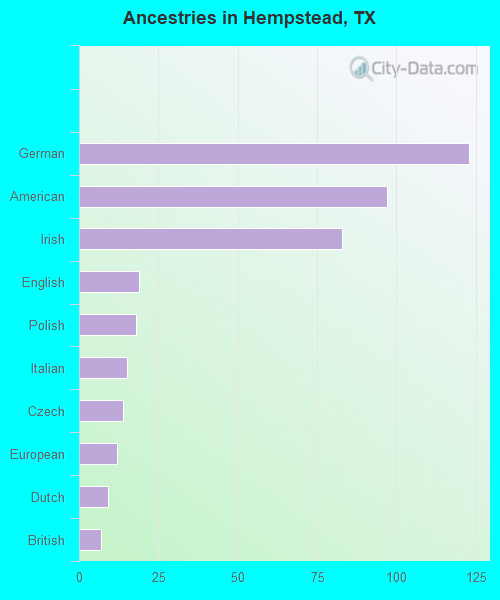
First ancestries reported:
- German: 123 (3.0%)
- American: 97 (2.4%)
- Irish: 83 (2.0%)
- English: 19 (0.5%)
- Polish: 18 (0.4%)
- Italian: 15 (0.4%)
- Czech: 14 (0.3%)
- European: 12 (0.3%)
- Dutch: 9 (0.2%)
- British: 7 (0.2%)
Most common places of birth for foreign-born residents (%):
| Hempstead: | 71.2% (527) |
| Texas: | 48.4% (2,411,723) |
| Hempstead: | 9.9% (73) |
| Texas: | 3.0% (147,182) |
| Hempstead: | 9.3% (69) |
| Texas: | 4.5% (224,455) |
| Hempstead: | 5.3% (39) |
| Texas: | 1.5% (72,413) |
| Hempstead: | 3.0% (22) |
| Texas: | 0.3% (13,763) |
Place of birth for U.S.-born residents:
- This state: 4,347
- Other state: 686
- Northeast: 9
- Midwest: 107
- South: 519
- West: 42
92.5% of Hempstead residents lived in the same house 1 years ago.
Out of people who lived in different houses, 17.8% lived in this county.
Out of people who lived in different counties, 79.4% lived in Texas.
| Hempstead: | 92.5% |
| State average: | 85.7% |
Education attainment for males 25 years and older:
- No schooling: 83
- Nursery to 4th grade: 0
- 5th and 6th grade: 28
- 7th and 8th grade: 11
- 9th grade: 31
- 10th grade: 0
- 11th grade: 0
- 12th grade, no diploma: 26
- High school graduate (or equivalency): 291
- Less than 1 year of college: 31
- Some college more than 1 year, no degree: 212
- Associate degree: 11
- Bachelor's degree: 369
- Master's degree: 43
- Professional school degree: 0
- Doctorate degree: 0

Education attainment for females 25 years and older:
- No schooling: 56
- Nursery to 4th grade: 12
- 5th and 6th grade: 30
- 7th and 8th grade: 0
- 9th grade: 37
- 10th grade: 43
- 11th grade: 0
- 12th grade, no diploma: 97
- High school graduate (or equivalency): 612
- Less than 1 year of college: 97
- Some college more than 1 year, no degree: 589
- Associate degree: 105
- Bachelor's degree: 105
- Master's degree: 56
- Professional school degree: 0
- Doctorate degree: 0


Housing units in structures:
- One, detached: 695
- One, attached: 87
- Two: 44
- 3 or 4: 265
- 5 to 9: 772
- 20 to 49: 35
- 50 or more: 76
- Mobile homes: 191
Median worth of mobile homes: $35,195
House/condo owner moved in on average 7 years ago
Renter moved in on average 3 years ago

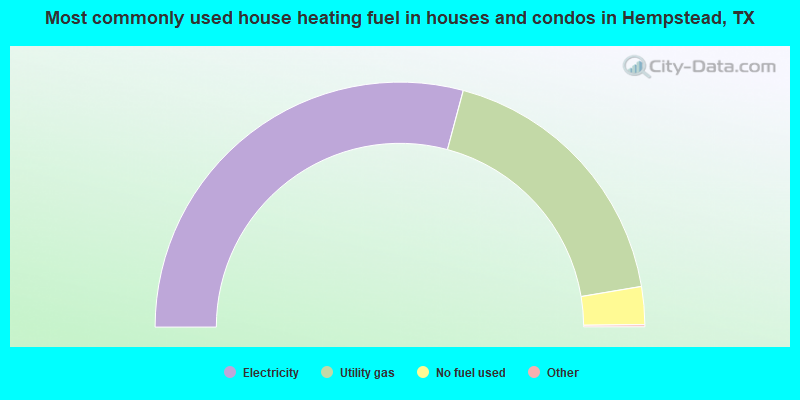
- 58.5%Electricity
- 36.5%Utility gas
- 5.0%No fuel used
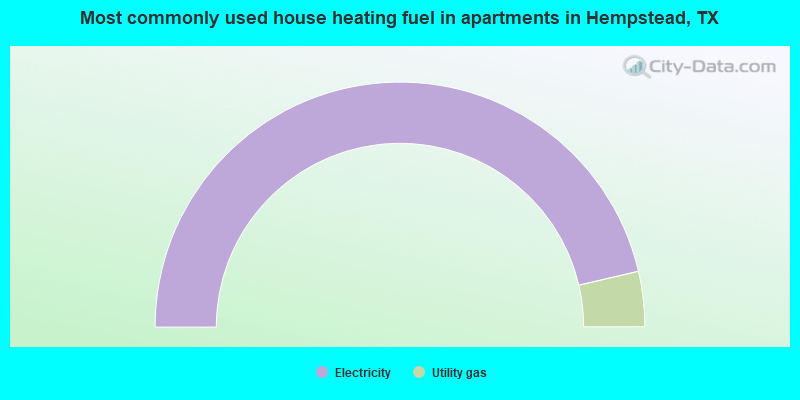
- 92.7%Electricity
- 7.3%Utility gas
Private vs. public school enrollment:
| Here: | 0.0% |
| Texas: | 8.8% |
| Here: | 2.6% |
| Texas: | 8.0% |
| Here: | 0.0% |
| Texas: | 16.2% |


