Races in Hempstead, Texas (TX) Detailed Stats
Data:
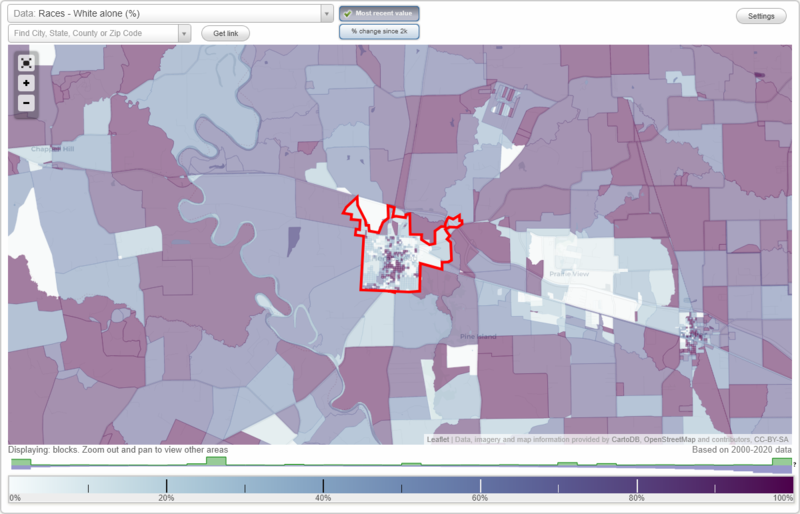
Races - White alone (%)
Races - White alone (% change since 2000)
Races - Black alone (%)
Races - Black alone (% change since 2000)
Races - American Indian alone (%)
Races - American Indian alone (% change since 2000)
Races - Asian alone (%)
Races - Asian alone (% change since 2000)
Races - Hispanic (%)
Races - Hispanic (% change since 2000)
Races - Native Hawaiian and Other Pacific Islander alone (%)
Races - Native Hawaiian and Other Pacific Islander alone (% change since 2000)
Races - Two or more races(%)
Races - Two or more races(% change since 2000)
Races - Other race alone (%)
Races - Other race alone (% change since 2000)
Racial diversity
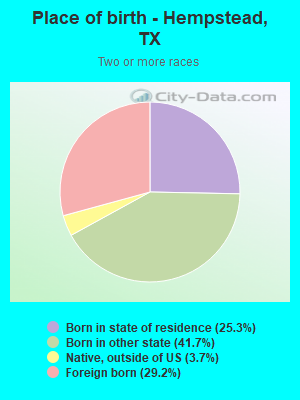
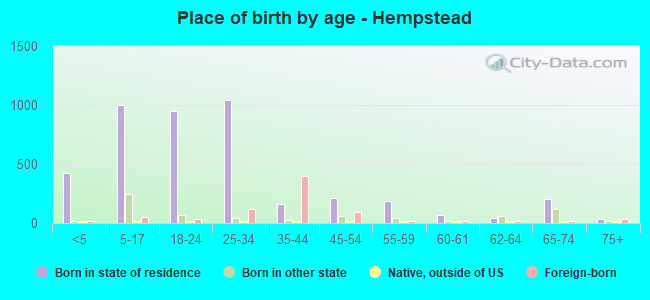
Place of birth - Born in state of residence (%)
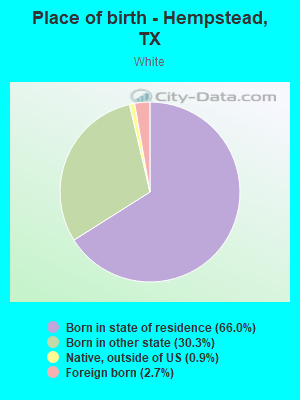
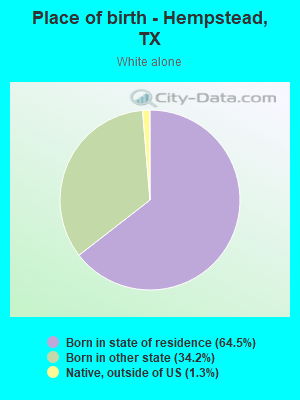
Place of birth - Born in state of residence (%) - White
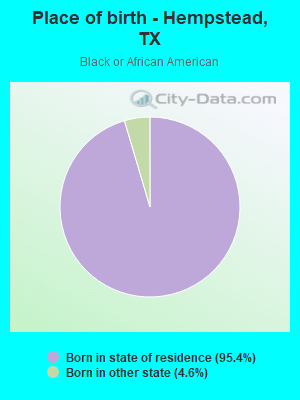
Place of birth - Born in state of residence (%) - Black or African American
Place of birth - Born in state of residence (%) - Asian
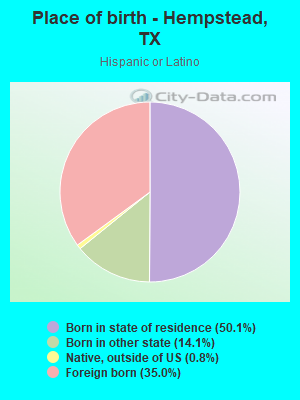
Place of birth - Born in state of residence (%) - Hispanic or Latino
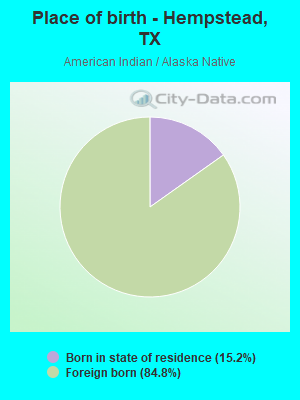
Place of birth - Born in state of residence (%) - American Indian and Alaska Native
Place of birth - Born in state of residence (%) - Multirace
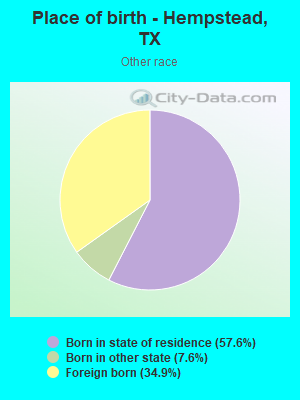
Place of birth - Born in state of residence (%) - Other Race
Place of birth - Born in other state (%)
Place of birth - Born in other state (%) - White
Place of birth - Born in other state (%) - Black or African American
Place of birth - Born in other state (%) - Asian
Place of birth - Born in other state (%) - Hispanic or Latino
Place of birth - Born in other state (%) - American Indian and Alaska Native
Place of birth - Born in other state (%) - Multirace
Place of birth - Born in other state (%) - Other Race
Place of birth - Native, outside of US (%)
Place of birth - Native, outside of US (%) - White
Place of birth - Native, outside of US (%) - Black or African American
Place of birth - Native, outside of US (%) - Asian
Place of birth - Native, outside of US (%) - Hispanic or Latino
Place of birth - Native, outside of US (%) - American Indian and Alaska Native
Place of birth - Native, outside of US (%) - Multirace
Place of birth - Native, outside of US (%) - Other Race
Place of birth - Foreign born (%)
Place of birth - Foreign born (%) - White
Place of birth - Foreign born (%) - Black or African American
Place of birth - Foreign born (%) - Asian
Place of birth - Foreign born (%) - Hispanic or Latino
Place of birth - Foreign born (%) - American Indian and Alaska Native
Place of birth - Foreign born (%) - Multirace
Place of birth - Foreign born (%) - Other Race
Residents speaking English at home (%)
Residents speaking English at home - Born in the United States (%)
Residents speaking English at home - Native, born elsewhere (%)
Residents speaking English at home - Foreign born (%)
Residents speaking Spanish at home (%)
Residents speaking Spanish at home - Born in the United States (%)
Residents speaking Spanish at home - Native, born elsewhere (%)
Residents speaking Spanish at home - Foreign born (%)
Residents speaking other language at home (%)
Residents speaking other language at home - Born in the United States (%)
Residents speaking other language at home - Native, born elsewhere (%)
Residents speaking other language at home - Foreign born (%)
Marital status - Never married (%)
Marital status - Now married (%)
Marital status - Separated (%)
Marital status - Widowed (%)
Marital status - Divorced (%)
Ancestries Reported - Arab (%)
Ancestries Reported - Czech (%)
Ancestries Reported - Danish (%)
Ancestries Reported - Dutch (%)
Ancestries Reported - English (%)
Ancestries Reported - French (%)
Ancestries Reported - French Canadian (%)
Ancestries Reported - German (%)
Ancestries Reported - Greek (%)
Ancestries Reported - Hungarian (%)
Ancestries Reported - Irish (%)
Ancestries Reported - Italian (%)
Ancestries Reported - Lithuanian (%)
Ancestries Reported - Norwegian (%)
Ancestries Reported - Polish (%)
Ancestries Reported - Portuguese (%)
Ancestries Reported - Russian (%)
Ancestries Reported - Scotch-Irish (%)
Ancestries Reported - Scottish (%)
Ancestries Reported - Slovak (%)
Ancestries Reported - Subsaharan African (%)
Ancestries Reported - Swedish (%)
Ancestries Reported - Swiss (%)
Ancestries Reported - Ukrainian (%)
Ancestries Reported - United States (%)
Ancestries Reported - Welsh (%)
Ancestries Reported - West Indian (%)
Ancestries Reported - Other (%)
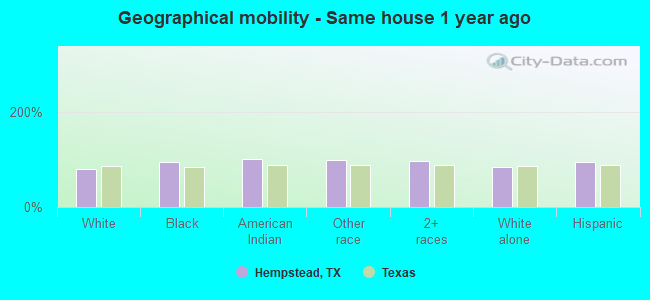
Geographical mobility - Same house 1 year ago (%)
Geographical mobility - Same house 1 year ago (%) - White
Geographical mobility - Same house 1 year ago (%) - Black or African American
Geographical mobility - Same house 1 year ago (%) - Asian
Geographical mobility - Same house 1 year ago (%) - Hispanic or Latino
Geographical mobility - Same house 1 year ago (%) - American Indian and Alaska Native
Geographical mobility - Same house 1 year ago (%) - Multirace
Geographical mobility - Same house 1 year ago (%) - Other Race
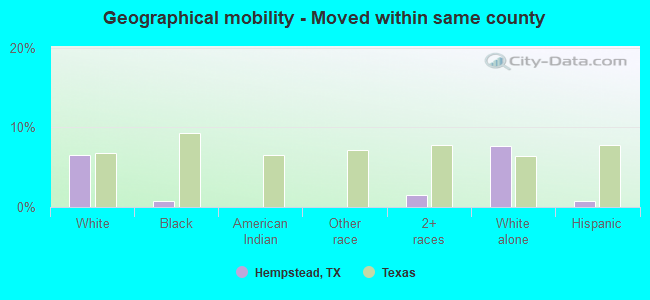
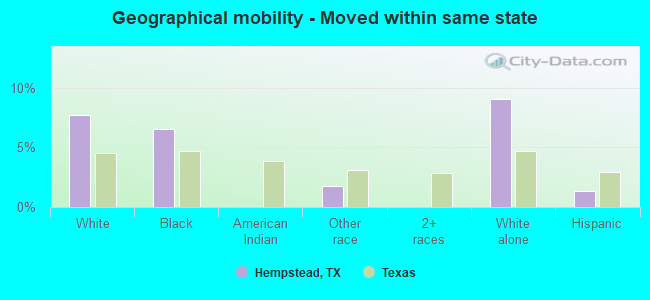
Geographical mobility - Moved within same county (%)
Geographical mobility - Moved within same county (%) - White
Geographical mobility - Moved within same county (%) - Black or African American
Geographical mobility - Moved within same county (%) - Asian
Geographical mobility - Moved within same county (%) - Hispanic or Latino
Geographical mobility - Moved within same county (%) - American Indian and Alaska Native
Geographical mobility - Moved within same county (%) - Multirace
Geographical mobility - Moved within same county (%) - Other Race
Geographical mobility - Moved from different county within same state (%)
Geographical mobility - Moved from different county within same state (%) - White
Geographical mobility - Moved from different county within same state (%) - Black or African American
Geographical mobility - Moved from different county within same state (%) - Asian
Geographical mobility - Moved from different county within same state (%) - Hispanic or Latino
Geographical mobility - Moved from different county within same state (%) - American Indian and Alaska Native
Geographical mobility - Moved from different county within same state (%) - Multirace
Geographical mobility - Moved from different county within same state (%) - Other Race
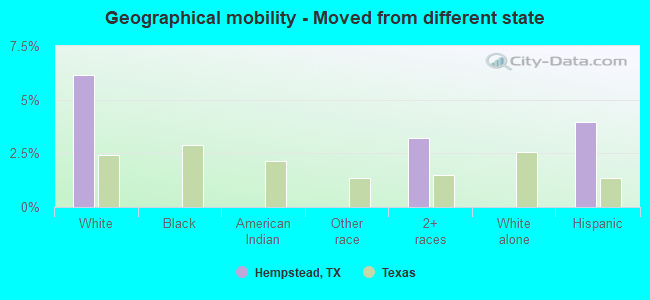
Geographical mobility - Moved from different state (%)
Geographical mobility - Moved from different state (%) - White
Geographical mobility - Moved from different state (%) - Black or African American
Geographical mobility - Moved from different state (%) - Asian
Geographical mobility - Moved from different state (%) - Hispanic or Latino
Geographical mobility - Moved from different state (%) - American Indian and Alaska Native
Geographical mobility - Moved from different state (%) - Multirace
Geographical mobility - Moved from different state (%) - Other Race
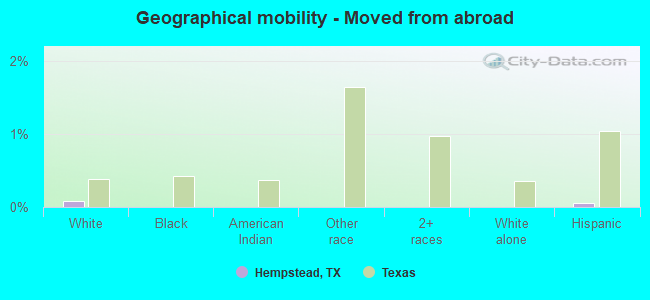
Geographical mobility - Moved from abroad (%)
Geographical mobility - Moved from abroad (%) - White
Geographical mobility - Moved from abroad (%) - Black or African American
Geographical mobility - Moved from abroad (%) - Asian
Geographical mobility - Moved from abroad (%) - Hispanic or Latino
Geographical mobility - Moved from abroad (%) - American Indian and Alaska Native
Geographical mobility - Moved from abroad (%) - Multirace
Geographical mobility - Moved from abroad (%) - Other Race
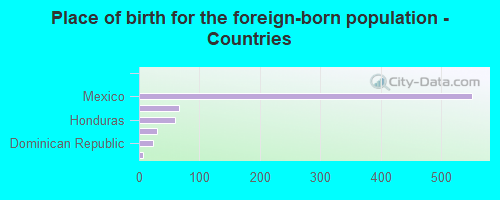
Place of birth for the foreign-born population - Ireland (%)
Place of birth for the foreign-born population - Denmark (%)
Place of birth for the foreign-born population - Norway (%)
Place of birth for the foreign-born population - Sweden (%)
Place of birth for the foreign-born population - United Kingdom (%)
Place of birth for the foreign-born population - England (%)
Place of birth for the foreign-born population - Scotland (%)
Place of birth for the foreign-born population - Other Northern Europe (%)
Place of birth for the foreign-born population - Austria (%)
Place of birth for the foreign-born population - Belgium (%)
Place of birth for the foreign-born population - France (%)
Place of birth for the foreign-born population - Germany (%)
Place of birth for the foreign-born population - Netherlands (%)
Place of birth for the foreign-born population - Switzerland (%)
Place of birth for the foreign-born population - Other Western Europe (%)
Place of birth for the foreign-born population - Greece (%)
Place of birth for the foreign-born population - Italy (%)
Place of birth for the foreign-born population - Portugal (%)
Place of birth for the foreign-born population - Spain (%)
Place of birth for the foreign-born population - Other Southern Europe (%)
Place of birth for the foreign-born population - Albania (%)
Place of birth for the foreign-born population - Belarus (%)
Place of birth for the foreign-born population - Bosnia and Herzegovina (%)
Place of birth for the foreign-born population - Bulgaria (%)
Place of birth for the foreign-born population - Croatia (%)
Place of birth for the foreign-born population - Czechoslovakia (%)
Place of birth for the foreign-born population - Hungary (%)
Place of birth for the foreign-born population - Latvia (%)
Place of birth for the foreign-born population - Lithuania (%)
Place of birth for the foreign-born population - North Macedonia (Macedonia) (%)
Place of birth for the foreign-born population - Moldova (%)
Place of birth for the foreign-born population - Poland (%)
Place of birth for the foreign-born population - Romania (%)
Place of birth for the foreign-born population - Russia (%)
Place of birth for the foreign-born population - Serbia (%)
Place of birth for the foreign-born population - Ukraine (%)
Place of birth for the foreign-born population - Other Eastern Europe (%)
Place of birth for the foreign-born population - China (%)
Place of birth for the foreign-born population - Hong Kong (%)
Place of birth for the foreign-born population - Taiwan (%)
Place of birth for the foreign-born population - Japan (%)
Place of birth for the foreign-born population - Korea (%)
Place of birth for the foreign-born population - Other Eastern Asia (%)
Place of birth for the foreign-born population - Afghanistan (%)
Place of birth for the foreign-born population - Bangladesh (%)
Place of birth for the foreign-born population - India (%)
Place of birth for the foreign-born population - Iran (%)
Place of birth for the foreign-born population - Kazakhstan (%)
Place of birth for the foreign-born population - Nepal (%)
Place of birth for the foreign-born population - Pakistan (%)
Place of birth for the foreign-born population - Sri Lanka (%)
Place of birth for the foreign-born population - Uzbekistan (%)
Place of birth for the foreign-born population - Other South Central Asia (%)
Place of birth for the foreign-born population - Burma (%)
Place of birth for the foreign-born population - Cambodia (%)
Place of birth for the foreign-born population - Indonesia (%)
Place of birth for the foreign-born population - Laos (%)
Place of birth for the foreign-born population - Malaysia (%)
Place of birth for the foreign-born population - Philippines (%)
Place of birth for the foreign-born population - Singapore (%)
Place of birth for the foreign-born population - Thailand (%)
Place of birth for the foreign-born population - Vietnam (%)
Place of birth for the foreign-born population - Other South Eastern Asia (%)
Place of birth for the foreign-born population - Armenia (%)
Place of birth for the foreign-born population - Iraq (%)
Place of birth for the foreign-born population - Israel (%)
Place of birth for the foreign-born population - Jordan (%)
Place of birth for the foreign-born population - Kuwait (%)
Place of birth for the foreign-born population - Lebanon (%)
Place of birth for the foreign-born population - Saudi Arabia (%)
Place of birth for the foreign-born population - Syria (%)
Place of birth for the foreign-born population - Turkey (%)
Place of birth for the foreign-born population - Yemen (%)
Place of birth for the foreign-born population - Other Western Asia (%)
Place of birth for the foreign-born population - Eritrea (%)
Place of birth for the foreign-born population - Ethiopia (%)
Place of birth for the foreign-born population - Kenya (%)
Place of birth for the foreign-born population - Somalia (%)
Place of birth for the foreign-born population - Uganda (%)
Place of birth for the foreign-born population - Zimbabwe (%)
Place of birth for the foreign-born population - Other Eastern Africa (%)
Place of birth for the foreign-born population - Cameroon (%)
Place of birth for the foreign-born population - Congo (%)
Place of birth for the foreign-born population - Democratic Republic of Congo (Zaire) (%)
Place of birth for the foreign-born population - Other Middle Africa (%)
Place of birth for the foreign-born population - Egypt (%)
Place of birth for the foreign-born population - Morocco (%)
Place of birth for the foreign-born population - Sudan (%)
Place of birth for the foreign-born population - Other Northern Africa (%)
Place of birth for the foreign-born population - South Africa (%)
Place of birth for the foreign-born population - Other Southern Africa (%)
Place of birth for the foreign-born population - Cabo Verde (%)
Place of birth for the foreign-born population - Ghana (%)
Place of birth for the foreign-born population - Liberia (%)
Place of birth for the foreign-born population - Nigeria (%)
Place of birth for the foreign-born population - Senegal (%)
Place of birth for the foreign-born population - Sierra Leone (%)
Place of birth for the foreign-born population - Other Western Africa (%)
Place of birth for the foreign-born population - Australia (%)
Place of birth for the foreign-born population - New Zealand (%)
Place of birth for the foreign-born population - Fiji (%)
Place of birth for the foreign-born population - Micronesia (%)
Place of birth for the foreign-born population - Bahamas (%)
Place of birth for the foreign-born population - Barbados (%)
Place of birth for the foreign-born population - Cuba (%)
Place of birth for the foreign-born population - Dominica (%)
Place of birth for the foreign-born population - Dominican Republic (%)
Place of birth for the foreign-born population - Grenada (%)
Place of birth for the foreign-born population - Haiti (%)
Place of birth for the foreign-born population - Jamaica (%)
Place of birth for the foreign-born population - St. Vincent and the Grenadines (%)
Place of birth for the foreign-born population - Trinidad and Tobago (%)
Place of birth for the foreign-born population - West Indies (%)
Place of birth for the foreign-born population - Other Caribbean (%)
Place of birth for the foreign-born population - Belize (%)
Place of birth for the foreign-born population - Costa Rica (%)
Place of birth for the foreign-born population - El Salvador (%)
Place of birth for the foreign-born population - Guatemala (%)
Place of birth for the foreign-born population - Honduras (%)
Place of birth for the foreign-born population - Mexico (%)
Place of birth for the foreign-born population - Nicaragua (%)
Place of birth for the foreign-born population - Panama (%)
Place of birth for the foreign-born population - Other Central America (%)
Place of birth for the foreign-born population - Argentina (%)
Place of birth for the foreign-born population - Bolivia (%)
Place of birth for the foreign-born population - Brazil (%)
Place of birth for the foreign-born population - Chile (%)
Place of birth for the foreign-born population - Colombia (%)
Place of birth for the foreign-born population - Ecuador (%)
Place of birth for the foreign-born population - Guyana (%)
Place of birth for the foreign-born population - Peru (%)
Place of birth for the foreign-born population - Uruguay (%)
Place of birth for the foreign-born population - Venezuela (%)
Place of birth for the foreign-born population - Other South America (%)
Place of birth for the foreign-born population - Canada (%)
Place of birth for the foreign-born population - Other Northern America (%)
Place of birth for the foreign-born population - Other (%)
Latest news about races in Hempstead, TX collected exclusively by city-data.com from local newspapers, TV, and radio stations
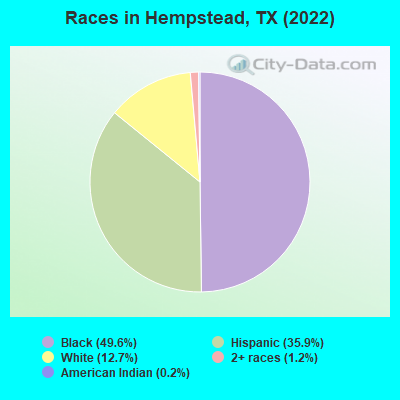
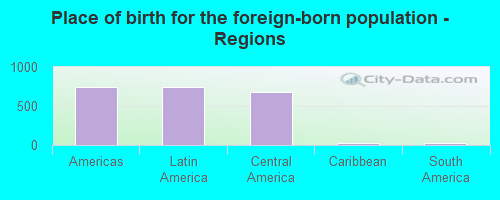
According to 2022 data, the most numerous races in Hempstead, TX are Hispanic (2,097 residents), White alone (739 residents), and Black alone (2,893 residents). 70.8% of Hempstead residents speak English at home. 12.7% of Hempstead, TX residents are foreign-born (12.6% born in Latin America), which is 34.1% less than the foreign-born rate of 17.0% across the entire state of Texas.
Race distribution in Hempstead
2000 2022
10,933,313 52.4% White alone 6,669,666 32.0% Hispanic 2,364,255 11.3% Black alone 554,445 2.7% Asian alone 230,567 1.1% Two or more races 68,859 0.3% American Indian alone 19,958 0.10% Other race alone 10,757 0.05% Native Hawaiian and Other
12,070,642 40.2% Hispanic 11,683,430 38.9% White alone 3,508,706 11.7% Black alone 1,608,173 5.4% Asian alone 956,560 3.2% Two or more races 125,763 0.4% Other race alone 47,023 0.2% American Indian alone 29,275 0.10% Native Hawaiian and Other
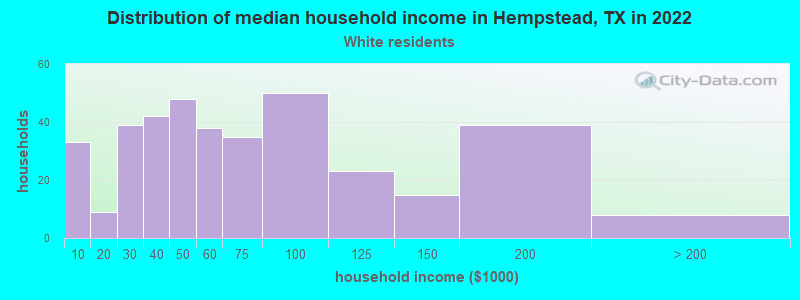
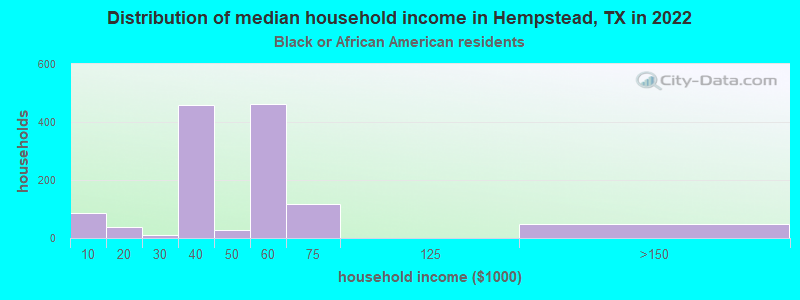
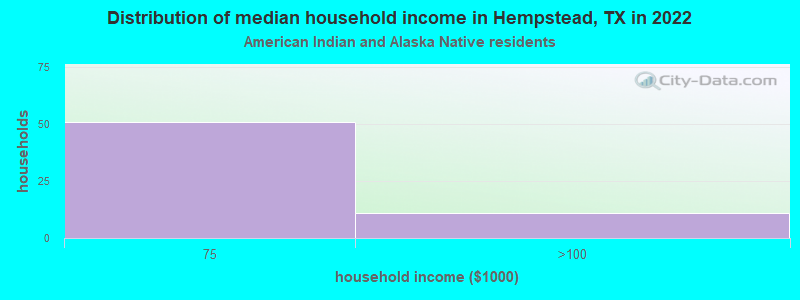
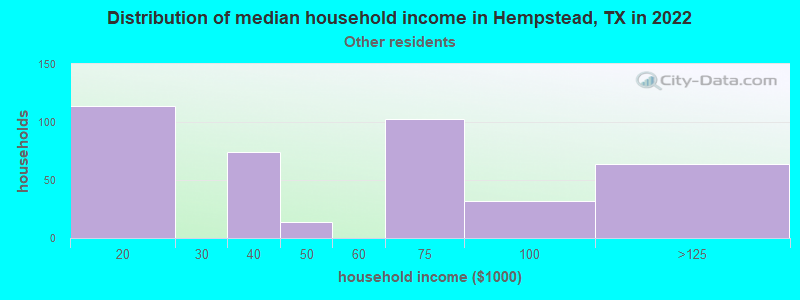
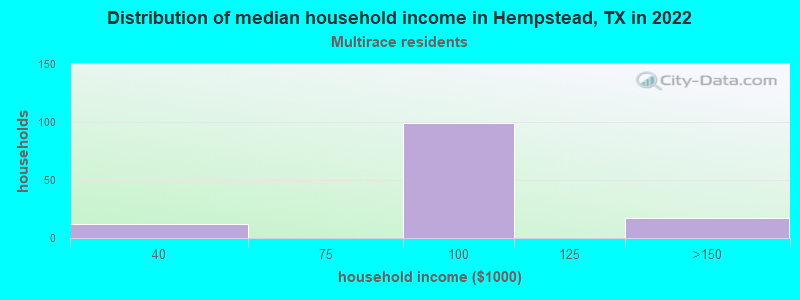
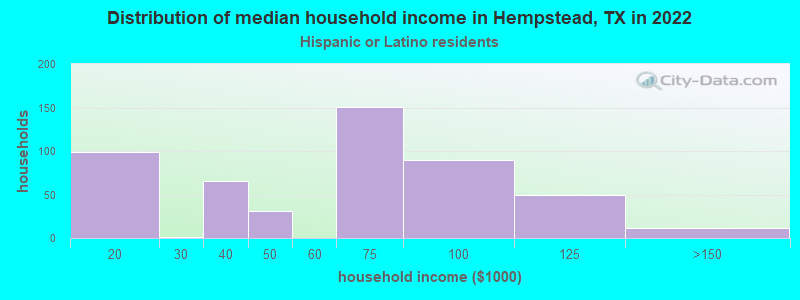
Income and house value in Hempstead Median household income in 2022 $52,092 White non-Hispanic householders$47,432 Black householders$82,624 Two or more races householders$70,383 Hispanic or Latino race householdersMedian 2022 house value $228,442 White Non-Hispanic householders$166,139 Black or African American householders$213,694 American Indian or Alaska Native householders$298,871 Some other race householders$265,462 Hispanic or Latino householders
Median age by race in Hempstead
59.2 Median age for White residents55.7 59.5 23.2 Median age for Black or African American residents22.7 26.4 45.8 Median age for American Indian / Alaska Native residents-682,445,758.7 -684,418,145.3 -681,278,538.1 Median age for Asian residents-683,426,442.5 -679,245,282.3 -581,560,283.1 Median age for Native Hawaiian / Pacific Islander residents-612,729,233.5 -577,777,777.2 17.8 Median age for Other race residents18.4 17.2 18.1 Median age for Two or more races residents18.4 11.0 57.4 Median age for White alone residents61.2 56.7 19.5 Median age for Hispanic or Latino residents19.7 18.4
Owner/renter occupied households by race in Hempstead
House owners and renters - White residents 206 54.5% Owner occupied172 45.5% Renter occupiedHouse owners and renters - Black or African American residents 55 4.5% Owner occupied1,167 95.5% Renter occupiedHouse owners and renters - American Indian / Alaska Native residents 61 100.0% Owner occupiedHouse owners and renters - Other race residents 210 51.0% Owner occupied201 49.0% Renter occupiedHouse owners and renters - Two or more races residents 118 90.9% Owner occupied12 9.1% Renter occupiedHouse owners and renters - White alone residents 211 54.9% Owner occupied173 45.1% Renter occupiedHouse owners and renters - Hispanic or Latino residents 298 59.6% Owner occupied202 40.4% Renter occupied
Language usage in Hempstead
English speakers - Total 70.8% of residents of Hempstead speak English at home.
28.9% of residents speak Spanish at home 882 56.5% Speak English very well680 43.5% Speak English less than very well
English speakers - Born in the United States 72.1% of residents of Hempstead speak English at home.
27.4% of residents speak Spanish at home 118 62.8% Speak English very well70 37.2% Speak English less than very well
English speakers - Native, born elsewhere 37.0% of residents of Hempstead speak English at home.
59.3% of residents speak Spanish at home 16 100.0% Speak English less than very well
English speakers - Foreign-born 4.6% of residents of Hempstead speak English at home.
94.3% of residents speak Spanish at home 193 27.7% Speak English very well505 72.3% Speak English less than very well
White (Caucasian) - Speak only English Native:
100.0% (790)Foreign-born:
100.0% (23)
White (Caucasian) - Speak another language Native:
0.8% (7)Foreign-born:
36.0% (8)
Other race - Speak only English Native:
3.3% (32)Foreign-born:
0.9% (6)
Other race - Speak another language Native:
94.5% (917)Foreign-born:
98.7% (628)
Two or more races - Speak another language Native:
57.6% (237)Foreign-born:
100.0% (188)
Hispanic or Latino - Speak only English Native:
23.4% (267)Foreign-born:
5.0% (37)
Hispanic or Latino - Speak another language Native:
76.1% (871)Foreign-born:
95.0% (701)
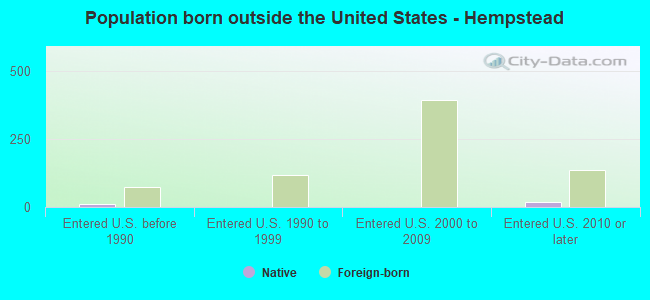
Foreign-born residents in Hempstead 740 residents are foreign born (12.6% Latin America ).
This city:
12.7%Texas:
17.1%
Marital status for residents in Hempstead Marital status - White (Caucasian) population 15 years and over
Males 53.5% Never married43.1% Now married0.0% Separated0.0% Widowed3.4% DivorcedFemales 36.1% Never married41.2% Now married0.0% Separated14.6% Widowed8.0% DivorcedWomen who did not give birth in the past 12 months Now married:
7.0% (11)Unmarried:
93.0% (151)
Marital status - Black or African American population 15 years and over
Males 89.2% Never married3.0% Now married0.0% Separated7.8% Widowed0.0% DivorcedFemales 81.3% Never married5.4% Now married10.3% Separated1.0% Widowed2.1% DivorcedWomen who gave birth in the past 12 months Now married:
0.0% (0)Unmarried:
100.0% (199)
Women who did not give birth in the past 12 months Now married:
7.3% (52)Unmarried:
92.7% (650)
Marital status - American Indian / Alaska Native population 15 years and over
Males 0.0% Never married17.9% Now married0.0% Separated0.0% Widowed82.1% DivorcedFemales 0.0% Never married19.5% Now married0.0% Separated0.0% Widowed80.5% DivorcedWomen who did not give birth in the past 12 months Now married:
0.0% (0)Unmarried:
100.0% (47)
Marital status - Other race population 15 years and over
Males 50.1% Never married49.9% Now married0.0% Separated0.0% Widowed0.0% DivorcedFemales 54.0% Never married33.2% Now married4.9% Separated8.0% Widowed0.0% DivorcedWomen who did not give birth in the past 12 months Now married:
38.1% (261)Unmarried:
61.9% (424)
Marital status - Two or more races population 15 years and over
Males 51.7% Never married32.2% Now married0.0% Separated0.0% Widowed16.1% DivorcedFemales 10.1% Never married64.6% Now married25.3% Separated0.0% Widowed0.0% DivorcedWomen who did not give birth in the past 12 months Now married:
89.9% (116)Unmarried:
10.1% (13)
Marital status - White alone, not Hispanic / Latino population 15 years and over
Males 38.9% Never married56.4% Now married0.0% Separated0.0% Widowed4.7% DivorcedFemales 37.3% Never married35.2% Now married0.0% Separated17.8% Widowed9.7% DivorcedWomen who did not give birth in the past 12 months Now married:
8.1% (14)Unmarried:
91.9% (158)
Marital status - Hispanic or Latino population 15 years and over
Males 55.5% Never married35.8% Now married0.0% Separated0.0% Widowed8.7% DivorcedFemales 44.2% Never married39.3% Now married6.2% Separated5.8% Widowed4.4% DivorcedWomen who did not give birth in the past 12 months Now married:
40.8% (271)Unmarried:
59.2% (393)
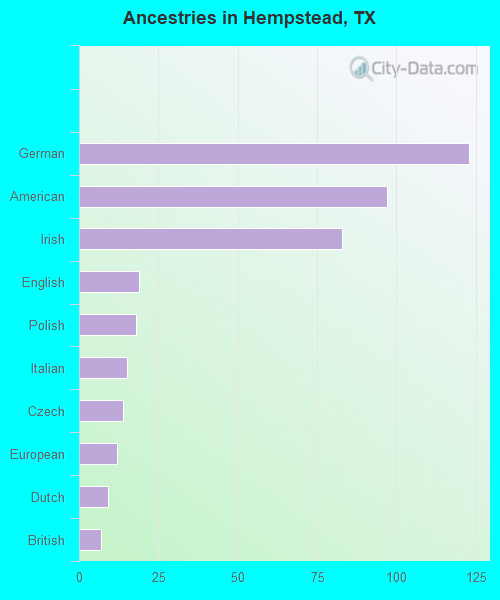
Ancestries in Hempstead
123 3.0% German97 2.4% American83 2.0% Irish19 0.5% English18 0.4% Polish15 0.4% Italian14 0.3% Czech12 0.3% European9 0.2% Dutch7 0.2% British
Children Nativity (place of birth) in Hempstead
Children under 6 years - Living with two parents Both parents native 2 100.0% NativeBoth parents foreign-born 31 100.0% NativeOne native, one foreign-born parent 16 100.0% NativeChildren under 6 years - Living with one parent Native parent 274 100.0% NativeForeign-born parent 136 100.0% NativeChildren 6 to 17 years - Living with two parents Both parents native 25 99.1% Native0 0.9% Foreign-bornBoth parents foreign-born 318 86.5% Native50 13.5% Foreign-bornOne native, one foreign-born parent 143 100.0% NativeChildren 6 to 17 years - Living with one parent Native parent 661 100.0% NativeForeign-born parent 50 50.5% Native49 49.5% Foreign-born