Highland Village, TX (Texas) Houses and Residents
| Highland Village: | $522,034 |
| Texas: | $275,400 |
Total population: 15,995 (Urban population: 12,106, Rural population: 57 (all nonfarm))
Houses: 5,791 (5,697 occupied: 5,359 owner occupied, 389 renter occupied)
| % of renters here: | 7% |
| State: | 38% |
Housing density: 1,050 houses/condos per square mile
Median price asked for vacant for-sale houses and condos in 2022 in this county: $270,827.
Median contract rent in 2022: over $2,000 (lower quartile is $1,818, upper quartile is over $2,000)
Median gross rent in Highland Village, TX in 2022: over $2,000
Housing units in Highland Village with a mortgage: 3,759 (187 second mortgage, 0 home equity loan, 109 both second mortgage and home equity loan)
Houses without a mortgage: 63
Median household income for houses/condos with a mortgage: $182,451
Median household income for apartments without a mortgage: $133,567
Median monthly housing costs: $2,428
Compare current foreclosures near Highland Village, TX:
| Photo | Address | Area | Beds / Baths | Price | Details |
|---|---|---|---|---|---|

|
#1
Teal Cove Ln
Little Elm, TX 75068
|
3,560 sq. feet
|
2 baths 3 beds |
show details | |

|
#2
Sarah Brooks Dr
Keller, TX 76248
|
2,360 sq. feet
|
2 baths 4 beds |
show details | |

|
#3
Nantucket Dr
Aubrey, TX 76227
|
2,083 sq. feet
|
2 baths 3 beds |
show details | |

|
#4
Waterfall Ln
Little Elm, TX 75068
|
- sq. feet
|
2 baths 3 beds |
show details | |

|
#5
Beaver Creek Ave
Denton, TX 76207
|
- sq. feet
|
2 baths 3 beds |
show details | |

|
#6
Fountainview Dr
Irving, TX 75039
|
4,603 sq. feet
|
6 baths 5 beds |
show details | |

|
#7
Appalachian Ln
Aubrey, TX 76227
|
2,323 sq. feet
|
2 baths 3 beds |
show details | |

|
#8
Renmuir Drive
Prosper, TX 75078
|
- sq. feet
|
4 baths 5 beds |
show details | |

|
#9
Jasmine Trl
Aubrey, TX 76227
|
3,126 sq. feet
|
2 baths 3 beds |
show details | |

|
#10
Thistle Sage Ct
Irving, TX 75063
|
1,557 sq. feet
|
2 baths 3 beds |
show details |
| Photo | Address | Area | Beds / Baths | Price | Details |
|---|---|---|---|---|---|

|
#11
Evergreen Dr
Keller, TX 76244
|
2,144 sq. feet
|
2 baths 3 beds |
show details | |

|
#12
Sundrop Drive
Little Elm, TX 75068
|
- sq. feet
|
3 baths 4 beds |
show details | |

|
#13
River Meadows Ln
Argyle, TX 76226
|
3,212 sq. feet
|
3 baths 3 beds |
show details | |

|
#14
Creekstone Dr
Plano, TX 75093
|
1,943 sq. feet
|
2 baths 3 beds |
show details | |

|
#15
Sancerre Ln
Carrollton, TX 75007
|
1,815 sq. feet
|
2 baths 3 beds |
show details | |

|
#16
Vernon Dr
Aubrey, TX 76227
|
1,624 sq. feet
|
2 baths 3 beds |
show details | |

|
#17
Blue Azalea
Aubrey, TX 76227
|
- sq. feet
|
3 baths 4 beds |
show details | |

|
#18
Luther Rd
Irving, TX 75063
|
1,975 sq. feet
|
3 baths 2 beds |
show details | |

|
#19
Benbrook Dr
Carrollton, TX 75007
|
1,691 sq. feet
|
1 baths 3 beds |
show details | |

|
#20
Mustang Ct
Little Elm, TX 75068
|
1,040 sq. feet
|
2 baths 3 beds |
show details |
| Photo | Address | Area | Beds / Baths | Price | Details |
|---|---|---|---|---|---|

|
#21
Bear Run Dr
Plano, TX 75093
|
2,389 sq. feet
|
4 baths 5 beds |
show details | |

|
#22
Hampton Dr
Little Elm, TX 75068
|
1,380 sq. feet
|
2 baths 3 beds |
show details | |

|
#23
Creek Crossing Dr
Justin, TX 76247
|
1,833 sq. feet
|
2 baths 3 beds |
show details | |

|
#24
Morning Song Dr
Little Elm, TX 75068
|
1,615 sq. feet
|
2 baths 3 beds |
show details | |

|
#25
Coit St
Denton, TX 76201
|
878 sq. feet
|
1 baths 2 beds |
show details | |

|
#26
Apple Dr
Little Elm, TX 75068
|
3,063 sq. feet
|
2 baths 5 beds |
show details | |

|
#27
Chatsworth Ct E
Colleyville, TX 76034
|
5,558 sq. feet
|
4 baths 5 beds |
show details | |

|
#28
Plum Ct
Little Elm, TX 75068
|
2,609 sq. feet
|
2 baths 4 beds |
show details | |

|
#29
Eaton Ln
Grapevine, TX 76051
|
1,900 sq. feet
|
2 baths 3 beds |
show details | |

|
#30
Diamond Cluster
Carrollton, TX 75010
|
2,880 sq. feet
|
2 baths 3 beds |
show details |
| Photo | Address | Area | Beds / Baths | Price | Details |
|---|---|---|---|---|---|

|
#31
Ramada Trl
Justin, TX 76247
|
2,093 sq. feet
|
2 baths 3 beds |
show details | |

|
#32
Lariat Dr
Justin, TX 76247
|
1,860 sq. feet
|
2 baths 3 beds |
show details | |

|
#33
Cimarron Dr
Roanoke, TX 76262
|
1,759 sq. feet
|
2 baths 3 beds |
show details | |

|
#34
Tarrytown Pl
Carrollton, TX 75007
|
2,031 sq. feet
|
2 baths 3 beds |
show details | |

|
#35
Shawnee Trl
Justin, TX 76247
|
1,647 sq. feet
|
2 baths 3 beds |
show details | |

|
#36
Vista Greens Dr
Keller, TX 76244
|
1,445 sq. feet
|
2 baths 3 beds |
show details | |

|
#37
Dove Creek Trl
Southlake, TX 76092
|
3,436 sq. feet
|
3 baths 4 beds |
show details | |

|
#38
Confidence Dr
Keller, TX 76244
|
2,520 sq. feet
|
2 baths 3 beds |
show details | |

|
#39
Foxfield
Justin, TX 76247
|
1,647 sq. feet
|
2 baths 3 beds |
show details | |

|
#40
Brockway Dr
Dallas, TX 75234
|
1,147 sq. feet
|
1 baths 3 beds |
show details |
| Photo | Address | Area | Beds / Baths | Price | Details |
|---|---|---|---|---|---|

|
#41
Sumac Dr
Little Elm, TX 75068
|
2,292 sq. feet
|
2 baths 4 beds |
show details | |

|
#42
Saint Monet Dr
Irving, TX 75038
|
2,605 sq. feet
|
3 baths 4 beds |
show details | |

|
#43
Grand Fir Dr
Little Elm, TX 75068
|
2,048 sq. feet
|
2 baths 4 beds |
show details | |

|
#44
Prescott Dr
Frisco, TX 75033
|
2,832 sq. feet
|
3 baths 4 beds |
show details | |

|
#45
Rutledge Ct
The Colony, TX 75056
|
1,433 sq. feet
|
2 baths 3 beds |
show details | |

|
#46
Hartford Dr
Carrollton, TX 75007
|
2,384 sq. feet
|
2 baths 3 beds |
show details | |

|
#47
Tisbury Way
Little Elm, TX 75068
|
2,698 sq. feet
|
3 baths 4 beds |
show details | |

|
#48
Eagle Mountain Dr
Little Elm, TX 75068
|
1,761 sq. feet
|
3 baths 4 beds |
show details | |

|
#49
Diamond Ridge Ct
Carrollton, TX 75010
|
1,979 sq. feet
|
2 baths 3 beds |
show details | |

|
Check over 1 million property listings on Foreclosure.com!
|
browse all offers | |||


Median year apartment built: 2016
Household type by relationship:
Households: 16,966- Male householders: 2,949 (296 living alone), Female householders: 2,729 (511 living alone)
4,342 spouses (4,303 opposite-sex spouses), 128 unmarried partners, (120 opposite-sex unmarried partners), 5,752 children (5,347 natural, 170 adopted, 233 stepchildren), 273 grandchildren, 43 brothers or sisters, 291 parents, 40 foster children, 185 other relatives, 168 non-relatives
- In group quarters: 60
Size of family households: 1,780 2-persons, 1,115 3-persons, 1,198 4-persons, 470 5-persons, 192 6-persons, 31 7-or-more-persons.
Size of nonfamily households: 823 1-person, 86 2-persons, 13 5-persons.
3,486 married couples with children.
251 single-parent households (67 men, 184 women).
89.8% of residents of Highland Village speak English at home.
5.0% of residents speak Spanish at home (95% speak English very well, 2% speak English well, 3% speak English not well).
3.1% of residents speak other Indo-European language at home (69% speak English very well, 31% speak English well).
1.4% of residents speak Asian or Pacific Island language at home (52% speak English very well, 34% speak English well, 7% speak English not well, 7% don't speak English at all).
0.5% of residents speak other language at home (65% speak English very well, 19% speak English well, 15% speak English not well).
Foreign born population: 1,167 (6.9%)
(63.5% of them are naturalized citizens)
| Here: | 10.0 |
| State: | 6.3 |
| Here: | 4.1 |
| State: | 4.0 |

- Bedrooms in owner-occupied houses and condos in Highland Village, Texas
- 40no bedroom
- 01 bedroom
- 962 bedrooms
- 1,5733 bedrooms
- 2,6804 bedrooms
- 9715+ bedrooms

- Bedrooms in renter-occupied apartments in Highland Village, Texas
- 30no bedroom
- 571 bedroom
- 1682 bedrooms
- 303 bedrooms
- 514 bedrooms
- 535+ bedrooms

- Cars and other vehicles available in Highland Village in owner-occupied houses/condos
- 48no vehicle
- 5661 vehicle
- 2,5522 vehicles
- 1,4313 vehicles
- 5744 vehicles
- 1895+ vehicles

- Cars and other vehicles available in Highland Village in renter-occupied apartments
- 49no vehicle
- 1881 vehicle
- 992 vehicles
- 533 vehicles
- 04 vehicles
- 05+ vehicles

- Rooms in owner-occupied houses in Highland Village, Texas
- 301 room
- 02 rooms
- 233 rooms
- 924 rooms
- 2015 rooms
- 4126 rooms
- 7997 rooms
- 1,0128 rooms
- 2,7909+ rooms

- Rooms in renter-occupied apartments in Highland Village, Texas
- 301 room
- 252 rooms
- 833 rooms
- 774 rooms
- 405 rooms
- 06 rooms
- 87 rooms
- 478 rooms
- 809+ rooms


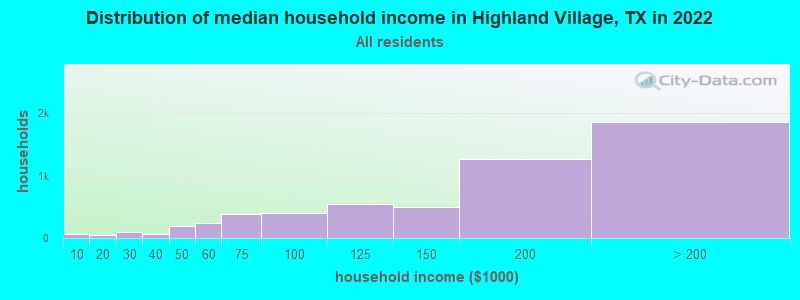
Highland Village, TX household income distribution

- 63Less than $10,000
- 55$10,000 to $19,999
- 100$20,000 to $29,999
- 63$30,000 to $39,999
- 195$40,000 to $49,999
- 240$50,000 to $59,999
- 385$60,000 to $74,999
- 401$75,000 to $99,999
- 551$100,000 to $124,999
- 501$125,000 to $149,999
- 1,272$150,000 to $199,999
- 1,858$200,000 or more
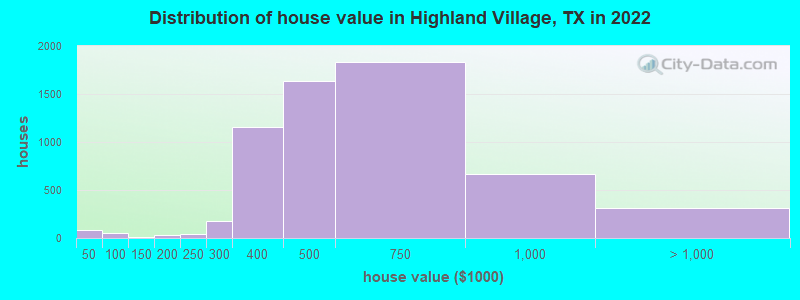
Home value of owner - occupied houses in 2022 in Highland Village, TX
-
- 17Less than $10,000
- 26$35,000 to $39,999
- 35$40,000 to $49,999
- 13$50,000 to $59,999
- 7$100,000 to $124,999
- 4$125,000 to $149,999
- 21$150,000 to $174,999
- 7$175,000 to $199,999
- 42$200,000 to $249,999
- 180$250,000 to $299,999
- 1,158$300,000 to $399,999
- 1,635$400,000 to $499,999
- 1,834$500,000 to $749,999
- 669$750,000 to $999,999
- 307$1,000,000 to $1,499,999
Rent paid by renters in 2022 in Highland Village, TX
-
- 6$1,000 to $1,249
- 44$1,250 to $1,499
- 109$1,500 to $1,999
- 161$2,000 to $2,499
- 46$2,500 to $2,999
- 51$3,000 to $3,499
- 36$3,500 or more
- 6No cash rent


Percentage of workers working in this county: 70.7%
Number of people working at home: 2,948 (33.3% of all workers)
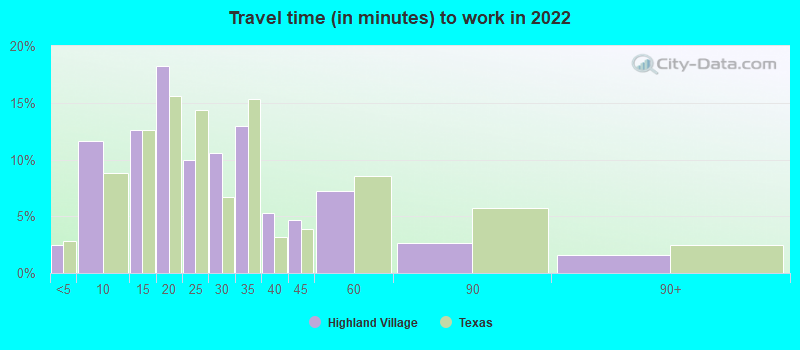
Travel time to work (commute)
- Less than 5 minutes: 181
- 5 to 9 minutes: 601
- 10 to 14 minutes: 566
- 15 to 19 minutes: 583
- 20 to 24 minutes: 568
- 25 to 29 minutes: 525
- 30 to 34 minutes: 1,494
- 35 to 39 minutes: 377
- 40 to 44 minutes: 437
- 45 to 59 minutes: 415
- 60 to 89 minutes: 283
- 90 or more minutes: 112
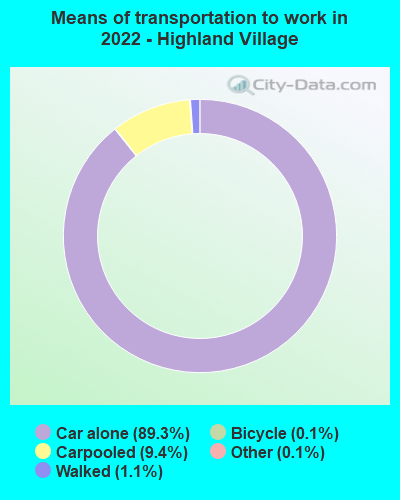
Means of transportation to work:
- Drove a car alone: 4,817 (58.9%)
- Carpooled: 432 (5.3%)
- Taxi: 7 (0.1%)
- Bicycle: 5 (0.1%)
- Walked: 51 (0.6%)
- Worked at home: 2,948 (36.0%)

- Unemployment by race in 2022
- Unemployment rate for White non-Hispanic residents
- 3.3%Males
- 1.2%Females
- Unemployment rate for Asian residents
- 8.9%Males
- 11.1%Females
- Unemployment rate for other race residents
- 16.7%Males
- 20.4%Females
- Unemployment rate for Hispanic or Latino residents
- 2.1%Males

- Year of entry for the foreign-born population in Highland Village, Texas
- 4582010 or later
- 2232000 to 2009
- 1451990 to 1999
- 2001980 to 1989
- 801970 to 1979
- 116Before 1970
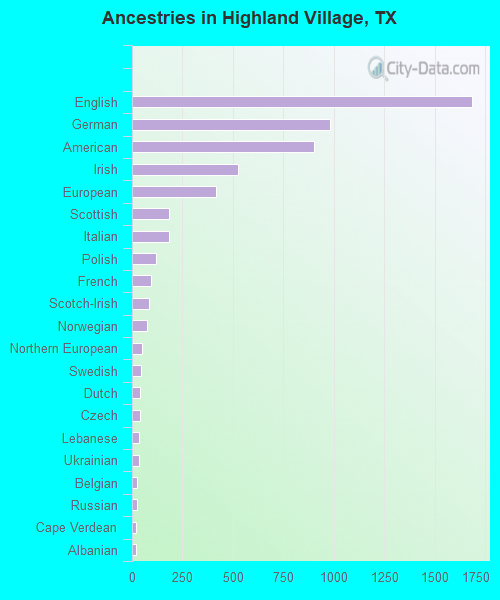
First ancestries reported:
- English: 1,684 (23.6%)
- German: 981 (13.7%)
- American: 902 (12.6%)
- Irish: 526 (7.4%)
- European: 417 (5.8%)
- Scottish: 185 (2.6%)
- Italian: 183 (2.6%)
- Polish: 119 (1.7%)
- French: 93 (1.3%)
- Scotch-Irish: 86 (1.2%)
- Norwegian: 76 (1.1%)
- Northern European: 50 (0.7%)
- Swedish: 47 (0.7%)
- Dutch: 42 (0.6%)
- Czech: 39 (0.5%)
- Lebanese: 37 (0.5%)
- Ukrainian: 37 (0.5%)
- Belgian: 27 (0.4%)
- Russian: 25 (0.4%)
- Cape Verdean: 21 (0.3%)
- Albanian: 18 (0.3%)
- Nigerian: 13 (0.2%)
- Ethiopian: 12 (0.2%)
- Serbian: 11 (0.2%)
- Hungarian: 11 (0.2%)
- Eastern European: 10 (0.1%)
- British: 10 (0.1%)
- Scandinavian: 10 (0.1%)
- French Canadian: 9 (0.1%)
- Slovak: 9 (0.1%)
- Egyptian: 8 (0.1%)
- Danish: 8 (0.1%)
- Welsh: 8 (0.1%)
- Austrian: 4 (0.06%)
- Czechoslovakian: 3 (0.04%)
Most common places of birth for foreign-born residents (%):
| Highland Village: | 10.7% (117) |
| Texas: | 1.2% (61,555) |
| Highland Village: | 6.9% (76) |
| Texas: | 6.1% (306,347) |
| Highland Village: | 6.5% (71) |
| Texas: | 48.4% (2,411,723) |
| Highland Village: | 6.3% (69) |
| Texas: | 0.4% (17,796) |
| Highland Village: | 6.0% (66) |
| Texas: | 0.0% (1,086) |
| Highland Village: | 5.9% (64) |
| Texas: | 1.2% (60,172) |
| Highland Village: | 5.5% (60) |
| Texas: | 0.2% (9,654) |
| Highland Village: | 5.1% (56) |
| Texas: | 2.3% (115,558) |
| Highland Village: | 4.5% (49) |
| Texas: | 0.8% (37,989) |
| Highland Village: | 4.3% (47) |
| Texas: | 0.5% (26,969) |
| Highland Village: | 4.1% (45) |
| Texas: | 0.2% (7,897) |
| Highland Village: | 3.7% (40) |
| Texas: | 0.0% (120) |
| Highland Village: | 3.2% (35) |
| Texas: | 0.4% (20,885) |
| Highland Village: | 2.8% (31) |
| Texas: | 0.1% (5,917) |
| Highland Village: | 2.8% (31) |
| Texas: | 0.2% (9,332) |
| Highland Village: | 2.7% (29) |
| Texas: | 0.3% (16,984) |
| Highland Village: | 1.7% (19) |
| Texas: | 0.2% (9,629) |
| Highland Village: | 1.6% (18) |
| Texas: | 0.0% (1,871) |
| Highland Village: | 1.6% (17) |
| Texas: | 0.6% (27,844) |
| Highland Village: | 1.6% (17) |
| Texas: | 1.1% (55,371) |
Place of birth for U.S.-born residents:
- This state: 7,915
- Other state: 7,655
- Northeast: 1,043
- Midwest: 2,571
- South: 1,965
- West: 2,069
93.2% of Highland Village residents lived in the same house 1 years ago.
Out of people who lived in different houses, 31.1% lived in this county.
Out of people who lived in different counties, 64.3% lived in Texas.
| Highland Village: | 93.2% |
| State average: | 85.7% |
Education attainment for males 25 years and older:
- No schooling: 35
- Nursery to 4th grade: 3
- 5th and 6th grade: 0
- 7th and 8th grade: 0
- 9th grade: 0
- 10th grade: 5
- 11th grade: 0
- 12th grade, no diploma: 53
- High school graduate (or equivalency): 580
- Less than 1 year of college: 339
- Some college more than 1 year, no degree: 879
- Associate degree: 411
- Bachelor's degree: 2,427
- Master's degree: 807
- Professional school degree: 140
- Doctorate degree: 166

Education attainment for females 25 years and older:
- No schooling: 25
- Nursery to 4th grade: 13
- 5th and 6th grade: 0
- 7th and 8th grade: 24
- 9th grade: 0
- 10th grade: 21
- 11th grade: 14
- 12th grade, no diploma: 39
- High school graduate (or equivalency): 766
- Less than 1 year of college: 342
- Some college more than 1 year, no degree: 707
- Associate degree: 493
- Bachelor's degree: 2,381
- Master's degree: 950
- Professional school degree: 70
- Doctorate degree: 41


Housing units in structures:
- One, detached: 5,534
- One, attached: 5
- 3 or 4: 20
- 10 to 19: 11
- 20 to 49: 125
- 50 or more: 94
House/condo owner moved in on average 11 years ago
Renter moved in on average 3 years ago

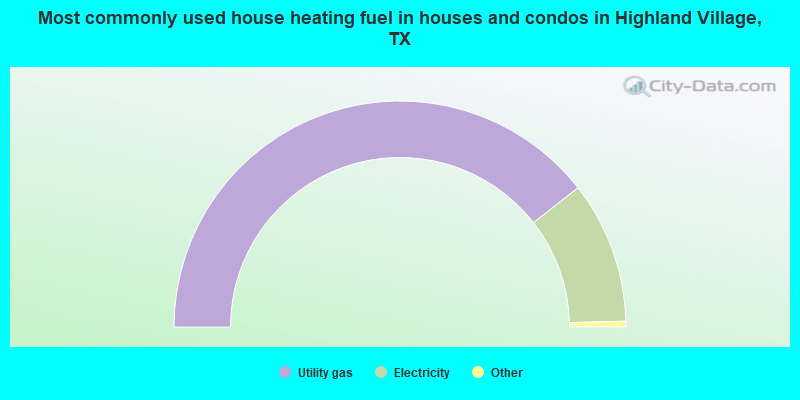
- 78.9%Utility gas
- 20.3%Electricity
- 0.7%Bottled, tank, or LP gas
- 0.1%Other fuel
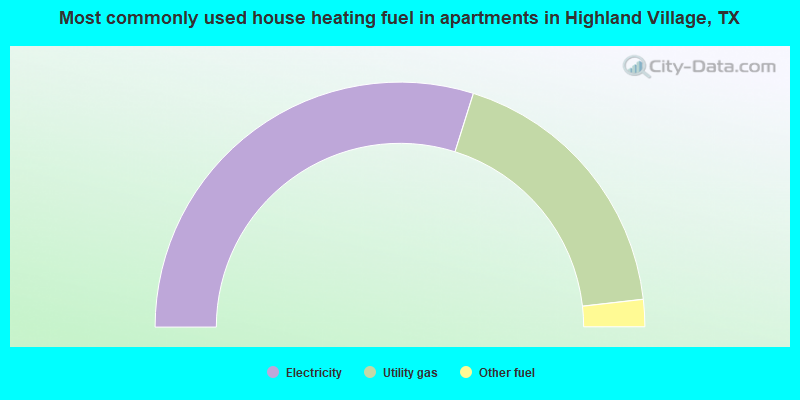
- 59.7%Electricity
- 36.7%Utility gas
- 3.6%Other fuel
Private vs. public school enrollment:
| Here: | 5.8% |
| Texas: | 8.8% |
| Here: | 8.0% |
| Texas: | 8.0% |
| Here: | 14.4% |
| Texas: | 16.2% |


