Leon Valley, TX (Texas) Houses and Residents
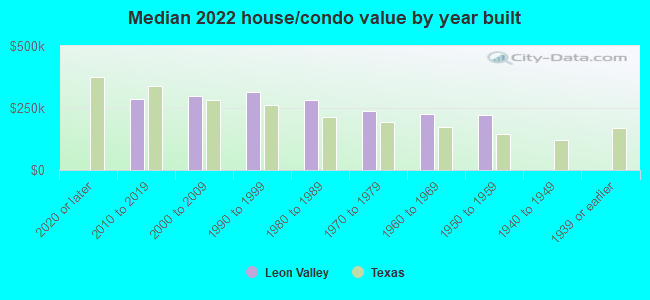
| Leon Valley: | $251,621 |
| Texas: | $275,400 |
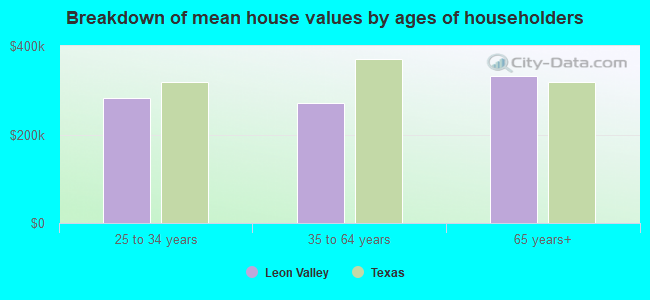
Mean price in 2022:
Detached houses: $266,126
Here: $266,126 State: $369,058 Townhouses or other attached units: $177,525
Here: $177,525 State: $327,631
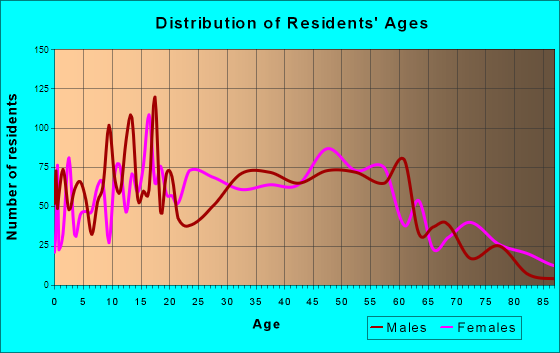
Total population: 11,015 (Urban population: 9,386, Rural population: 0)
Houses: 5,202 (4,760 occupied: 2,652 owner occupied, 2,103 renter occupied)
| % of renters here: | 44% |
| State: | 38% |
Housing density: 1,525 houses/condos per square mile
Median price asked for vacant for-sale houses and condos in 2022: $245,965.
Median contract rent in 2022: $1,016 (lower quartile is $819, upper quartile is $1,227)
Median rent asked for vacant for-rent units in 2022: $1,076
Median gross rent in Leon Valley, TX in 2022: $1,147
Housing units in Leon Valley with a mortgage: 1,515 (174 second mortgage, 0 home equity loan, 128 both second mortgage and home equity loan)
Houses without a mortgage: 38
Median household income for houses/condos with a mortgage: $80,207
Median household income for apartments without a mortgage: $77,667
Median monthly housing costs: $1,140
Compare current foreclosures near Leon Valley, TX:
| Photo | Address | Area | Beds / Baths | Price | Details |
|---|---|---|---|---|---|

|
#1
Cincinnati Ave
San Antonio, TX 78228
|
1,385 sq. feet
|
1 baths 3 beds |
$104,000
|
show details |

|
#2
Timber Park St
San Antonio, TX 78250
|
1,750 sq. feet
|
2 baths 3 beds |
$239,900
|
show details |

|
#3
Treehouse Dr
San Antonio, TX 78222
|
1,342 sq. feet
|
2 baths 3 beds |
$204,250
|
show details |

|
#4
Wind Crown
San Antonio, TX 78239
|
- sq. feet
|
2 baths 3 beds |
$285,000
|
show details |

|
#5
Sunrise Pass
San Antonio, TX 78244
|
912 sq. feet
|
1 baths 3 beds |
$32,500
|
show details |

|
#6
W Woodlawn Ave
San Antonio, TX 78228
|
- sq. feet
|
1 baths 3 beds |
show details | |

|
#7
Pebble Walk
San Antonio, TX 78217
|
1,973 sq. feet
|
2 baths 3 beds |
show details | |

|
#8
Eight Iron
San Antonio, TX 78221
|
- sq. feet
|
4 baths 5 beds |
show details | |

|
#9
SW 37th St
San Antonio, TX 78237
|
1,356 sq. feet
|
1 baths 3 beds |
show details | |

|
#10
Bright Chase
San Antonio, TX 78253
|
3,014 sq. feet
|
3 baths 4 beds |
show details |
| Photo | Address | Area | Beds / Baths | Price | Details |
|---|---|---|---|---|---|

|
#11
Shady Lake Dr
San Antonio, TX 78244
|
1,309 sq. feet
|
2 baths 3 beds |
show details | |

|
#12
Sapphire Riv
San Antonio, TX 78245
|
1,895 sq. feet
|
2 baths 4 beds |
show details | |

|
#13
Pleasanton Rd
San Antonio, TX 78214
|
1,459 sq. feet
|
2 baths 4 beds |
show details | |

|
#14
Cavalier Ave
San Antonio, TX 78225
|
1,408 sq. feet
|
2 baths 3 beds |
show details | |

|
#15
View Mdw
San Antonio, TX 78258
|
- sq. feet
|
2 baths 3 beds |
show details | |

|
#16
Whitby Tower
San Antonio, TX 78258
|
2,209 sq. feet
|
3 baths 3 beds |
show details | |

|
#17
Emerald Pl
San Antonio, TX 78245
|
1,609 sq. feet
|
2 baths 3 beds |
show details | |

|
#18
Aurora Fld
San Antonio, TX 78245
|
1,554 sq. feet
|
2 baths 4 beds |
show details | |

|
#19
Interstate 35
San Antonio, TX 78208
|
- sq. feet
|
2 baths 2 beds |
show details | |

|
#20
Sentry Pt
San Antonio, TX 78233
|
2,999 sq. feet
|
2 baths 4 beds |
show details |
| Photo | Address | Area | Beds / Baths | Price | Details |
|---|---|---|---|---|---|

|
#21
E Queens Crown St
San Antonio, TX 78233
|
- sq. feet
|
2 baths 3 beds |
show details | |

|
#22
Texas Ave
San Antonio, TX 78228
|
2,083 sq. feet
|
2 baths 4 beds |
show details | |

|
#23
Spearwood
San Antonio, TX 78233
|
1,975 sq. feet
|
2 baths 3 beds |
show details | |

|
#24
Indigo Crk
San Antonio, TX 78239
|
2,651 sq. feet
|
3 baths 4 beds |
show details | |

|
#25
Spring Lark St
San Antonio, TX 78249
|
1,152 sq. feet
|
2 baths 3 beds |
show details | |

|
#26
County Road 3829
San Antonio, TX 78253
|
1,320 sq. feet
|
3 baths 3 beds |
show details | |

|
#27
Zephyr Dr
San Antonio, TX 78239
|
2,196 sq. feet
|
2 baths 3 beds |
show details | |

|
#28
Idared
San Antonio, TX 78252
|
- sq. feet
|
2 baths 4 beds |
show details | |

|
#29
Colonia
San Antonio, TX 78254
|
3,288 sq. feet
|
2 baths 4 beds |
show details | |

|
#30
Wood Sorrel
San Antonio, TX 78247
|
2,334 sq. feet
|
2 baths 4 beds |
show details |
| Photo | Address | Area | Beds / Baths | Price | Details |
|---|---|---|---|---|---|

|
#31
Eclipse St
San Antonio, TX 78219
|
1,568 sq. feet
|
2 baths 3 beds |
show details | |

|
#32
Perseus Brook
San Antonio, TX 78252
|
- sq. feet
|
2 baths 5 beds |
show details | |

|
#33
Green Glen Dr
San Antonio, TX 78255
|
1,322 sq. feet
|
2 baths 3 beds |
show details | |

|
#34
Perseus Brk
San Antonio, TX 78252
|
2,536 sq. feet
|
3 baths 5 beds |
show details | |

|
#35
Rubidoux Dr
San Antonio, TX 78228
|
864 sq. feet
|
1 baths 4 beds |
show details | |

|
#36
King Ave
San Antonio, TX 78211
|
2,165 sq. feet
|
2 baths 3 beds |
show details | |

|
#37
Quail Pass
San Antonio, TX 78249
|
2,493 sq. feet
|
4 baths 3 beds |
show details | |

|
#38
Blue Jasmine
San Antonio, TX 78245
|
- sq. feet
|
3 baths 4 beds |
show details | |

|
#39
NW 36th St
San Antonio, TX 78228
|
1,716 sq. feet
|
2 baths 4 beds |
show details | |

|
#40
Lark Ave
San Antonio, TX 78228
|
1,092 sq. feet
|
2 baths 4 beds |
show details |
| Photo | Address | Area | Beds / Baths | Price | Details |
|---|---|---|---|---|---|

|
#41
Santa Anna
San Antonio, TX 78201
|
1,220 sq. feet
|
2 baths 3 beds |
show details | |

|
#42
Denver Blvd
San Antonio, TX 78210
|
- sq. feet
|
2 baths 3 beds |
show details | |

|
#43
Hallie Pass
San Antonio, TX 78227
|
2,160 sq. feet
|
2 baths 3 beds |
show details | |

|
#44
Magnolia Hl
San Antonio, TX 78251
|
1,540 sq. feet
|
2 baths 3 beds |
show details | |

|
#45
Autumn Sun
San Antonio, TX 78254
|
- sq. feet
|
2 baths 4 beds |
show details | |

|
#46
Fern Hl
San Antonio, TX 78259
|
3,635 sq. feet
|
2 baths 3 beds |
show details | |

|
#47
Hoffman Plain
San Antonio, TX 78252
|
- sq. feet
|
2 baths 4 beds |
show details | |

|
#48
Pandorea
San Antonio, TX 78253
|
2,143 sq. feet
|
2 baths 3 beds |
show details | |

|
#49
Longtailed Duck
San Antonio, TX 78253
|
- sq. feet
|
2 baths 4 beds |
show details | |

|
Check over 1 million property listings on Foreclosure.com!
|
browse all offers | |||


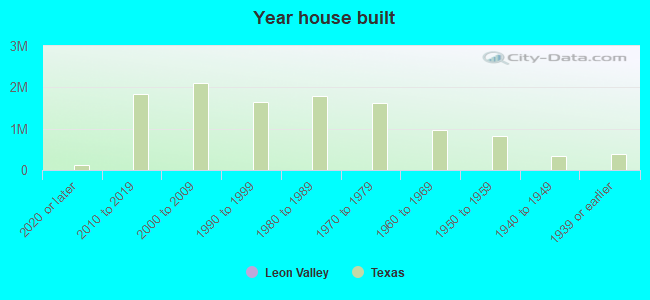
Median year apartment built: 1983
Household type by relationship:
Households: 11,744- Male householders: 2,353 (720 living alone), Female householders: 2,350 (726 living alone)
1,903 spouses (1,823 opposite-sex spouses), 329 unmarried partners, (316 opposite-sex unmarried partners), 3,358 children (3,084 natural, 74 adopted, 199 stepchildren), 284 grandchildren, 144 brothers or sisters, 294 parents, 35 foster children, 265 other relatives, 401 non-relatives
- In group quarters: 22
Size of family households: 1,327 2-persons, 819 3-persons, 568 4-persons, 203 5-persons, 116 6-persons, 40 7-or-more-persons.
Size of nonfamily households: 1,498 1-person, 142 2-persons, 51 3-persons.
1,231 married couples with children.
965 single-parent households (389 men, 576 women).
62.7% of residents of Leon Valley speak English at home.
28.8% of residents speak Spanish at home (74% speak English very well, 18% speak English well, 8% speak English not well).
0.9% of residents speak other Indo-European language at home (78% speak English very well, 10% speak English well, 9% speak English not well, 3% don't speak English at all).
6.7% of residents speak Asian or Pacific Island language at home (40% speak English very well, 47% speak English well, 6% speak English not well, 7% don't speak English at all).
0.3% of residents speak other language at home (100% speak English very well).
Foreign born population: 1,670 (14.2%)
(41.6% of them are naturalized citizens)
| Here: | 6.6 |
| State: | 6.3 |
| Here: | 3.6 |
| State: | 4.0 |
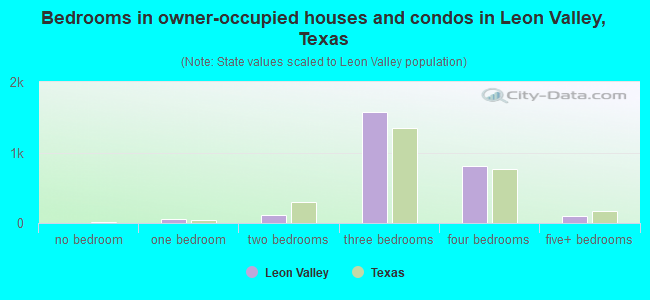
- Bedrooms in owner-occupied houses and condos in Leon Valley, Texas
- 0no bedroom
- 551 bedroom
- 1092 bedrooms
- 1,5683 bedrooms
- 8154 bedrooms
- 1055+ bedrooms
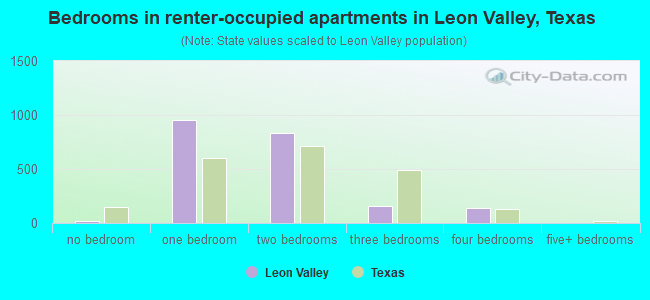
- Bedrooms in renter-occupied apartments in Leon Valley, Texas
- 16no bedroom
- 9581 bedroom
- 8362 bedrooms
- 1583 bedrooms
- 1354 bedrooms
- 05+ bedrooms
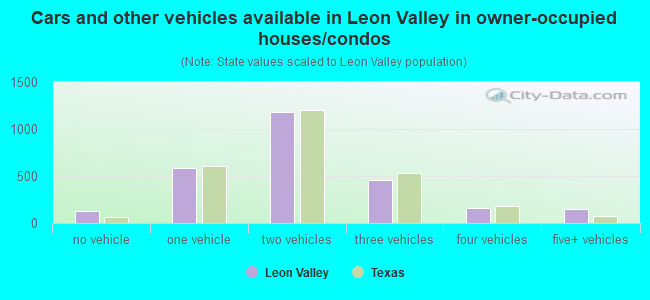
- Cars and other vehicles available in Leon Valley in owner-occupied houses/condos
- 128no vehicle
- 5821 vehicle
- 1,1822 vehicles
- 4573 vehicles
- 1554 vehicles
- 1485+ vehicles
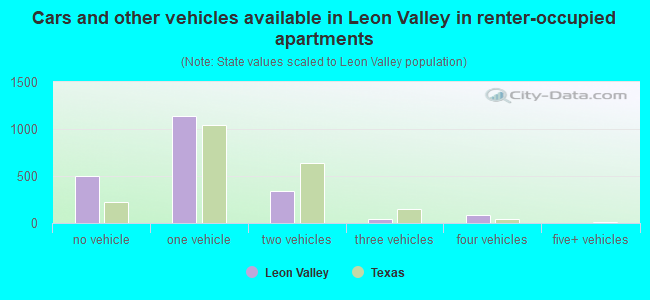
- Cars and other vehicles available in Leon Valley in renter-occupied apartments
- 505no vehicle
- 1,1351 vehicle
- 3432 vehicles
- 403 vehicles
- 804 vehicles
- 05+ vehicles
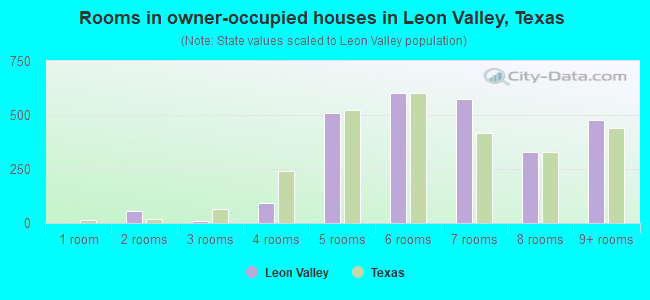
- Rooms in owner-occupied houses in Leon Valley, Texas
- 01 room
- 552 rooms
- 103 rooms
- 934 rooms
- 5105 rooms
- 6036 rooms
- 5757 rooms
- 3298 rooms
- 4799+ rooms
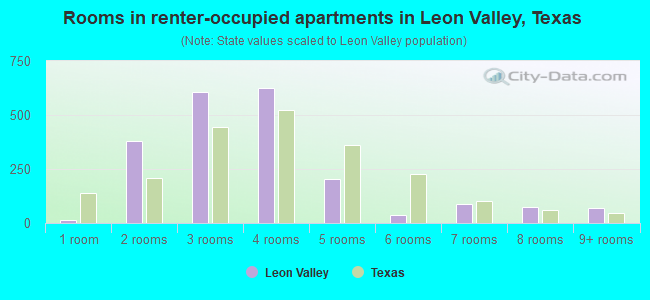
- Rooms in renter-occupied apartments in Leon Valley, Texas
- 161 room
- 3812 rooms
- 6073 rooms
- 6274 rooms
- 2025 rooms
- 366 rooms
- 887 rooms
- 758 rooms
- 719+ rooms
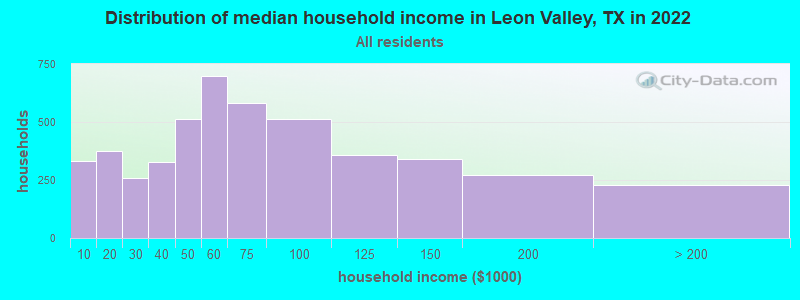
Leon Valley, TX household income distribution

- 334Less than $10,000
- 377$10,000 to $19,999
- 257$20,000 to $29,999
- 327$30,000 to $39,999
- 515$40,000 to $49,999
- 698$50,000 to $59,999
- 583$60,000 to $74,999
- 511$75,000 to $99,999
- 356$100,000 to $124,999
- 342$125,000 to $149,999
- 271$150,000 to $199,999
- 227$200,000 or more
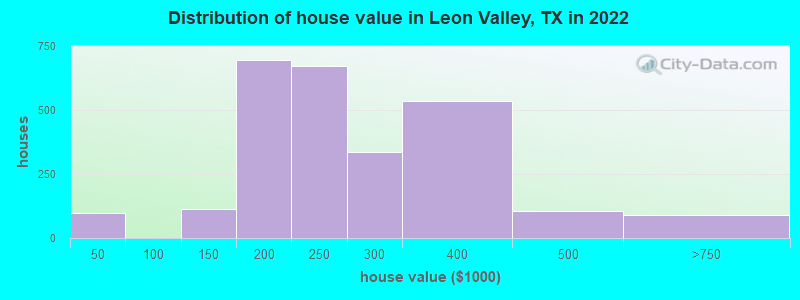
Home value of owner - occupied houses in 2022 in Leon Valley, TX
-
- 43Less than $10,000
- 5$15,000 to $19,999
- 28$25,000 to $29,999
- 18$35,000 to $39,999
- 54$100,000 to $124,999
- 60$125,000 to $149,999
- 269$150,000 to $174,999
- 424$175,000 to $199,999
- 670$200,000 to $249,999
- 335$250,000 to $299,999
- 535$300,000 to $399,999
- 107$400,000 to $499,999
- 76$500,000 to $749,999
- 11$750,000 to $999,999
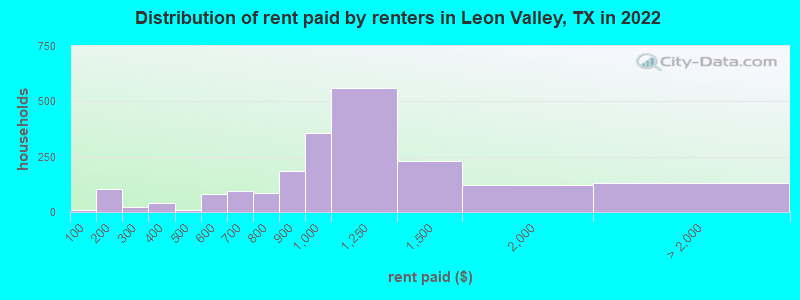
Rent paid by renters in 2022 in Leon Valley, TX
-
- 6Less than $100
- 6$100 to $149
- 99$150 to $199
- 15$200 to $249
- 6$250 to $299
- 26$300 to $349
- 12$350 to $399
- 8$400 to $449
- 11$500 to $549
- 69$550 to $599
- 65$600 to $649
- 28$650 to $699
- 16$700 to $749
- 70$750 to $799
- 184$800 to $899
- 354$900 to $999
- 558$1,000 to $1,249
- 230$1,250 to $1,499
- 120$1,500 to $1,999
- 41$2,000 to $2,499
- 90No cash rent
Percentage of workers working in this county: 93.8%
Number of people working at home: 407 (7.5% of all workers)
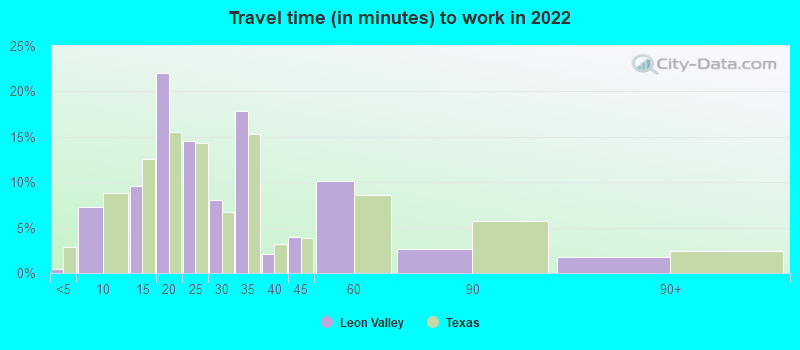
Travel time to work (commute)
- Less than 5 minutes: 0
- 5 to 9 minutes: 399
- 10 to 14 minutes: 565
- 15 to 19 minutes: 778
- 20 to 24 minutes: 816
- 25 to 29 minutes: 732
- 30 to 34 minutes: 775
- 35 to 39 minutes: 58
- 40 to 44 minutes: 64
- 45 to 59 minutes: 345
- 60 to 89 minutes: 114
- 90 or more minutes: 249
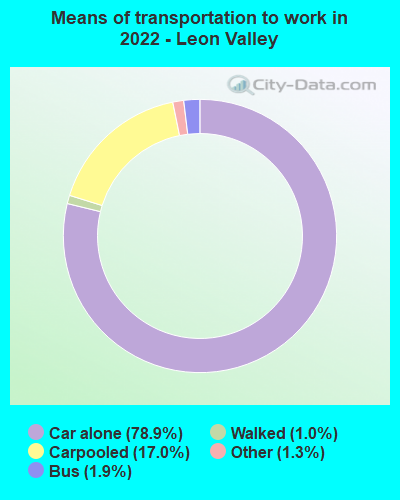
Means of transportation to work:
- Drove a car alone: 4,836 (70.4%)
- Carpooled: 1,181 (17.2%)
- Bus: 132 (1.9%)
- Taxi: 91 (1.3%)
- Walked: 68 (1.0%)
- Worked at home: 407 (5.9%)
- Unemployment by race in 2022
- Unemployment rate for White non-Hispanic residents
- 2.9%Males
- 5.7%Females
- Unemployment rate for Black residents
- 16.9%Males
- Unemployment rate for other race residents
- 16.3%Males
- 25.4%Females
- Unemployment rate for two or more race residents
- 6.1%Males
- 10.3%Females
- Unemployment rate for Hispanic or Latino residents
- 4.9%Males
- 7.9%Females
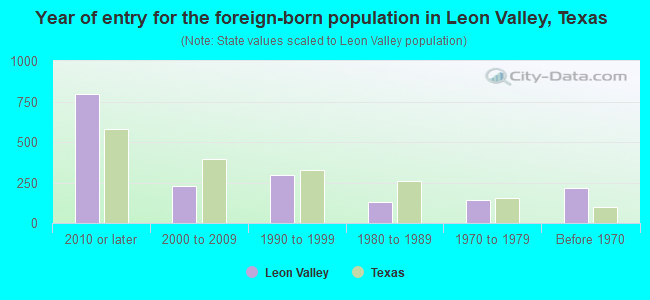
- Year of entry for the foreign-born population in Leon Valley, Texas
- 7952010 or later
- 2292000 to 2009
- 2981990 to 1999
- 1291980 to 1989
- 1441970 to 1979
- 217Before 1970
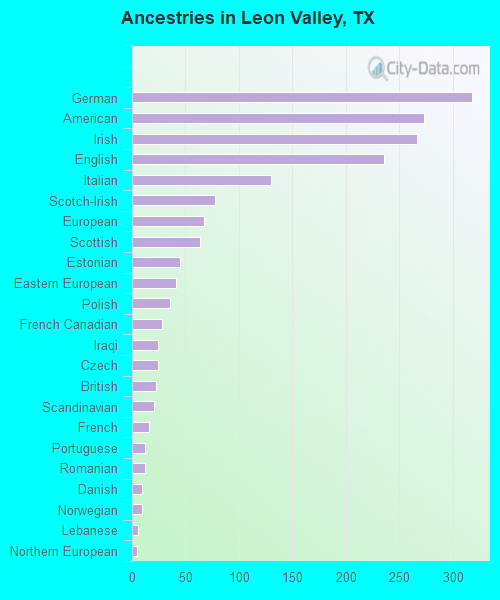
First ancestries reported:
- German: 318 (4.2%)
- American: 273 (3.6%)
- Irish: 267 (3.5%)
- English: 236 (3.1%)
- Italian: 130 (1.7%)
- Scotch-Irish: 78 (1.0%)
- European: 67 (0.9%)
- Scottish: 64 (0.8%)
- Estonian: 45 (0.6%)
- Eastern European: 41 (0.5%)
- Polish: 36 (0.5%)
- French Canadian: 28 (0.4%)
- Iraqi: 24 (0.3%)
- Czech: 24 (0.3%)
- British: 22 (0.3%)
- Scandinavian: 21 (0.3%)
- French: 16 (0.2%)
- Portuguese: 12 (0.2%)
- Romanian: 12 (0.2%)
- Danish: 9 (0.1%)
- Norwegian: 9 (0.1%)
- Lebanese: 6 (0.08%)
- Northern European: 5 (0.07%)
Most common places of birth for foreign-born residents (%):
| Leon Valley: | 33.1% (570) |
| Texas: | 2.1% (103,148) |
| Leon Valley: | 31.3% (539) |
| Texas: | 48.4% (2,411,723) |
| Leon Valley: | 8.5% (146) |
| Texas: | 3.7% (184,770) |
| Leon Valley: | 3.0% (51) |
| Texas: | 6.1% (306,347) |
| Leon Valley: | 2.7% (46) |
| Texas: | 4.5% (224,455) |
| Leon Valley: | 2.1% (37) |
| Texas: | 0.1% (3,669) |
| Leon Valley: | 1.7% (30) |
| Texas: | 0.2% (9,236) |
| Leon Valley: | 1.6% (27) |
| Texas: | 1.5% (72,413) |
| Leon Valley: | 1.5% (26) |
| Texas: | 1.8% (87,382) |
| Leon Valley: | 1.5% (26) |
| Texas: | 0.4% (21,746) |
Place of birth for U.S.-born residents:
- This state: 7,737
- Other state: 2,047
- Northeast: 282
- Midwest: 617
- South: 437
- West: 702
88.2% of Leon Valley residents lived in the same house 1 years ago.
Out of people who lived in different houses, 45.1% lived in this county.
Out of people who lived in different counties, 40.3% lived in Texas.
| Leon Valley: | 88.2% |
| State average: | 85.7% |
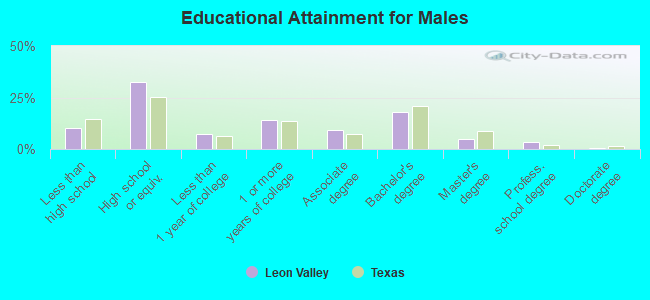
Education attainment for males 25 years and older:
- No schooling: 105
- Nursery to 4th grade: 35
- 5th and 6th grade: 2
- 7th and 8th grade: 48
- 9th grade: 8
- 10th grade: 104
- 11th grade: 97
- 12th grade, no diploma: 0
- High school graduate (or equivalency): 1,265
- Less than 1 year of college: 283
- Some college more than 1 year, no degree: 545
- Associate degree: 360
- Bachelor's degree: 694
- Master's degree: 190
- Professional school degree: 132
- Doctorate degree: 23
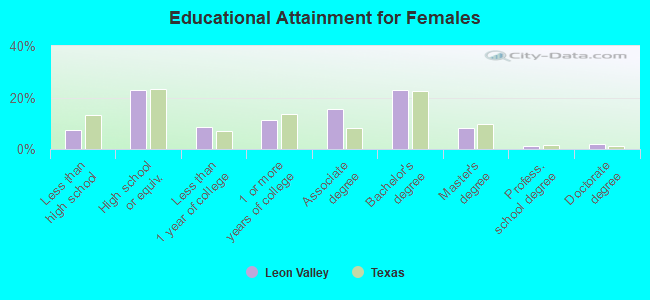
Education attainment for females 25 years and older:
- No schooling: 33
- Nursery to 4th grade: 41
- 5th and 6th grade: 0
- 7th and 8th grade: 49
- 9th grade: 12
- 10th grade: 22
- 11th grade: 97
- 12th grade, no diploma: 80
- High school graduate (or equivalency): 1,038
- Less than 1 year of college: 377
- Some college more than 1 year, no degree: 513
- Associate degree: 696
- Bachelor's degree: 1,031
- Master's degree: 366
- Professional school degree: 60
- Doctorate degree: 80
Housing units in structures:
- One, detached: 3,006
- One, attached: 216
- Two: 108
- 3 or 4: 289
- 5 to 9: 474
- 10 to 19: 396
- 20 to 49: 76
- 50 or more: 554
- Mobile homes: 23
- Boats, RVs, vans, etc.: 54
Housing units lacking complete kitchen facilities in 2022: 2.1%
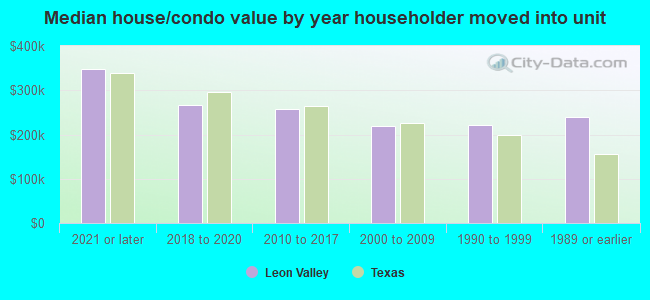
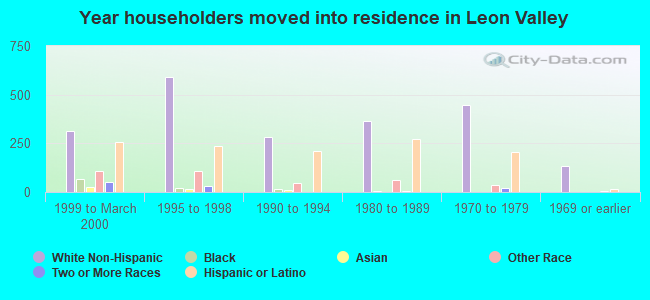
House/condo owner moved in on average 14 years ago
Renter moved in on average 1 years ago
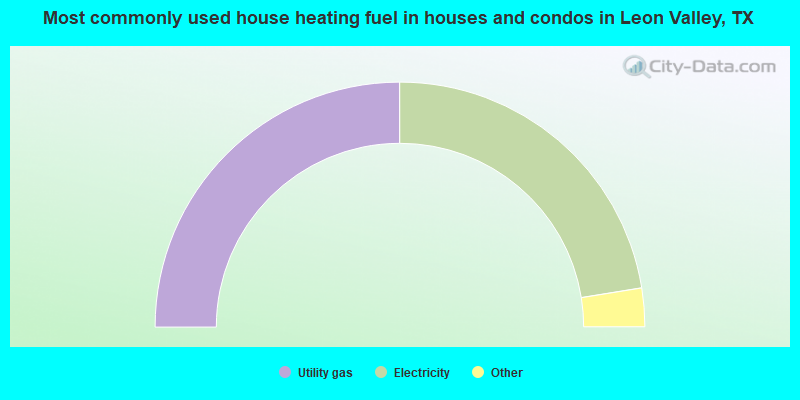
- 50.0%Utility gas
- 45.0%Electricity
- 2.4%Solar energy
- 1.6%Bottled, tank, or LP gas
- 1.1%No fuel used
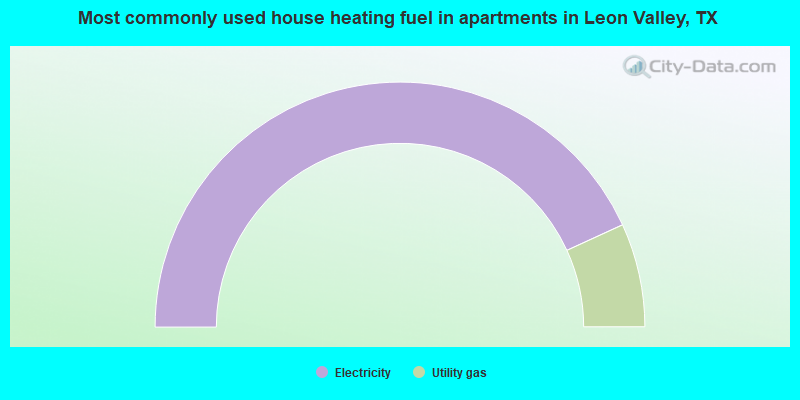
- 86.3%Electricity
- 13.7%Utility gas
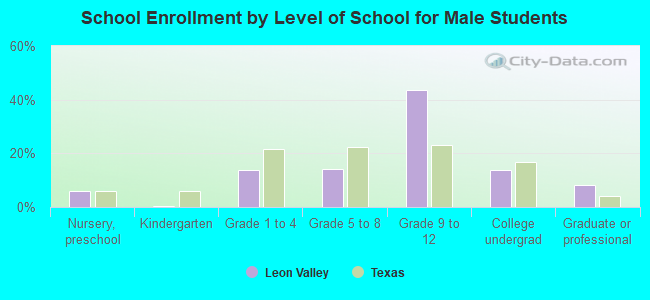
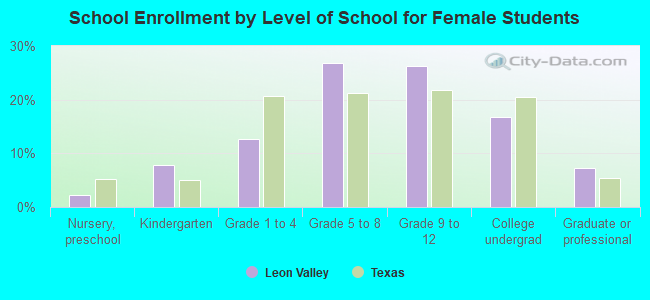
Private vs. public school enrollment:
| Here: | 12.0% |
| Texas: | 8.8% |
| Here: | 11.0% |
| Texas: | 8.0% |
| Here: | 7.3% |
| Texas: | 16.2% |